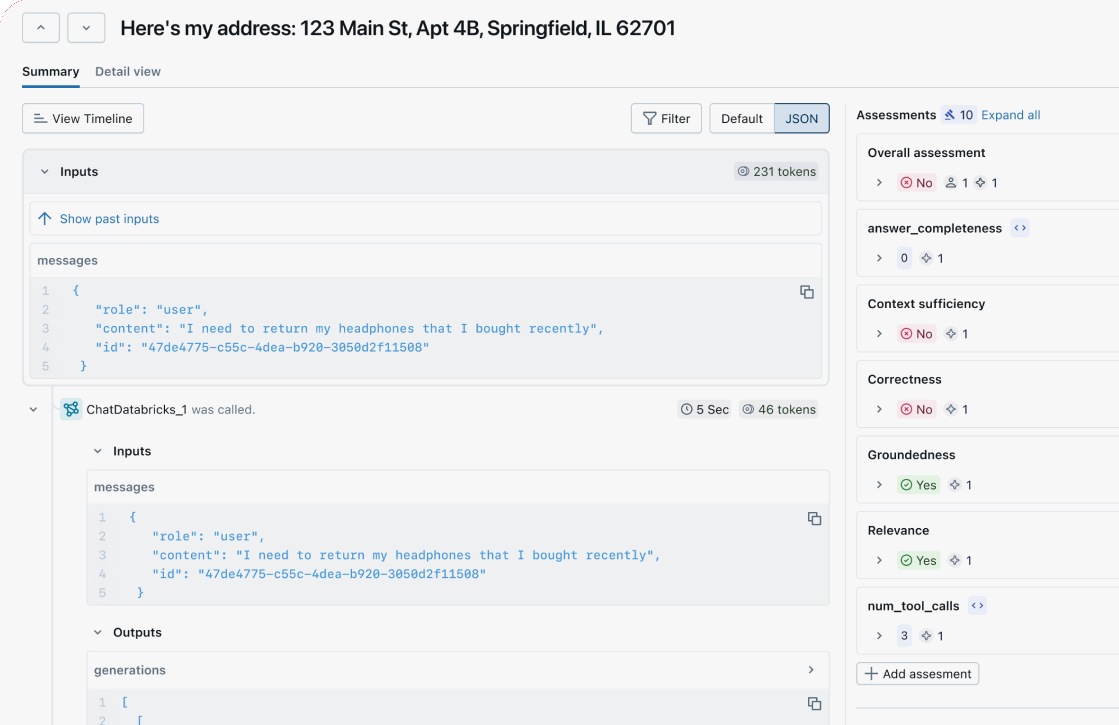
Rich, detailed traces for every request
End to end observability
Capture your agent or LLM application's inputs, outputs, and step-by-step execution: prompts, retrievals, tool calls, and more.
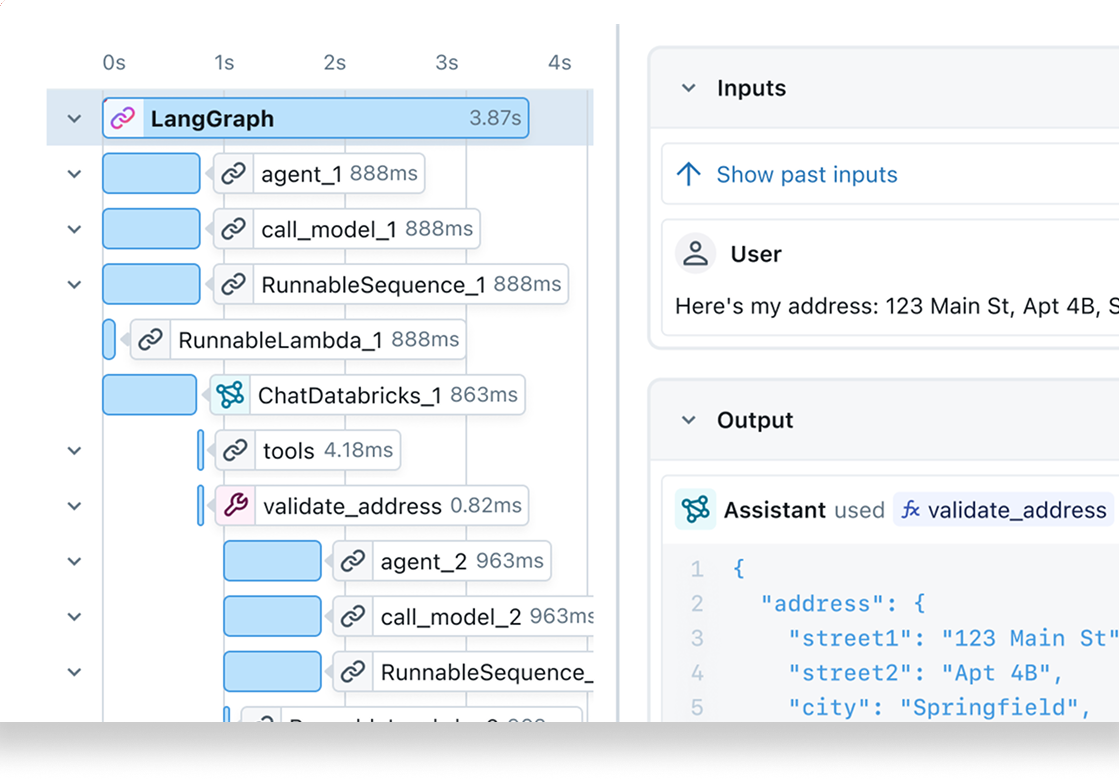
Visualize execution flow
Deep dive into your agent or LLM application's logic and latency with a comprehensive and intuitive UI for effective debugging.
Quality monitoring
Track and analyze the quality of your agent or LLM application over time, and take action to fix issues before impact spreads.
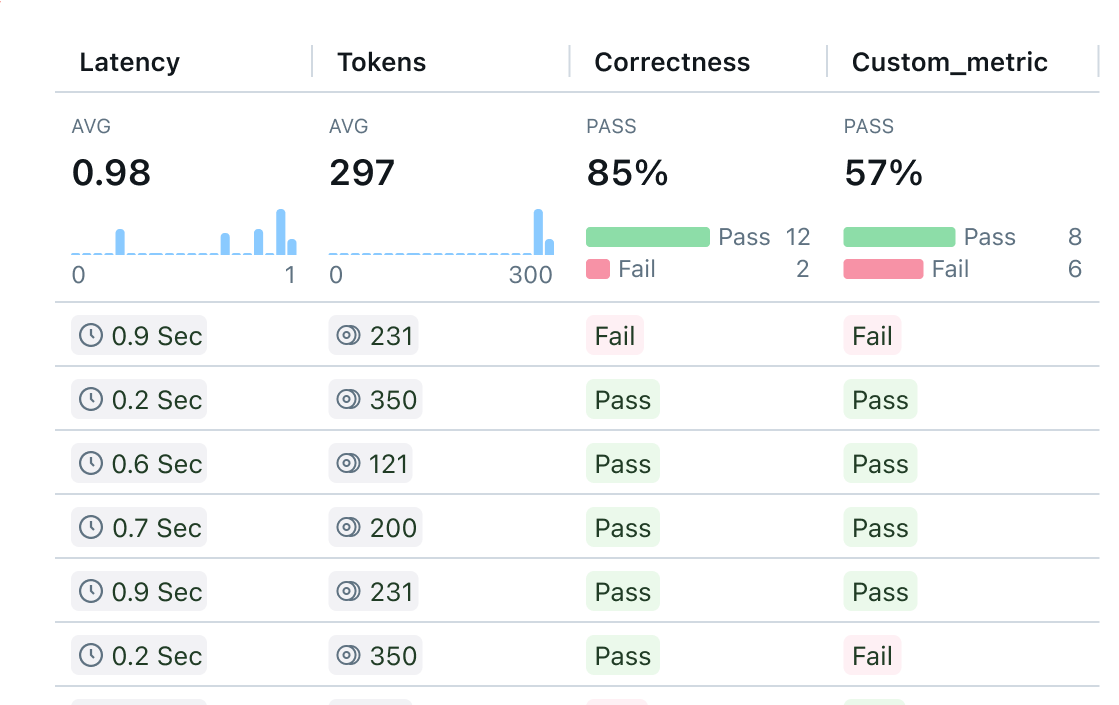
Spot trends and patterns at scale
Zoom out with a simplified summary UI to quickly review many traces at once to understand how your agent or LLM application is performing overall.
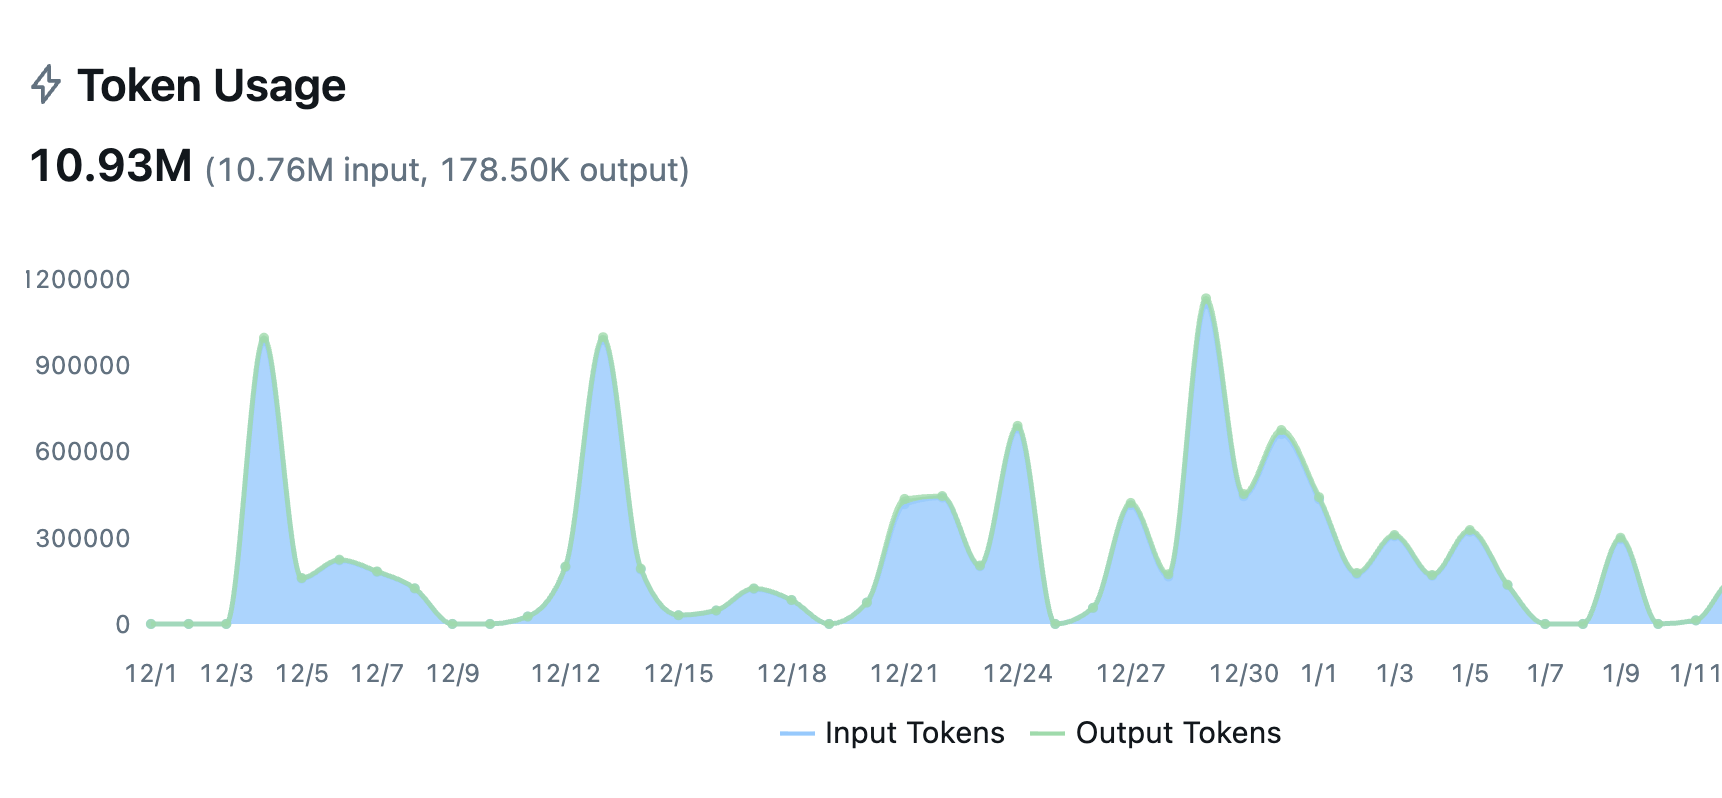
Automatic tracing for your entire stack
Auto-trace 50+ LLM providers and agent frameworks with a single line of code. LLM tracing captures every execution step, and MLflow is OpenTelemetry compatible, supporting any programming language, agent, or LLM.
Get Started in 3 Simple Steps
From zero to full observability in minutes. No complex setup or major code changes required.Get Started →
1
Start MLflow Server
One command to get started. Docker setup is also available.
bash
~30 seconds
2
Enable Logging
Add minimal code to start capturing traces, metrics, and parameters
python
~30 seconds
3
Run your code
Run your code as usual. Explore traces and metrics in the MLflow UI.
python
~1 minute