CrewAI Monitoring: 6 MLflow Steps for Enterprise MLOps

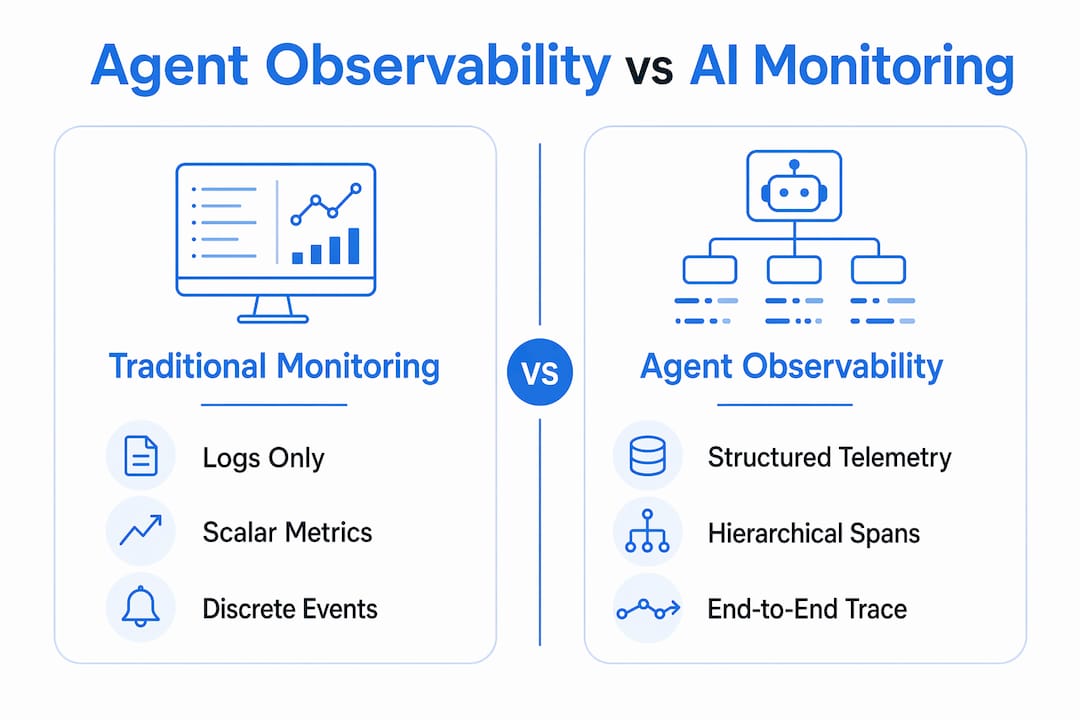
For observability of agentic LLM workflows, MLflow provides the tools that matter most: deep tracing of agent reasoning, automated evaluation through LLM-as-a-Judge, a prompt registry with immutable versions and aliases, and an AI Gateway for cross-provider governance. That combination is what "crewai monitoring" should mean in production: not a single dashboard, but a full observability stack built for enterprise MLOps teams instrumenting agents at scale.
TL;DR:
- Deep tracing captures every sub-decision and tool call, enabling replay and detailed analysis of agent reasoning paths.
- Structuring logs, metadata, and versioned prompts ensures traceability and facilitates troubleshooting across complex workflows.
- Automated evaluation with LLM-as-a-Judge turns subjective quality assessments into measurable, alertable metrics.
- Prompt versions are managed as immutable entities with alias-based rollouts, simplifying rollback and version control.
- Handling high workloads requires intelligent sampling, distributed storage, and clear role-based access controls to maintain security and scalability.
Table of Contents
-
What Are the Core Components of MLflow Observability for Agents?
-
What Security and Privacy Considerations Apply to Agent Monitoring?
-
How Do You Detect Anomalies in Agentic Workflows in Real Time?
What Is Agentic LLM Workflow Observability?
Standard model monitoring watches inputs, outputs, and latency for a single inference call. Agentic workflow observability is a different problem. An agent might make a dozen tool calls, reason across multiple sub-agents, and revise its own plan mid-execution, and you need visibility into every one of those decisions, not just the final answer.
That gap is why goals like traceability, reproducibility, safety, and quality assurance need to map to concrete artifacts: spans for each reasoning step, structured logs tied to specific runs, versioned prompts you can diff against production, and evaluation records that turn subjective judgment into data you can query. Without that mapping, "monitoring" becomes a log dump nobody reads.
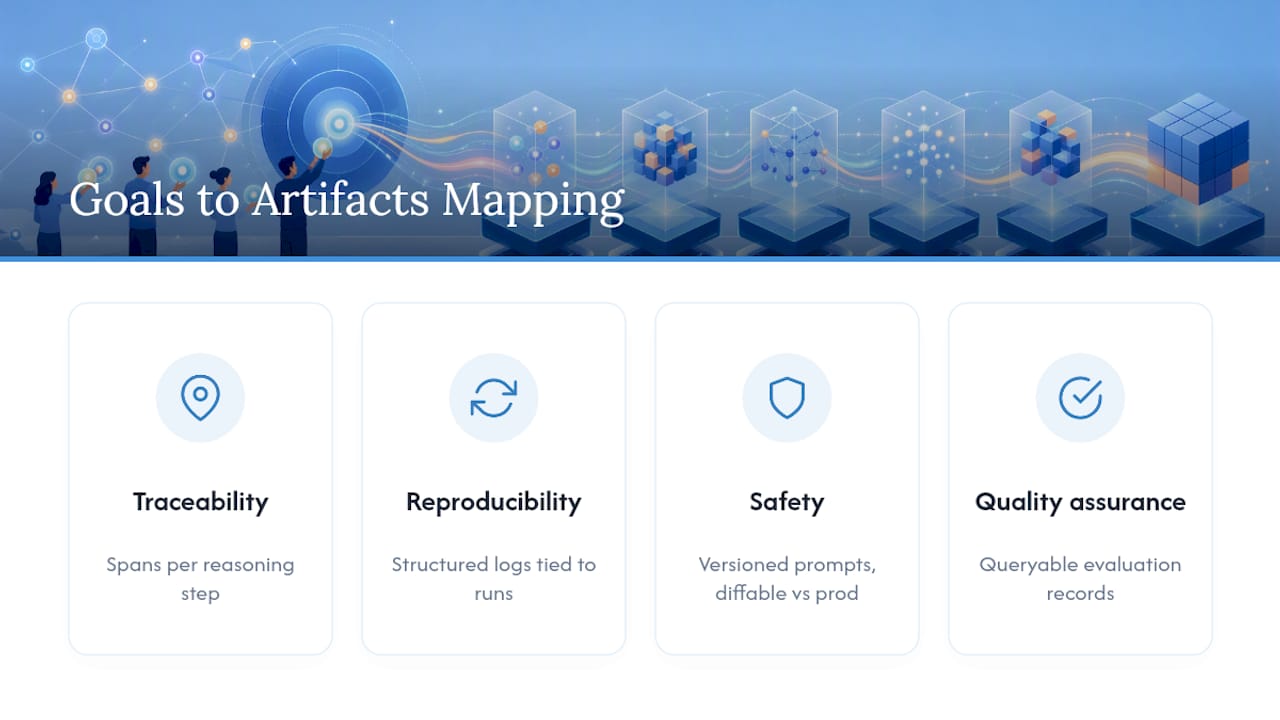
MLflow's documentation frames this as capturing run-level artifacts, traces, and evaluation records together, rather than treating tracing, evaluation, and prompt governance as separate systems. The rest of this guide walks through each component MLflow provides, then how to wire them into a production pipeline.
What Are the Core Components of MLflow Observability for Agents?
An effective agent observability stack breaks into five pieces, and each one solves a distinct failure mode teams hit when they move agents from a notebook into production.
- Deep tracing. Every sub-decision, tool call, and state transition gets recorded as a span, so you can replay exactly how an agent reached a conclusion instead of guessing from the final output. MLflow's multi-agent observability patterns show how span boundaries map to individual agent hops in a crew, not just the top-level task.
- Structured logs and metadata. Runs, prompts, artifacts, and traces get correlated through shared identifiers, so a failed output can be traced back to the exact prompt version and model configuration that produced it.
- Automated evaluation. LLM-as-a-Judge workflows score agent outputs against defined criteria, and those judge scores become metrics you can chart, threshold, and alert on, the same way you'd treat accuracy or F1 in classical ML monitoring.
- Prompt registry. Prompts get immutable versions with commit messages, a diff UI for comparing changes, and aliases that map friendly names like "production" to specific version numbers.
- AI Gateway. A central point for prompt management and governance across providers, so teams aren't rebuilding access control and audit trails separately for every LLM vendor they use.
Together, these five components answer the question every MLOps lead eventually asks: not "is the agent running," but "why did it do that, and can I prove it."
How Do You Instrument Agents for Observability?
Getting from "we have an agent" to "we have observability" is mostly a sequencing problem. Do these roughly in order:
- Define run boundaries first. Decide what constitutes one MLflow run for your crew: the whole task, or each sub-agent invocation. Nest trace spans inside that run for orchestration steps and individual sub-agent calls.
- Attach prompt URIs and aliases to every run artifact. Every run should record which prompt version produced it, not just which model.
- Wire in context propagation. Use OpenTelemetry or an equivalent to export distributed traces, especially when agents span multiple services or containers.
- Hook evaluation into your pipeline. Run LLM-as-a-Judge scoring as a post-run step or as a CI gate before a new prompt version reaches production.
- Set aliases for each deployment stage. Map "canary," "staging," and "production" aliases to specific prompt versions so promotion is a metadata change, not a redeploy.
- Persist evaluation outputs next to run records. Store judge scores, rationale text, and any flagged failures alongside the run itself, so an audit six months later doesn't require reconstructing context from scratch.
Pro Tip: Instrument your highest-risk agent first, even if it's not your most complex one. The agent most likely to produce a costly or embarrassing output teaches you the most about what your trace schema is missing before you scale instrumentation everywhere else.
How Should You Manage Prompt Versions and Rollouts?
Prompt changes are code changes, and they deserve the same rigor you'd apply to a deploy. MLflow's Prompt Registry treats every prompt version as immutable, with a commit message explaining what changed and why, which gives you an audit trail that survives staff turnover and postmortems alike.
The practical workflow looks like this:
- Create a new version whenever prompt text changes, never overwrite an existing version in place.
- Assign aliases such as
beta,staging, andproductionto specific versions, then move the alias, not the code, when you promote a change. - Review side-by-side diffs before promoting a version, so reviewers see the exact wording delta rather than trusting a changelog summary.
- Set approval gates that require an evaluation score above a defined threshold before a version can receive the
productionalias. - Define retention policies for old versions so your audit history doesn't silently disappear when someone runs a cleanup script.
This alias pattern is what makes rollback fast: reverting a bad prompt is a one-line alias reassignment (mlflow.genai.set_prompt_alias), not a redeploy. That distinction matters when a bad prompt is live and every minute counts.
Where Does MLflow Fit in Your Orchestration Pipeline?
A platform like this typically sits between your orchestrator and your observability backend, not instead of either. Instrument your orchestration layer to call run.start and run.end around each agent task, and attach trace context so spans carry through to sub-agent calls automatically.
Export those traces via OpenTelemetry to whatever backend your team already uses for infrastructure monitoring. That gives you one telemetry format across agent-level traces and the infrastructure logs your SRE team already watches, instead of maintaining two disconnected systems.
For CI/CD, automate judge-based gates so a prompt or model change can't merge if it drops evaluation scores below your threshold. MLflow's prompt engineering cookbook walks through patterns for wiring evaluation into a build pipeline. Plan your storage and retention strategy early. Trace volume for high-throughput agents adds up fast, and figuring out retention after you've filled a disk is the wrong order of operations.
Which KPIs Matter Most for Agentic LLM Monitoring?
Five metrics cover most of what you need to know about an agent's health in production:
- Task success rate. The percentage of runs that complete the intended task without human intervention.
- Judge score distributions. Not just the average, but the spread. A stable mean hiding a growing tail of low scores is an early warning sign.
- Latency per decision. Measured per reasoning step, not just end to end, so you can find which sub-agent is the bottleneck.
- Tool-call failure rate. How often an agent's external tool invocations error out or return unusable results.
- Evaluation regression rate. How often a new prompt or model version scores worse than the version it replaced.
Turn LLM-as-a-Judge outputs into alerts by defining severity tiers: a moderate score drop triggers a notification, a severe one triggers an automated rollback to the previous prompt alias. For noisy signals, apply a moving window rather than alerting on single-run dips, and route borderline cases to a human reviewer instead of an automatic action.
Pro Tip: *A single bad judge score is noise.
What Security and Privacy Considerations Apply to Agent Monitoring?
Traces and logs from agentic workflows often contain more sensitive data than teams expect, because agent reasoning chains capture intermediate context, not just final outputs. A customer support agent's trace might include account numbers, health details, or internal system prompts that were never meant to leave the sandbox.
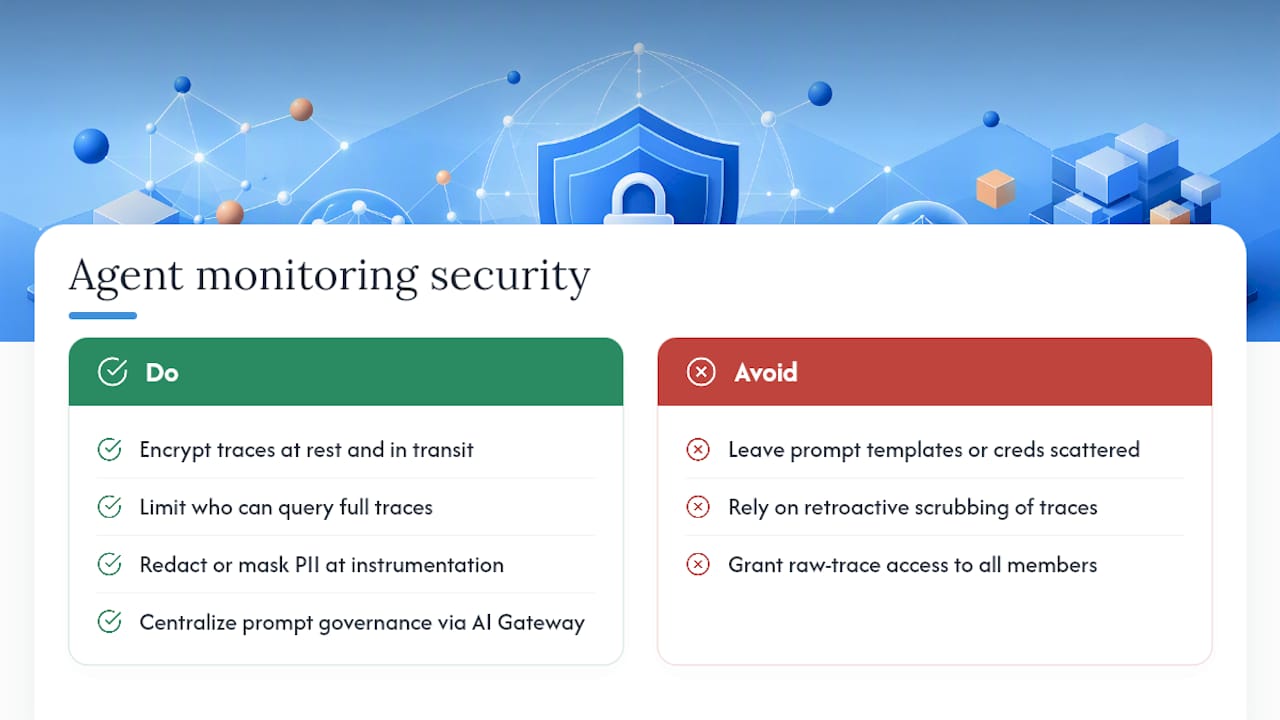
Treat trace storage with the same access discipline you apply to production databases. Encrypt traces at rest and in transit, and scope who can query full trace detail versus aggregate metrics. Not every team member needs to see raw reasoning chains to monitor success rates.
Redact or mask personally identifiable information before it lands in long-term trace storage, ideally at the instrumentation layer rather than after the fact. Retroactive scrubbing across months of trace history is expensive and error-prone.
Prompt governance through a central AI Gateway also closes a real security gap: without it, teams often end up with prompt templates and API credentials scattered across notebooks and service configs, each with its own access model. Centralizing that management gives you one place to audit who changed what prompt, and one place to revoke access when someone leaves the team.
Data residency matters too, especially for agents that call multiple LLM providers. Know which provider processes which data, and make sure your gateway configuration respects any contractual or regulatory constraints on where that data can travel.
How Do You Detect Anomalies in Agentic Workflows in Real Time?
Anomaly detection in agent systems fails when teams apply static thresholds designed for simple API monitoring. Agent behavior is more variable by nature, so a fixed latency ceiling that works for a single-call model endpoint will generate constant false alarms for a multi-step reasoning agent.
Baseline against your own historical distribution instead of an arbitrary number. Track rolling percentiles for latency and judge scores over a trailing window, and alert on deviation from that baseline rather than a hardcoded value.
Watch for compounding failures specifically. A single failed tool call rarely crashes an agent, but three failed calls in a row often precede a full task failure. Detecting the pattern early, rather than waiting for the final failure, gives you a chance to intervene before a user sees a bad result.
Separate anomaly types by likely cause: a spike in latency with stable judge scores usually points to an infrastructure or provider issue, while stable latency with dropping judge scores usually points to a prompt or context problem. Routing these to different responders speeds up resolution considerably.
Human-in-the-loop escalation still matters here. Fully automated remediation works for clear-cut cases like a provider outage, but ambiguous quality drops deserve a person reviewing actual trace data before triggering a rollback that might mask a real product issue.
How Should Monitoring Systems Handle Errors and Failures?
Fault tolerance in a monitoring system means the observability layer doesn't become a second point of failure when the thing it's watching breaks. If your tracing pipeline crashes the same moment your agent has a bad run, you lose the exact data you need to diagnose it.
Buffer trace and log writes locally before shipping them to your backend, so a temporary network issue or backend outage doesn't silently drop telemetry. Design for graceful degradation: if the evaluation pipeline is down, the agent should still run and log raw outputs for evaluation later, rather than blocking on a judge call that isn't available.
Build retry logic with backoff for evaluation gates in CI, since transient API errors from an LLM-as-a-Judge call shouldn't fail an entire deployment pipeline. Distinguish between a genuine evaluation failure and an infrastructure hiccup, and treat them differently in your gate logic.
Keep a dead-letter path for telemetry that fails to write anywhere else, so nothing gets lost outright even when the primary storage path has an incident. Reviewing that dead-letter queue periodically catches instrumentation bugs before they become blind spots.
How Do You Scale Monitoring for Large CrewAI Deployments?
Trace volume grows faster than most teams expect once agent crews move from pilot to full production. A crew running dozens of sub-agent calls per task, multiplied across thousands of daily tasks, generates a volume of span data that can quickly overwhelm storage assumptions built during a proof of concept.
Sample intelligently rather than capturing every span at full fidelity forever. Full-detail tracing on 100% of production traffic is valuable during rollout, but a sampling strategy that keeps full detail on failures and a percentage of successes usually preserves what you need for debugging while controlling storage costs.
Partition retention by value. Keep evaluation records and flagged failures indefinitely for audit purposes, but apply shorter retention windows to routine successful traces where the marginal audit value is low.
Distribute the query load, not just the storage. Dashboards querying live trace data across a large deployment can strain the same backend your alerting depends on. Separating hot-path alerting queries from ad hoc analytical queries avoids a debugging session accidentally degrading your production alerting.
Plan for multi-team ownership early. Once a platform serves several product teams running their own crews, a shared observability backend needs clear conventions for naming, tagging, and namespacing runs, or cross-team debugging turns into archaeology.
Who Should Have Access to Agent Monitoring Data?
Role-based access control for monitoring tools isn't optional once trace data includes anything sensitive, and given the point above about what agent traces tend to capture, it usually does.
Define at least three tiers: engineers who need full trace detail to debug, product or QA staff who need aggregate metrics and judge scores without raw reasoning chains, and auditors who need historical prompt version history and evaluation records but not live operational access.
Tie prompt registry permissions to deployment risk. Promoting a prompt version to a production alias should require different approval than creating a beta version, and that distinction should be enforced by tooling, not just team norms that erode under deadline pressure.
Log access to trace data itself, not just changes to prompts or models. If a trace contains customer data, knowing who viewed it is as important as knowing who changed the prompt that generated it. Review access logs periodically, especially after team changes, since stale permissions accumulate quietly until an incident forces an audit.
A Practical Take on Getting Started with MLflow
MLflow's advantage isn't any single feature. It's that tracing, evaluation, prompt governance, and gateway management live in one platform instead of four disconnected tools duct-taped together. Teams that succeed with agent observability tend to instrument one high-risk crew end to end before rolling the pattern out broadly, rather than trying to add tracing everywhere at once.
Start small, prove the pattern, then scale the same instrumentation across your fleet of agents.
— Kevin
Get Started With MLflow for Agent Observability
This platform is fully open source, governed under the Linux Foundation, with no enterprise feature paywall separating tracing, evaluation, prompt governance, and the AI Gateway. That matters if you've priced out observability platforms that gate automated evaluation or prompt versioning behind a premium tier. Everything covered in this guide, from run-level tracing to LLM-as-a-Judge scoring to alias-based rollouts, ships in the same open-source distribution.

If you're ready to instrument your first crew, start with the MLflow homepage for installation, then move to the agent and LLM engineering overview to see how orchestration support fits your stack. For teams building evaluation gates, the LLM-as-a-Judge documentation walks through scoring setups you can wire into CI today. Pull up the AI observability page and pick one production agent to instrument this week. That single run is how every large-scale deployment actually starts.
FAQ
What Does "CrewAI Monitoring" Mean With MLflow?
In this context, it means using MLflow's observability stack to trace agent reasoning, automatically evaluate outputs, and govern prompt versions for production agentic workflows. It covers tracing, LLM-as-a-Judge evaluation, the prompt registry, and the AI Gateway together, rather than any single dashboard.
How Much Does MLflow Cost?
MLflow is open source and free to use, with pricing for enterprise support or managed options available directly on the MLflow site. There's no published flat rate for enterprise services, so check current terms there.
What Is LLM-as-a-Judge Evaluation?
It's a method where another LLM scores an agent's output against defined criteria, turning subjective quality judgments into quantitative metrics. MLflow's LLM-as-a-Judge framework lets teams feed those scores into CI gates and monitoring dashboards automatically.
How Do Prompt Aliases Help With Rollbacks?
Aliases map a friendly name like production to a specific immutable prompt version, so reverting a bad change means reassigning the alias, not redeploying code. MLflow's prompt registry supports this pattern natively with commit messages and diff views for every version.
Can MLflow Handle Distributed Tracing Across Multiple Agents?
Yes. MLflow supports context propagation so traces stay correlated across sub-agent calls and services, and teams commonly export that data via OpenTelemetry to their existing observability backend. The multi-agent observability guide covers span boundary patterns for crews with several cooperating agents.