Benchmarking AI Agent Performance: A Practical Protocol

Benchmark agent performance by scoring execution traces, reliability, and cost — not final answers alone. The most defensible evaluation combines trace-based trajectory scoring, bootstrap confidence intervals for uncertainty reporting, mid-difficulty task filtering inspired by Item Response Theory, and full scaffold documentation. Here is what to do right now:
- Run every configuration across at least three seeds and report variance alongside mean scores.
- Capture full execution traces, not just terminal states, so you can detect silent failures and inefficient paths.
- Filter your task pool to items with historical pass rates in a moderate difficulty range to concentrate discriminative signal.
- Record your complete scaffold: framework version, plugins, routing config, and tool versions.
- Include cost per task (tokens, wall time) as a first-class metric alongside accuracy.
Table of Contents
- Why current AI-agent benchmarks so often mislead you
- A practical checklist for trustworthy agent benchmarks
- How to preserve ranking fidelity while cutting evaluation cost
- What to measure and how to report it
- Designing tasks and simulators for reliable evaluation
- How to use LLM judges without letting them corrupt your results
- What to publish so others can reproduce your benchmark
- Budgeting compute, human, and time costs for your benchmark
- Running repeatable, auditable benchmarks with Mlflow
- Key Takeaways
- The field is solving the wrong problem first
- Mlflow gives you the infrastructure to benchmark agents correctly
- Primary sources and further reading
Why current AI-agent benchmarks so often mislead you
Most agent benchmarks produce confident-looking numbers that don't survive a second run. The failure modes are specific and well-documented, and recognizing them is the first step toward fixing them.
Seed noise swamps the capability signal
ClawBench found that A large portion of the 40-task score variance it measured was attributable to seed noise — specifically, 47% of variance was seed noise and only 52.7% reflected genuine capability differences. That means a single-run leaderboard is nearly as informative as a coin flip for distinguishing close competitors. Rankings flip, papers get published, and engineering decisions get made on noise.
Final-answer checks hide what actually went wrong
An agent that reaches the correct terminal state via an unsafe or wildly inefficient path looks identical to a well-behaved agent under final-answer scoring. Path-based metrics like Path Correctness, Harmful-Call Rate, and step Efficiency expose those differences. A "successful" agent that skipped a verification step, issued a destructive tool call, or looped through 40 redundant API calls before landing on the right answer is not a good agent.
Scaffold and configuration dominate measured variance
"Swapping plugin configuration can produce score swings 10x larger than swapping the model itself." — ClawBench configuration diagnostics
This is the most underappreciated failure mode in the field. Researchers attribute score differences to model capability when the real driver is orchestration framework version, tool routing, or a changed system prompt. If you don't fingerprint your scaffold, you can't separate model signal from environment noise. Worse, a team that upgrades its framework mid-experiment may unknowingly invalidate its own baseline.
Grading bugs and judge instability
Deterministic verifiers and LLM judges frequently disagree, and neither is always right. Verifiers can have label bugs — incorrect gold outputs, ambiguous success criteria, or brittle string-match checks that penalize valid alternative solutions. LLM judges introduce their own instability: they can reward verbose-but-wrong responses, be sensitive to prompt phrasing, and produce different verdicts across runs on identical inputs. When your grader is broken, metric gaming becomes trivial.
Token snowball and expensive failures
SWE-Effi documented that unresolved agent attempts consumed more than 4x the tokens and wall time of successful ones. An agent that fails expensively is a qualitatively different problem from one that fails cheaply. Benchmarks that ignore cost mask this distinction entirely, making economically infeasible agents look competitive with practical ones.
A practical checklist for trustworthy agent benchmarks
Use this as your minimum bar before publishing results or making engineering decisions based on benchmark data. Each item maps to a specific failure mode from the section above.
- Curate tasks by difficulty. Include only tasks with historical pass rates between 30–70% in your primary evaluation set. Tasks that every agent passes or fails add noise, not signal.
- Run multiple seeds. A minimum of three seeds per configuration; five or more for publication-grade claims. Report mean and standard deviation, not just the mean.
- Capture full execution traces. Log every tool call, argument, return value, and intermediate state. Traces are your primary evidence for trajectory scoring and post-hoc debugging.
- Apply deterministic checks first. Use pytest assertions, exit codes, or DFA-based validators as your primary completion signal. These are your ground truth.
- Gate the LLM judge. Use an LLM judge only as a secondary advisory signal, capped in contribution weight, and only after deterministic checks pass or are inapplicable.
- Sample for human review. Pull a stratified sample of judge-contested cases and have at least two annotators adjudicate. Compute inter-rater agreement (Cohen's kappa or Krippendorff's alpha).
- Fingerprint your scaffold. Record framework name and version, all active plugins, routing configuration, model name and version, and system prompt hash.
- Report cost per task. Include token count, wall time, and dollar cost (at current API rates) as standard output metrics.
- Publish your artifacts. Seed list, container image or Dockerfile, task definitions, gold oracles or DFA specs, judge prompts, and run logs must accompany any published result.
Pro Tip: Build your "how we tested" block as a structured YAML manifest at the start of every experiment. Fields: framework, framework_version, plugins, model, model_version, prompt_hash, seeds, task_pool_version, run_date. Commit it alongside your results.
How to preserve ranking fidelity while cutting evaluation cost
Running a full benchmark sweep for every configuration is expensive. IRT-inspired filtering gives you a principled way to cut that cost without corrupting your rankings.
The core idea: mid-difficulty filtering
Item Response Theory, borrowed from psychometrics, treats tasks as items with measurable discriminative power. Tasks that every agent solves (pass rate > 70%) or no agent solves (pass rate < 30%) contribute almost no information about relative capability. Filtering to the 30–70% pass-rate band concentrates your evaluation budget on the tasks that actually separate good agents from great ones. The efficiency gain is substantial: a substantial reduction in required tasks without losing ranking fidelity.
A concrete subset-selection protocol
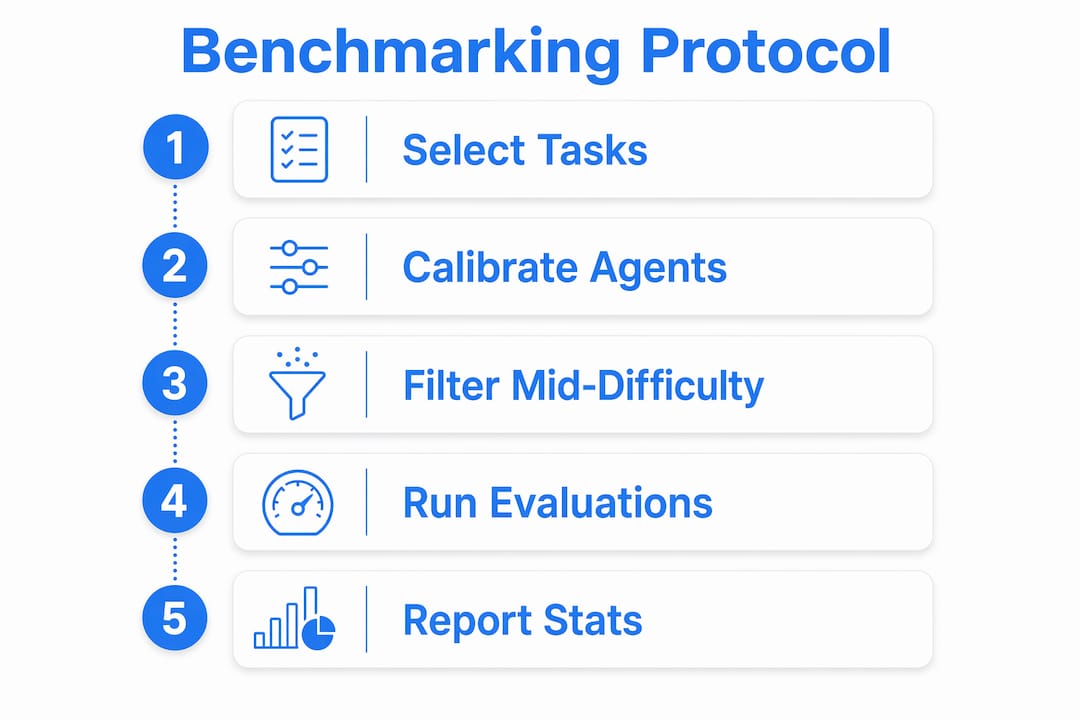
Start with a development pool of candidate tasks. Run a calibration sweep across a diverse set of reference agents to estimate per-task pass rates. Retain only tasks in the mid-difficulty band. Validate rank fidelity by comparing full-pool rankings against filtered-pool rankings on a held-out set of agent pairs. If Spearman rank correlation drops below 0.95, expand the band or add tasks.

| Filtering strategy | Tasks removed | Rank correlation | Notes |
|---|---|---|---|
| No filtering (baseline) | 0% | — | Full cost |
| Pass rate < 30% or > 70% removed | — | — | Conservative |
| Pass rate < 30% or > 70% removed | significant | — | Recommended |
| Aggressive (< 30% or > 70%) | > 70% | < 0.95 | Risk of rank inversion |
The tradeoff is real: aggressive filtering risks rank inversions on edge-case agent pairs. Use the 30–70% band as your default and validate before publishing filtered results as authoritative.
What to measure and how to report it
Metric definitions
A complete agent evaluation covers two layers: outcome metrics and process metrics. Outcome metrics tell you whether the agent succeeded; process metrics tell you how it got there and at what cost.
Outcome metrics:
- Task completion rate — binary or partial-credit success on the terminal state.
- Pass^k — probability of at least one success in k attempts; useful for stochastic tasks.
- Worst-of-n — minimum score across n runs; a reliability floor that penalizes high-variance agents.
Process metrics:
- Path Correctness — fraction of tool calls that match a reference or DFA-accepted path.
- Harmful-Call Rate — proportion of calls that are destructive, irreversible, or policy-violating.
- Step Efficiency — optimal steps divided by actual steps; values below 1.0 indicate unnecessary work.
- Tool-call accuracy (trace F1) — precision and recall of tool calls against a reference sequence.
- Cost per task — total tokens consumed and wall time, normalized per task.
Reliability metrics like pass^k and worst-of-n are especially important for agent performance assessment because they surface high-variance agents that look good on average but fail unpredictably in production.
Statistical reporting requirements
Single-point estimates are not enough. Every published result should include:
- Bootstrap confidence intervals (95% CI, at least 1,000 resamples) on all aggregate metrics.
- Variance decomposition: what fraction of score variance is seed noise vs. capability signal? ClawBench's finding that 47% of score variance is seed noise and 52.7% is genuine capability signal is a useful reference point for calibrating your own decomposition.
- Rank-difference significance tests: before claiming agent A outperforms agent B, test whether the rank difference exceeds bootstrap CI overlap.
- Per-task signal-to-noise ratio: tasks with SNR below a threshold (e.g., 1.0) should be flagged for removal or redesign.
| Metric category | Examples | What it tells you |
|---|---|---|
| Outcome (process-blind) | Completion rate, pass^k | Whether the agent succeeded |
| Process (trajectory-level) | Path Correctness, Harmful-Call Rate, Step Efficiency | How the agent succeeded or failed |
| Reliability | Worst-of-n, variance across seeds | How consistent the agent is |
| Cost | Tokens per task, wall time, dollar cost | Whether the agent is economically viable |
Pro Tip: Report bootstrap confidence intervals as a standard column in every results table. A result with overlapping CIs is not a statistically meaningful difference, regardless of how large the point-estimate gap looks.
Designing tasks and simulators for reliable evaluation
Task taxonomy and gold oracle design
Every task in your suite needs four documented components: a natural-language input, a set of expected state changes (what the environment should look like after a correct execution), a set of acceptable tool-call paths (or a DFA that accepts them), and a complexity tag (number of required steps, branching factor, domain).
Gold oracles should be deterministic wherever possible. For tasks with multiple valid solution paths, use a DFA that accepts all valid sequences rather than a single reference path. When no deterministic oracle is feasible, document the rubric explicitly and flag the task as requiring human or LLM adjudication.
- Define success criteria before you run any agent. Post-hoc oracle design introduces confirmation bias.
- Tag each task with its expected optimal step count. This is required to compute Step Efficiency.
- Include negative examples: tasks where the correct action is to decline or escalate, not to execute.
Simulator best practices
Deterministic simulators are non-negotiable for reproducible evaluation. External service calls must be mocked with fixed responses. File system and database state must be isolated per container run, with no shared state between tasks or seeds.
- Use per-container state directories (e.g.,
EVAL_STATE_DIR) to prevent cross-task contamination. - Seed all random number generators explicitly and log the seed in every run artifact.
- Record an environment fingerprint: OS image hash, dependency versions, mock service versions.
- Implement early-stop rules: if an agent exceeds a token or step budget, terminate and log a
BUDGET_EXCEEDEDfailure code rather than letting it run indefinitely.
| Simulator component | Requirement | Why it matters |
|---|---|---|
| External service mocks | Fixed, versioned responses | Eliminates non-determinism from live APIs |
| State isolation | Per-container directory | Prevents cross-task contamination |
| Seeded randomness | Logged seed per run | Enables exact replay |
| Budget enforcement | Token + step hard caps | Prevents token snowball failures |
| Environment fingerprint | OS + dependency hash | Ties results to a specific environment |
How to use LLM judges without letting them corrupt your results
LLM judges are useful. They are also unreliable enough that treating them as primary arbiters is a mistake. The right architecture keeps deterministic checks in authority and uses the LLM judge as a gated sidecar signal.
- Run deterministic checks first. Exit codes, pytest assertions, DFA acceptance, and database state diffs are your primary completion signal. If a deterministic check fails, the task is failed — no LLM override.
- Define a gating criterion for judge activation. Only invoke the LLM judge when the deterministic check is inconclusive (e.g., open-ended text generation, subjective quality assessment). Document this criterion explicitly.
- Cap judge contribution weight. If your final score blends deterministic and judge signals, the judge's weight should be bounded and reported. A reasonable default: judge contributes at most 20–30% of the composite score.
- Run calibration sweeps before deployment. Test your judge prompt on a labeled calibration set. Measure judge accuracy, false-positive rate, and sensitivity to prompt phrasing. Iterate until calibration accuracy exceeds your minimum threshold.
- Report judge confidence and disagreement rates. Log the judge's raw output, confidence score (if available), and whether it agreed with the deterministic check. High disagreement rates signal a broken oracle or a broken judge.
- Stratified human sampling for edge cases. Pull all cases where the judge and deterministic check disagree, plus a random 5–10% of judge-only decisions. Have two annotators score them independently. Compute Cohen's kappa; anything below 0.7 requires rubric revision.
- Document adjudication outcomes. Track how often human adjudication overrides the judge. A high override rate means your judge prompt needs redesign, not just recalibration.
For AI software validation workflows where stakes are high, consider a three-tier system: deterministic primary, LLM judge secondary, human adjudication tertiary — with explicit escalation criteria at each tier.
What to publish so others can reproduce your benchmark
Reproducibility in agent benchmarking is harder than in static NLP tasks because the environment is part of the result. A result without its scaffold is not reproducible — it's a claim.
Artifact checklist:
- Container image (Docker image hash or Dockerfile) pinning all dependencies.
- Commit hash of the agent codebase and evaluation harness.
- Task definition files (YAML or JSON) including input, oracle, DFA spec, and complexity tag.
- Gold oracle files or DFA transition tables.
- Judge prompt files (versioned, with hash).
- Seed list used for all runs.
- Configuration fingerprint: framework, plugins, routing, model, system prompt hash.
- Per-run logs and full execution traces.
- Scoring code with deterministic validator implementations.
- Results manifest: per-task SNR, per-task bootstrap CIs, failure-mode classification counts.
Recommended repository structure:
/eval
  /tasks          # Task YAMLs
  /oracles        # DFA specs and gold outputs
  /prompts        # Judge and system prompts (versioned)
  /seeds          # Seed list
  /results        # Per-run logs, traces, aggregate scores
  /scoring        # Deterministic validators and scoring code
  manifest.yaml   # Scaffold fingerprint + run metadata
  README.md       # "How we tested" template
Minimal "how we tested" template:
Framework: [name + version] | Model: [name + version] | Plugins: [list] | Seeds: [list] | Task pool: [version/hash] | Runs per config: [n] | Judge: [model + prompt hash] | Human sample rate: [%] | Evaluation date: [date]
The agent evaluations tag on Mlflow's blog has practical examples of this structure applied to production pipelines.
Budgeting compute, human, and time costs for your benchmark
Agent benchmarks are expensive. Knowing where the cost goes lets you make principled tradeoffs rather than running out of budget mid-experiment.
Cost template (per configuration):
- Token cost: (tasks × avg tokens per task × price per token) × seeds × configurations.
- Human annotation cost: (sampled tasks × annotation time × annotator rate). At 5% sampling and 5 minutes per task, a 200-task benchmark with 3 annotators runs roughly 5 hours of annotation per configuration sweep.
- Infrastructure: container orchestration, storage for traces and logs, CI compute.
- Engineering amortization: scaffold setup, fixture development, and harness maintenance — typically front-loaded but non-trivial.
Scenario comparison:
- Full sweep, single run: lowest token cost, highest noise, unreliable rankings. Not recommended for publication.
- Full sweep, 3 seeds: 3x token cost, substantially more reliable. Minimum for publication.
- IRT-filtered subset, 3 seeds: 44–70% fewer tasks × 3 seeds. Often cheaper than a full single-run sweep while producing more reliable rankings.
Cost controls worth implementing:
- Set hard token and step budgets per task. Terminate and log
BUDGET_EXCEEDEDrather than letting expensive failures run. - Use resource-constrained effectiveness scoring to surface agents that are accurate but economically infeasible.
- Run a fast single-seed pre-screen to eliminate clearly failing configurations before committing to full multi-seed runs.
- Cache deterministic mock responses so repeated runs don't re-incur infrastructure costs.
The agent failure modes documented by PlotStudio AI in data-analytics contexts illustrate how token snowball failures can dominate benchmark costs when budget enforcement is absent.
Running repeatable, auditable benchmarks with Mlflow
A practical evaluation pipeline has seven stages, and each one needs instrumentation to be auditable.
Pipeline sketch:
- Experiment definition — task YAMLs, scaffold manifest, seed list committed to version control.
- Containerized run — each seed × configuration pair runs in an isolated container with a logged environment fingerprint.
- Trace collection — every tool call, argument, return value, and intermediate state captured to a trace store.
- Deterministic verification — DFA validators and pytest assertions run against traces and terminal states.
- Judge + human sampling — LLM judge activates on inconclusive cases; stratified human sample pulled from disagreements.
- Artifact registry — all run artifacts (traces, logs, scores, prompts) stored with experiment ID and commit hash.
- Automated reports and dashboards — per-task SNR, bootstrap CIs, cost summaries, and failure-mode breakdowns rendered automatically.
Operational checklist:
- Instrument trace depth: capture sub-agent calls, tool routing decisions, and retry patterns, not just top-level calls.
- Fingerprint plugins at run time and log any version drift between runs.
- Set CI triggers so benchmark runs execute automatically on model or scaffold changes.
- Configure automated rejudging when judge prompts are updated, so historical results stay comparable.
- Expose metric dashboards with per-run bootstrap CIs so rank differences are visually distinguishable from noise.
Mlflow's AI observability features support deep agentic reasoning traces out of the box, and its LLM-as-a-judge integration implements the gated sidecar pattern described in the judge protocol above. The agent and LLM evaluation documentation covers human validation flows, artifact registry setup, and automated scoring pipelines.
Pro Tip: Use Mlflow's experiment tracking to store your scaffold manifest as a run tag, not just a log artifact. That way, every metric in your results table is queryable alongside its exact configuration context — no manual cross-referencing required.
Key Takeaways
Reliable agent benchmarking requires trace-based scoring, multi-seed statistical reporting, mid-difficulty task filtering, full scaffold documentation, and published artifacts — no single element is optional.
| Point | Details |
|---|---|
| Score traces, not just outcomes | Path Correctness, Harmful-Call Rate, and Step Efficiency expose failures that final-answer checks miss entirely. |
| Report uncertainty, not just means | Bootstrap 95% CIs and variance decomposition are required; 47% of run-score variance can be seed noise, not capability. |
| Filter to mid-difficulty tasks | The 30–70% pass-rate band cuts required tasks by 44–70% while preserving ranking fidelity. |
| Fingerprint your scaffold | Plugin configuration swaps can produce score swings 10x larger than model swaps; document everything. |
| Mlflow operationalizes the protocol | Mlflow's trace capture, LLM-as-a-judge integration, and artifact registry implement the full checklist in a single auditable pipeline. |
The field is solving the wrong problem first
The agent benchmarking community has made real progress on task diversity and benchmark breadth. What it has been slower to address is the measurement infrastructure underneath those tasks. We keep building bigger leaderboards on top of evaluation protocols that can't reliably distinguish a genuinely better agent from a luckier random seed or a more aggressive scaffold configuration.
The most underappreciated problem right now is scaffold opacity. When a team reports a new state-of-the-art result, the community has almost no way to determine how much of that gain came from the model versus the orchestration layer, the tool routing, or a carefully tuned system prompt. This isn't a minor methodological footnote — it's the difference between a scientific result and a marketing claim.
The directions that would actually move the field forward are specific: standardized scaffold reporting schemas (so every paper publishes the same fingerprint fields), public IRT-curated task pools with per-task SNR metadata, judge calibration benchmarks that let teams validate their LLM judge before deploying it, and trace visualization tooling that makes trajectory analysis accessible without custom engineering. None of these require new models. They require the community to agree that measurement quality is as important as model capability.
The rigor-versus-velocity tradeoff is real, and we don't think every internal experiment needs publication-grade statistical treatment. But the minimum bar — multiple seeds, bootstrap CIs, scaffold documentation, trace capture — is achievable with current tooling and should be the default, not the exception.
Mlflow gives you the infrastructure to benchmark agents correctly
The checklist in this article describes what trustworthy agent benchmarking looks like. Mlflow is built to operationalize exactly that checklist. Its deep agentic tracing captures every tool call, sub-agent invocation, and reasoning step in a queryable trace store. Its LLM-as-a-judge integration implements the gated sidecar pattern natively, with configurable judge weights and human review flows. The artifact registry ties every metric to its exact scaffold configuration, so rank comparisons are always apples-to-apples. If you're ready to move from ad-hoc evaluation scripts to a reproducible, auditable pipeline, the Mlflow GenAI platform is where to start.

Explore the AI observability and evaluation documentation to see how the full pipeline fits together, and check the how to evaluate agents resources for task template examples and deterministic validator patterns you can adapt to your own benchmark suite.
Primary sources and further reading
-
CORE: Full-Path Evaluation of LLM Agents Beyond Final State — Introduces Path Correctness, Harmful-Call Rate, and Efficiency metrics using DFA-based task modeling. Primary reference for trajectory-level metric definitions and oracle design (Sections: failure modes, task design, metrics).
-
ClawBench (openclaw/clawbench) — Documents seed noise (47% of variance), scaffold dependence (10x configuration effect), per-container state isolation, and the gated LLM judge pattern. Core evidence for failure modes, checklist, reproducibility, and judge protocol sections.
-
Efficient Benchmarking of AI Agents (arXiv:2603.23749) — The IRT and mid-difficulty filtering paper showing 44–70% task reduction with preserved ranking fidelity. Primary reference for the comparative analysis and cost sections.
-
SWE-Effi (arXiv:2509.09853) — Quantifies the token snowball problem: failed attempts consuming 4x+ the resources of successes. Use for failure modes and cost budgeting sections.
-
agent-eval-harness (GitHub) — A practical trajectory-aware harness measuring task success, tool-call accuracy (trace F1), step efficiency, and token cost. Reference implementation for the metrics and pipeline sections.
-
Demystifying evals for AI agents (Anthropic engineering) — Anthropic's engineering perspective on multi-step trajectory analysis and human-in-the-loop validation for stochastic tasks. Useful complement to the judge protocol and task design sections.
-
How to Evaluate AI Agents: Beyond Task Completion Rate (Pristren) — Practical guidance on deterministic validators, human rubrics, and test set sizing. Supports the checklist and reproducibility sections.
-
PlotStudio AI: Why AI Agents Fail at Data Analysis — Applied analysis of agent failure modes in data-analytics pipelines, with validation sampling approaches. Illustrative partner reference for failure modes and cost sections.
-
Stanford HAI: Benchmarking and Evaluation (Agent Ratings) — Stanford Digital Economy Lab's framework for agent ratings and evaluation methodology. Background reference for community standards discussion.