What Is Agent Observability? A 2026 Developer Guide

Agent observability is defined as the practice of capturing and analyzing structured telemetry across every step of an AI agent's reasoning and execution path, from initial prompt to final action. The industry term you'll encounter in production systems is "agentic telemetry," but agent observability has become the standard shorthand for the full discipline. It covers four core pillars: Monitoring, Tracing, Evaluation, and Governance. Tools like Honeycomb, LangSmith, and Arize Phoenix each implement these pillars differently, but the goal is identical: full transparency into what your agent did, why it did it, and where it went wrong.
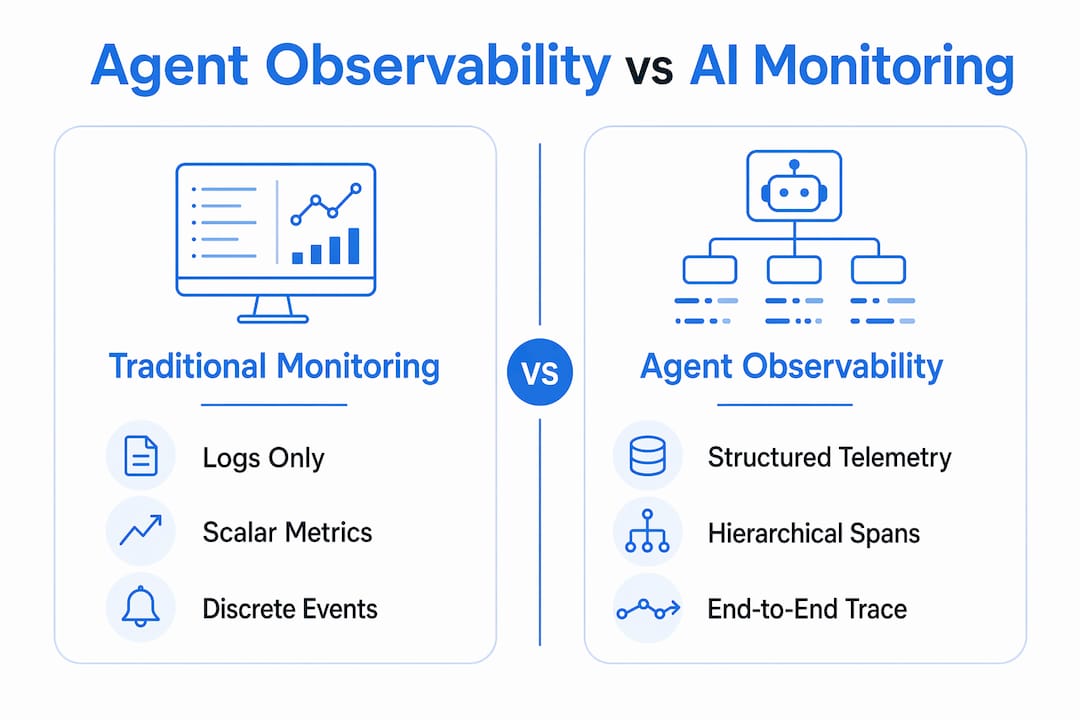
What is agent observability vs. traditional AI monitoring?
Agent observability captures end-to-end reasoning sequences, tool calls, memory operations, and agent-to-agent handoffs. Traditional AI monitoring focuses on system health metrics: CPU usage, request latency, error rates. That gap matters enormously when your agent fails.
Consider a multi-step research agent that retrieves documents, calls a summarization tool, and hands off to a writing sub-agent. A traditional monitoring setup tells you the pipeline returned a 500 error. Agent observability tells you the summarization tool received a malformed context window at step three, which caused the downstream sub-agent to hallucinate a citation. Those are completely different debugging experiences.

Traditional logs are ineffective for debugging probabilistic AI agents because logs capture discrete events, not causal chains. An agent's behavior is non-deterministic. The same prompt can produce different tool call sequences depending on model temperature, retrieved context, or prior memory state. You need structured trace data at high cardinality to filter across millions of operations by tool version, model version, or user segment.
The table below shows where the two approaches diverge in practice.
| Dimension | Traditional AI Monitoring | Agent Observability |
|---|---|---|
| Data format | Logs, scalar metrics | Hierarchical spans and traces |
| Scope | System health, latency, errors | Reasoning steps, tool calls, memory, handoffs |
| Cardinality | Low (aggregated metrics) | High (per-operation attributes) |
| Debugging use case | "The service is down" | "Step 4 of the agent chain produced a wrong tool output" |
| Feedback loop | Reactive alerting | Continuous evaluation and drift detection |
The practical implication: if you are running agents in production without span-level tracing, you are operating a black box. You can detect that something failed. You cannot reliably explain why.
How does agent observability work technically?
The core mechanism is span-per-tick tracing, where each discrete reasoning step in an agent's execution generates a distinct span within a distributed trace. Those spans nest hierarchically, so a parent trace for a full agent run contains child spans for each LLM call, tool invocation, memory read, memory write, and sub-agent handoff.
Here is what a well-instrumented agent trace captures at each tick:
- LLM call spans: input prompt tokens, output tokens, model ID, temperature, latency, and finish reason
- Tool invocation spans: tool name, input arguments, output payload, and execution duration
- Memory operation spans: read/write type, key, retrieved value, and cache hit or miss status
- Handoff spans: source agent ID, target agent ID, context payload size, and transfer latency
- Reasoning chain spans: intermediate thought text, decision branch taken, and confidence score if available
Semantic conventions matter here. The OpenTelemetry GenAI specification provides a shared schema for these attributes, which means traces from different frameworks can be ingested into the same backend without custom parsing logic. Mlflow's tracing layer aligns with these conventions, making cross-framework correlation tractable.
Structured attributes with business metadata such as user_id, session_id, and strategy_id on each span allow you to filter thousands of traces to isolate failure patterns that are invisible in single-trace inspection. Without those tags, you can replay one failing trace. With them, you can query "show me all traces where tool X failed for users in segment Y over the past 48 hours."
Two instrumentation approaches exist for collecting this data. In-process SDK instrumentation requires code changes but delivers full semantic context. System-level observability using eBPF-based monitoring observes closed-source agents and binaries without requiring any code modification, though it captures less semantic detail. The practical recommendation is to use SDK instrumentation for agents you own and eBPF for third-party or closed-source components in your stack.
Pro Tip: Tag every span with at least one business-level attribute from day one. Adding user_id or workflow_id retroactively after a production incident is painful. Instrument with context from the start.
What are the benefits of agent observability?
The most direct benefit is complete debug visibility across the full execution path, not just at failure points. When a coding agent produces an incorrect code suggestion, you can trace back through every tool call and LLM response to find the exact span where reasoning diverged. That capability alone reduces mean time to resolution significantly compared to log-only debugging.
Continuous evaluation via LLM-as-a-Judge frameworks coupled with agent observability enhances AI system trustworthiness in production. Instead of waiting for user complaints, you run automated judges against sampled traces to detect semantic drift, factual errors, or policy violations as they emerge. This shifts your team from reactive firefighting to proactive quality management.
Governance and compliance are increasingly non-negotiable for enterprise AI deployments. Governance-first observability integrates anomaly detection with kill switches and compliance export, allowing prompt mitigation of risky agent behavior alongside robust auditing trails. Regulated industries in finance and healthcare require exactly this kind of documented evidence that your agent behaved within policy boundaries.
Cost control is a concrete operational benefit that teams often underestimate. Token usage tracking at the span level lets you identify which agent steps are consuming disproportionate context windows. A single poorly scoped retrieval step can inflate costs by an order of magnitude across millions of runs. Observability makes that visible before it becomes a budget problem.
Pro Tip: Set up token budget alerts on your highest-traffic agent workflows before you scale. A retrieval agent that works fine at 1,000 runs per day can become expensive fast at 100,000 runs per day if context window usage is not monitored.
For multi-agent workflows specifically, hierarchical trace models allow you to pinpoint failure causes across complex agent operations where a root cause in one sub-agent propagates through several downstream steps. Without that hierarchical view, debugging a five-agent pipeline is guesswork.
What are the leading agent observability tools in 2026?
Leading agent observability tools in 2026 include Braintrust, LangSmith, Arize Phoenix, Helicone, Galileo, Datadog LLM Observability, and AgentOps. Each platform occupies a different position on the spectrum from telemetry collection to governance-first control.
| Tool | Primary Focus | Key Differentiator |
|---|---|---|
| LangSmith | Trace collection and evaluation | Deep LangChain integration, prompt versioning |
| Arize Phoenix | Model and agent monitoring | Drift detection, embedding visualization |
| Datadog LLM Observability | Enterprise APM integration | Unified infra and LLM metrics in one platform |
| AgentOps | Local-first, unattended agents | Privacy scrubbing, budget controls, trace replay |
| theaios-agent-monitor | Governance-first compliance | Kill switches, anomaly detection, compliance export |
| Helicone | Cost and latency tracking | Lightweight proxy, token cost analytics |
| Braintrust | Evaluation-centric workflows | LLM-as-a-Judge scoring, dataset management |
AgentOps provides local-first observability with passive hooks, privacy scrubbing, and live streaming for unattended AI agents. It enables real-time alerts and retrospective debugging without requiring changes to agent code. That makes it a strong choice for teams running agents in sandboxed or air-gapped environments.
For teams in regulated industries, theaios-agent-monitor's governance model is worth evaluating specifically. It supports auto policies and compliance report generation, which maps directly onto audit requirements in finance and healthcare.
Tool selection criteria for AI ops teams should prioritize three things: trace replay capability for debugging, structured export formats for compliance, and native support for the orchestration framework your agents run on. Mlflow's LLM tracing layer integrates with major frameworks including LangChain, LlamaIndex, and AutoGen, which reduces the instrumentation burden considerably.
Key takeaways
Agent observability requires structured, hierarchical telemetry across every reasoning step, tool call, and handoff to enable meaningful debugging, evaluation, and governance in production AI systems.
| Point | Details |
|---|---|
| Definition is precise | Agent observability captures full execution telemetry, not just system health metrics. |
| Spans are the core unit | Each reasoning tick generates a hierarchical span that enables trace replay and root cause analysis. |
| Business metadata is critical | Tagging spans with user and workflow IDs enables pattern detection across millions of traces. |
| Governance is built-in | Kill switches, anomaly detection, and compliance export are first-class observability features. |
| Tool selection matters | Match your platform to your orchestration framework and compliance requirements from day one. |
Why observability is now an engineering discipline, not a monitoring afterthought
I've watched teams treat observability as something you bolt on after launch. That approach consistently produces the same outcome: a production incident you cannot explain, a debugging session that takes days instead of hours, and a retrospective where everyone agrees you needed better instrumentation.
The shift I've seen work is treating observability as part of the agent's control harness from the first sprint. Observability should be an integrated extension of the agent's control harness, providing deep visibility into failure causes rather than just detecting failure states. That framing changes how you design your spans, what metadata you attach, and which evaluation checks you run continuously.
The LLM-as-a-Judge feedback loop is the piece most teams skip initially and regret later. Running automated quality judges against sampled production traces catches semantic drift weeks before it shows up in user complaints. Mlflow's evaluation framework makes this practical to implement without building custom scoring infrastructure.
The instrumentation overhead concern is real but overstated. In-process SDK tracing adds single-digit millisecond overhead per span in most frameworks. The visibility you gain far outweighs that cost. The teams I've seen resist instrumentation are usually the same teams spending two days debugging a production failure that a good trace would have resolved in twenty minutes.
My recommendation: start with span-per-tick tracing on your critical agent paths, add business metadata from day one, and wire up at least one automated evaluation check before you go to production. You can expand governance and anomaly detection incrementally. But the trace foundation needs to be there from the start.
— Kevin
See agent observability in action with Mlflow
Mlflow provides production-grade AI observability for agents covering deep tracing, automated LLM-as-a-Judge evaluation, and centralized governance across your full agent lifecycle. You get hierarchical span tracing that integrates natively with LangChain, LlamaIndex, and AutoGen, plus a structured evaluation layer that runs quality checks continuously against production traces.
Teams moving from prototype to production can use Mlflow's agent and LLM engineering platform to standardize telemetry collection, manage prompt versions, and enforce cross-provider governance through the AI Gateway. Whether you are debugging a multi-agent pipeline or building compliance audit trails, Mlflow gives you the instrumentation layer to do it without building custom tooling from scratch. Explore the platform at mlflow.org.
FAQ
What is agent observability in simple terms?
Agent observability is the practice of recording and analyzing every step an AI agent takes, from receiving a prompt to calling tools to producing a final output, using structured trace data rather than simple logs.
How does agent observability differ from standard logging?
Standard logging captures discrete events. Agent observability captures hierarchical, causally linked spans that represent the full reasoning chain, enabling trace replay and root cause analysis across non-deterministic workflows.
What metrics does agent observability track?
Core metrics include token usage per span, tool call latency, memory read and write operations, reasoning step count, model version, and output quality scores from automated evaluation judges.
What are the best practices for agent observability?
Instrument with span-per-tick tracing from day one, tag every span with business-level metadata like user_id and workflow_id, and run continuous LLM-as-a-Judge evaluation against sampled production traces to catch semantic drift early.
Which tools support agent observability in 2026?
Leading platforms include LangSmith, Arize Phoenix, Datadog LLM Observability, AgentOps, Helicone, Braintrust, and Mlflow. Each targets a different combination of telemetry collection, evaluation, and governance capabilities.