Instrumenting AI Calls in Backend Services: A Guide

Instrument every AI run as a single root trace with child spans for llm.generate/chat, retrieval, tool.call, retries, auth, and external API calls — and attach token counts plus cost attributes to every span. That one pattern gives you end-to-end visibility across your entire agent pipeline.
Minimal viable checklist:
- Wrap each AI invocation in a root span (
agent.runorinvoke_agent), then open child spans for every model call, tool execution, and retry. - Record
ai.input_tokens,ai.output_tokens,ai.cost_usd,ai.model, andai.provideron every LLM span. - Propagate W3C Trace Context (
traceparent/tracestate) and a stablerun.idacross every process, queue, and network boundary.
TL;DR: Required technologies: OpenTelemetry SDK (Python or JS), an OTLP Collector, and a backend such as Grafana Tempo, Honeycomb, or Datadog. Quick verification: after your first test run, confirm a trace exists with child spans, token counts are non-zero, and
run.idis consistent across all spans. If any span showsnulltokens or a missing parent, your wrapper has a gap.
Table of Contents
- Why should you instrument AI/LLM calls in backend services?
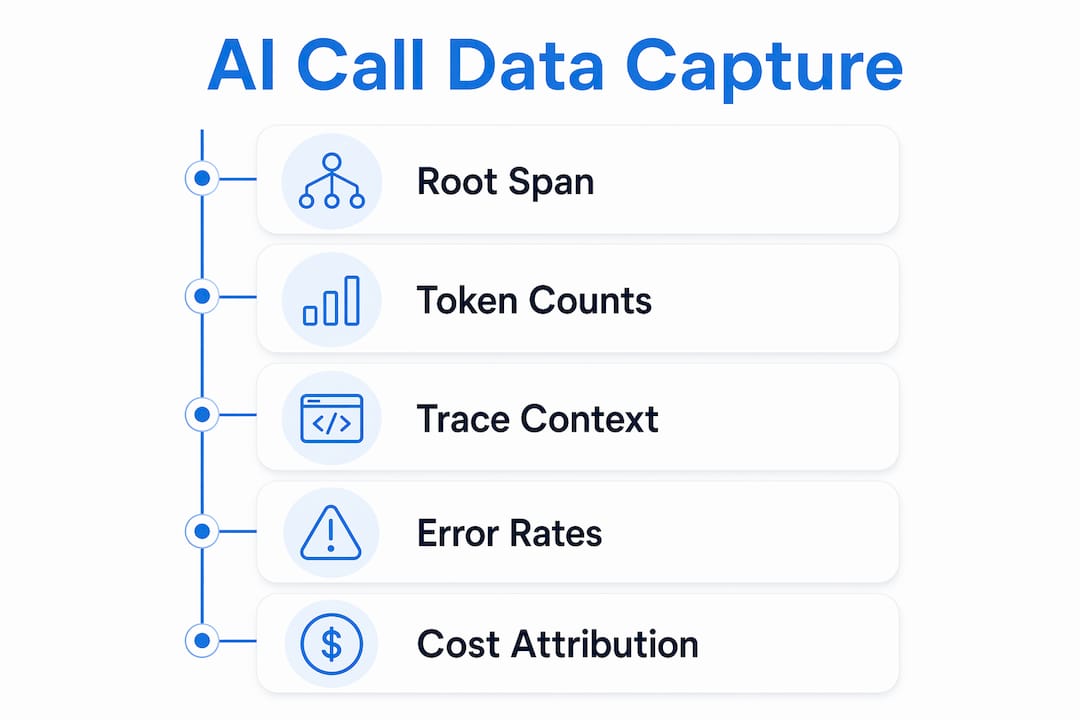
- What data should you capture for every AI call?
- How do you connect requests to agent runs and tool calls without orphan spans?
- What do practical instrumentation patterns look like in Python and TypeScript?
- How do you build the observability pipeline from collector to dashboard?
- What KPIs, dashboards, and alerts should you build for AI calls?
- What operational risks should you address before going live?
- How does Mlflow map to the recommended instrumentation pattern?
- Key Takeaways
- What teams actually learn when they ship agent observability
- Mlflow gives you production-grade agent observability from day one
- Authoritative sources and further reading
Why should you instrument AI/LLM calls in backend services?
Without instrumentation, an AI call is a black box. You see a 200 OK and a latency number, but you have no idea whether the model burned 40,000 tokens on a retry loop, whether a tool call silently failed, or whether your P99 latency spike came from DNS resolution or token generation. OpenTelemetry traces can break a single 14-second AI API call into phases — DNS, TLS, time-to-first-token (TTFT), and token generation — and reveal exactly where time is spent.
The four concrete goals instrumentation delivers:
Faster postmortems. When a user reports a wrong answer or a timeout, a trace with a run.id lets you replay the exact sequence of model calls, tool invocations, and retries that produced it. Without that, you're guessing.
Accurate cost attribution. Token counts on spans let you compute cost per run, cost per feature, and cost per tenant. Without token attributes, you cannot retrospectively assign cost to a trace — you only know your monthly bill, not which workflow drove it.
Spotting token waste and hallucinations. Failure clustering and per-tool quality grades surface patterns like a retrieval step that consistently returns low-quality context, pushing the model to hallucinate. Token explosion during retries is another common failure that only becomes visible when you track retry_count alongside token counts.
Alerting on model regressions. When a new model version ships, token-per-run trends and error rates tell you within hours whether quality or cost regressed — before users notice.
Each of these goals maps directly to data you need to collect: traces and spans for postmortems, token attributes for cost, structured logs for correctness, and metrics for alerting. The sections below specify exactly what to capture and how.
What data should you capture for every AI call?
The answer is more than just the model response. You need a span taxonomy that covers every step an agent takes, plus the attributes that make each span queryable.
Span taxonomy
| Event type | Minimum attributes | Why it matters |
|---|---|---|
agent.run / invoke_agent | run.id, agent.name, tenant.id, user.id (hashed) | Root span; anchors the whole trace |
llm.generate / chat | ai.model, ai.provider, ai.input_tokens, ai.output_tokens, ai.cost_usd, ai.ttft_ms, request.id | Cost and latency attribution |
retrieval | retrieval.query, retrieval.top_k, retrieval.latency_ms, cache.hit | Identifies low-quality context |
tool.call / execute_tool | tool.name, tool.type, tool.result_status, http.status_code | Surfaces integration failures |
retry | retry.count, retry.reason, ai.error.type | Detects token explosion loops |
auth | auth.provider, http.status_code, auth.latency_ms | Catches silent auth failures |
OpenTelemetry GenAI semantic conventions define spans like invoke_agent, chat, and execute_tool and specify model and token attributes — but they stop at the integration/tool boundary. You must add auth, retry, and outbound HTTP spans yourself.
Metrics and logs to emit
- Latency: P50/P95/P99 per step (model call, retrieval, tool execution)
- Error rates: per tool, per model, per
ai.error.type(rate limit, timeout, parse failure) - Token trends: input and output tokens per run, per feature, per tenant
- Cost:
ai.cost_usdper run and per successful task (compute from token counts × model price map) - Cache hit rate: for retrieval and prompt caching layers
- Structured logs: prompt and response text, linked to the trace via
trace_idandrun.id
Pro Tip: Make prompt and response capture opt-in at the SDK level. Set a CAPTURE_PROMPTS=false default and require an explicit environment flag to enable it. Raw prompts belong in a high-trust, access-controlled log store — never in a low-trust metrics export or a shared dashboard. Use hashed user IDs instead of raw identifiers in span attributes, and strip PII from tool results before recording them. See AI logging best practices for a structured approach to safe prompt capture.
How do you connect requests to agent runs and tool calls without orphan spans?
Always propagate W3C Trace Context (traceparent/tracestate) and a stable run.id across every hop. That single rule is what keeps one trace telling the whole run story instead of fragmenting into disconnected orphan spans.

Tracing without context propagation leads to orphan spans — a well-documented failure mode where tool call spans appear in your backend with no parent, making them useless for debugging. The fix is mechanical but must be applied at every boundary: HTTP headers, queue message headers, gRPC metadata, and async worker invocations.
How to propagate context across boundaries
Attach run.id and the W3C trace context to the root span when the request enters your backend. Pass both forward at every hop:
# Pseudo-code: server → agent module → worker → external tool call

# 1. Incoming HTTP request — extract W3C context
ctx = otel.propagate.extract(request.headers)
with tracer.start_as_current_span("agent.run", context=ctx) as root:
    root.set_attribute("run.id", run_id)
    root.set_attribute("agent.name", "my-agent")
    root.set_attribute("tenant.id", tenant_id)

    # 2. Enqueue async work — inject context into queue message headers
    headers = {}
    otel.propagate.inject(headers)
    headers["x-run-id"] = run_id
    queue.send(payload, headers=headers)

# 3. Worker — extract context from queue message headers
ctx = otel.propagate.extract(message.headers)
run_id = message.headers["x-run-id"]
with tracer.start_as_current_span("tool.call", context=ctx) as span:
    span.set_attribute("run.id", run_id)
    span.set_attribute("tool.name", "web_search")
    # ... execute tool, record result
In multi-agent orchestrations, the calling agent emits the primary invocation span and called agents emit child spans with unique agent.name attributes. This prevents trace fragmentation and preserves coherent timelines across sub-agent boundaries.
Pro Tip: To detect orphan spans, query your tracing backend for spans where parent_span_id is null but span.kind is not SERVER. Any result is a propagation gap. Remediation checklist: (1) verify traceparent is injected into outbound HTTP headers, (2) confirm queue consumers extract headers before opening spans, (3) check that gRPC interceptors pass metadata, and (4) validate that worker span parent_id matches the enqueuing span's span_id.
What do practical instrumentation patterns look like in Python and TypeScript?
Use a small, testable wrapper that opens a root span and emits child spans for the request, streaming phases, retries, and tool calls. Keep domain attributes consistent across all wrappers so your dashboards can query them uniformly.
Passive instrumentation libraries that patch HTTP clients can emit token usage and protocol-level visibility without code changes — useful for fast adoption. For production, an explicit wrapper gives you more control over attribute naming and sampling.

Python: OpenTelemetry SDK skeleton
from opentelemetry import trace
from opentelemetry.sdk.trace import TracerProvider
from opentelemetry.sdk.trace.export import BatchSpanProcessor
from opentelemetry.exporter.otlp.proto.grpc.trace_exporter import OTLPSpanExporter
import time

# Init
provider = TracerProvider()
provider.add_span_processor(BatchSpanProcessor(OTLPSpanExporter()))
trace.set_tracer_provider(provider)
tracer = trace.get_tracer("ai-backend")

def traced_llm_call(prompt: str, model: str, run_id: str):
    with tracer.start_as_current_span("llm.generate") as span:
        span.set_attribute("ai.model", model)
        span.set_attribute("ai.provider", "openai")
        span.set_attribute("run.id", run_id)

        # Non-streaming call
        t0 = time.time()
        response = llm_client.chat(prompt=prompt, model=model)
        span.set_attribute("ai.input_tokens", response.usage.prompt_tokens)
        span.set_attribute("ai.output_tokens", response.usage.completion_tokens)
        span.set_attribute("ai.cost_usd", compute_cost(model, response.usage))
        span.set_attribute("ai.latency_ms", (time.time() - t0) * 1000)
        return response

def traced_streaming_call(prompt: str, model: str, run_id: str):
    with tracer.start_as_current_span("llm.generate") as span:
        span.set_attribute("ai.model", model)
        span.set_attribute("run.id", run_id)
        t0 = time.time()
        ttft_recorded = False
        tokens = 0

        for chunk in llm_client.stream(prompt=prompt, model=model):
            if not ttft_recorded:
                # Streaming: treat TTFT and token generation as distinct phases
                span.set_attribute("ai.ttft_ms", (time.time() - t0) * 1000)
                ttft_recorded = True
            tokens += chunk.token_count
            yield chunk

        span.set_attribute("ai.output_tokens", tokens)
        span.set_attribute("ai.cost_usd", compute_cost(model, tokens))
Treating streaming as two phases — TTFT and token generation — is critical. Insiders track TTFT and token generation as distinct spans to avoid masking slow generation behind an initially fast response.
TypeScript/Node.js: OpenTelemetry JS SDK
import { trace, context, propagation } from "@opentelemetry/api";
import { NodeTracerProvider } from "@opentelemetry/sdk-trace-node";
import { OTLPTraceExporter } from "@opentelemetry/exporter-trace-otlp-grpc";
import { BatchSpanProcessor } from "@opentelemetry/sdk-trace-base";

const provider = new NodeTracerProvider();
provider.addSpanProcessor(new BatchSpanProcessor(new OTLPTraceExporter()));
provider.register();
const tracer = trace.getTracer("ai-backend");

async function tracedLLMCall(prompt: string, model: string, runId: string) {
  return tracer.startActiveSpan("llm.generate", async (span) => {
    span.setAttribute("ai.model", model);
    span.setAttribute("ai.provider", "anthropic");
    span.setAttribute("run.id", runId);

    const t0 = Date.now();
    let ttftRecorded = false;
    let outputTokens = 0;

    const stream = await llmClient.stream({ prompt, model });
    for await (const chunk of stream) {
      if (!ttftRecorded) {
        span.setAttribute("ai.ttft_ms", Date.now() - t0);
        ttftRecorded = true;
      }
      outputTokens += chunk.tokenCount ?? 0;
    }

    span.setAttribute("ai.output_tokens", outputTokens);
    span.setAttribute("ai.latency_ms", Date.now() - t0);
    span.end();
  });
}
Recommended span attribute names
ai.model,ai.provider,ai.input_tokens,ai.output_tokens,ai.cost_usd,ai.ttft_mstool.name,tool.type,tool.result_statusretry.count,ai.error.typerun.id,agent.name,tenant.id
For existing HTTP clients or SDKs, wrap the client call, intercept response or stream events, and emit token counts after the response completes. Explore how developers trace AI for additional patterns and troubleshooting guidance.
How do you build the observability pipeline from collector to dashboard?
Use an OpenTelemetry Collector (OTel Collector) to receive OTLP, apply sampling and transformations, and route to one or more backends. That single collector gives you a clean separation between instrumentation and storage, so you can swap backends without touching service code.
Transform processors can remap vendor-specific telemetry into GenAI semantic conventions, making agent timelines usable even when your LLM SDK emits non-standard attribute names.
Pipeline checklist
- OTLP receiver: accept traces and metrics from all instrumented services over gRPC or HTTP
- Batch processor: buffer spans before export to reduce network overhead
- Sampling processor: apply tail-based sampling to preserve tail failures while reducing volume
- Transform processor: remap vendor attributes to GenAI semconv (
ai.model,ai.input_tokens, etc.) - Exporters: route to your chosen backends via OTLP/gRPC
Backend trade-offs
Grafana Tempo works well for trace storage when you already run a Grafana stack. Pair it with Prometheus for metrics and you get a cost-effective open-source pipeline. Queries are TraceQL-based and well-suited to latency analysis.
Honeycomb excels at high-cardinality event analytics. Its agent timeline view and BubbleUp feature make it fast to find which combination of ai.model + tool.name + tenant.id is driving cost spikes. Honeycomb's remapping processors let you normalize existing telemetry to GenAI conventions without re-instrumenting services.
Datadog gives you integrated APM, metrics, logs, and alerting in one platform. The trade-off is cost at scale, but the correlation between traces, logs, and infrastructure metrics is hard to match with a DIY stack.
ClickHouse or Tinybird are the right choice when you need high-cardinality analytics at low cost — for example, computing cost-per-run aggregated by tenant, model, and feature over 90 days. Neither is a tracing backend, but as an analytics store fed by your collector, they handle token trend queries that would be expensive in a pure APM tool.
For cost-aware analytics, a common pattern is to export traces to both a tracing backend (Honeycomb or Tempo) and an analytics store (ClickHouse), using the collector's fan-out exporter. The tracing backend handles debugging; the analytics store handles billing and trend analysis. Platforms like AETHER Pulse address high-cardinality event analytics and alerting patterns specifically for AI call workloads, which can complement your collector pipeline.
What KPIs, dashboards, and alerts should you build for AI calls?
Prioritize P99 latency, TTFT, error rate by tool and model, tokens per run, cost per successful task, and retry/error tax. Those six metrics cover the failure modes that actually matter in production.
Dashboard panels to build
- Overall health: request rate, error rate, P50/P95/P99 latency (by model and tool)
- Cost trends:
ai.cost_usdper run over time, broken down by tenant, feature, and model - Slowest steps: a ranked list of spans by P99 latency, filterable by
agent.nameandrun.id - Top-erroring tools: error rate per
tool.name, withai.error.typebreakdown (rate limit, timeout, parse failure) - Token trends: input and output tokens per run, week-over-week delta to catch prompt bloat
- Sample traces: a panel linking directly to traces associated with recent incidents, filterable by
run.id
Use AI trace analysis techniques to surface root-cause signals from trace data and build queries that connect cost spikes to specific agent runs.
Alert escalation checklist
- Threshold breach: P99
llm.generatelatency exceeds your SLO, or tokens-per-run increases more than 30% week-over-week, orai.error.type=rate_limitspikes above baseline. - Context capture: attach
trace_idandrun.idto the alert payload so on-call engineers can jump directly to the offending trace. - Automated action: trigger throttling or model fallback (e.g., switch to a smaller model) when cost-per-run exceeds a budget threshold.
- Escalation: page the on-call engineer if automated action fails to bring the metric back within bounds within five minutes.
- Postmortem link: after resolution, attach the trace and alert timeline to the incident record for future reference.
For production workflow analysis, build queries that correlate cost spikes with specific agent.name and tenant.id combinations — that's usually where runaway spend hides.
What operational risks should you address before going live?
The two biggest risks are prompt leakage and uncontrolled cardinality. Both are fixable before launch, but both are easy to miss when you're focused on getting traces to appear.
Privacy checklist
- Make prompt and response capture opt-in (default off in all environments)
- Mask PII in tool results before recording them as span attributes
- Keep raw prompts in a separate, access-controlled log store — never in your shared metrics pipeline
- Use hashed user IDs (
user.id_hash) instead of raw identifiers in span attributes - Apply redaction at the collector level as a backstop, not as the primary control
Sampling and cardinality
Tail-based sampling is the right strategy for AI workloads: sample 100% of error traces and slow traces (above P95 threshold), and sample a fraction of successful fast traces. This preserves visibility into tail failures without overwhelming your storage backend.
High-cardinality attributes like prompt.text or response.text should never be span attributes — they belong in structured logs linked to the trace via trace_id. Use tool.name and ai.model as span attributes (bounded cardinality), not free-text fields. For AI debugging practices, structured logs linked to traces give you the full context without blowing up your metrics cardinality.
Common pre-launch mistakes
- Missing
traceparentinjection in outbound HTTP headers from tool calls - Not recording
ai.input_tokensandai.output_tokens(makes cost attribution impossible) - Recording raw prompts by default in all environments (a data leak waiting to happen)
- Using
user.emailoruser.nameas span attributes instead of hashed IDs - Setting
ai.modelto a free-text field that includes version suffixes, creating unbounded cardinality
Pro Tip: Run this verification checklist during integration testing: (1) confirm a trace exists with a root agent.run span and at least one llm.generate child span, (2) check that ai.input_tokens and ai.output_tokens are non-zero on every LLM span, (3) verify run.id is identical across all spans in the trace, (4) confirm no raw prompt text appears in span attributes, and (5) validate that async worker spans have a non-null parent_span_id.
How does Mlflow map to the recommended instrumentation pattern?
Mlflow can serve as a centralized element of a production observability and evaluation stack by integrating run metadata, deep agent tracing, and evaluation pipelines for LLMs and agents. It maps directly to the patterns described above, covering trace root management, token accounting, cost attribution, and prompt governance in one platform.
Mlflow feature mapping
| Pattern area | How Mlflow addresses it | Implementation tip |
|---|---|---|
| Trace root and agent spans | Native agent tracing with invoke_agent, llm.generate, and tool.call span support | Use Mlflow's tracing SDK to auto-instrument supported frameworks; add manual spans for custom tools |
| Token accounting | Automatic token count capture on LLM spans; exportable to downstream analytics | Enable token logging in the Mlflow tracing config; verify counts appear in the UI after first run |
| Cost attribution | Per-run cost computation from token counts and model price maps | Configure a model price map in Mlflow's AI Gateway; cost appears as a run attribute |
| Prompt governance | Centralized AI Gateway for prompt versioning, access control, and cross-provider routing | Route all LLM calls through the Mlflow AI Gateway to enforce prompt policies and capture versions |
| Evaluation | LLM-as-a-Judge evaluation hooks for automated correctness scoring | Attach evaluation runs to traced agent runs; use LLM-as-a-Judge evaluation for regression detection |
Mlflow's AI Gateway handles cross-provider governance, so you can switch between OpenAI, Anthropic, and other providers without changing instrumentation code. The AI observability feature page covers tracing and evaluation integrations with quickstart examples. For teams integrating inspection and evaluation tooling, the Inspect AI and Mlflow integration shows a concrete example of combining tracing with automated safety evaluations.
Enterprise teams can access support contracts and bespoke integration guidance through Mlflow's enterprise offering. The GenAI and agent engineering page is the primary starting point for agent tracing, AI Gateway setup, and evaluation pipeline docs.
Key Takeaways
Instrumenting AI calls correctly requires a root span per run, token counts on every LLM span, W3C Trace Context propagation across all boundaries, and a cost-aware analytics pipeline feeding actionable dashboards and alerts.
| Point | Details |
|---|---|
| Root span per run | Open one agent.run span per invocation; all model, tool, and retry spans must be children of it. |
| Token counts are non-negotiable | Record ai.input_tokens and ai.output_tokens on every LLM span — without them, cost attribution is impossible. |
| W3C Trace Context everywhere | Inject traceparent into HTTP headers, queue messages, and gRPC metadata to prevent orphan spans. |
| Prompt capture is opt-in | Default prompt logging to off; enable it only in controlled environments with access-controlled storage. |
| Mlflow accelerates rollout | Mlflow's agent tracing, AI Gateway, and LLM-as-a-Judge evaluation map directly to the recommended pattern and reduce setup time. |
What teams actually learn when they ship agent observability
The conventional wisdom in AI observability is "add tracing and you'll see everything." That's only half right. What most teams discover after their first production rollout is that the traces exist, but the useful signal is buried — because they stopped at the LLM call boundary.
The most common failure we see is a team that instruments llm.generate perfectly but leaves tool.call and the integration layer as black boxes. In practice, most production agent failures happen in the integration layer: an auth token expires silently, a third-party API returns a 429 that triggers a retry loop, or a retrieval step returns empty results that the model then hallucinates over. None of that is visible if your spans stop at the model boundary.
Three lessons that hold across every production rollout:
Start small, but start complete. A single traced endpoint with full token counts and context propagation teaches you more than ten endpoints with partial instrumentation. Get one agent run fully traced before expanding coverage.
Make token billing visible to the whole team, not just ops. When engineers can see cost-per-run in a dashboard during development, they self-correct prompt bloat before it reaches production. That behavioral shift is worth more than any alert rule.
Protect prompts from day one. Retrofitting prompt redaction after a data incident is painful. Build the opt-in flag and the access-controlled log store before you enable prompt capture anywhere.
Phased rollout checklist:
- Dev: instrument one agent, verify trace exists with tokens and
run.id, confirm no raw prompts in span attributes - Staging: enable tail-based sampling, validate context propagation across async boundaries, build cost dashboard
- Canary: run 5–10% of production traffic, compare token trends and error rates against baseline
- Production: enable full rollout, activate alerting rules, link alerts to trace IDs in incident tooling
Mlflow gives you production-grade agent observability from day one
Shipping the instrumentation pattern described in this guide from scratch takes weeks. Mlflow compresses that to hours by providing native agent tracing, a centralized AI Gateway for prompt governance, and LLM-as-a-Judge evaluation pipelines — all integrated into one open-source platform.

Where most teams spend their first sprint wiring together an OTel SDK, a collector, and a cost-attribution script, Mlflow handles that plumbing out of the box. You get deep tracing of agentic reasoning, automatic token count capture, and cross-provider governance through the AI Gateway — without building custom middleware. The AI observability platform page walks you through the quickstart, and the GenAI and agent engineering page covers agent tracing setup, evaluation hooks, and Gateway configuration. Start with the quickstart, get your first traced agent run in under an hour, and build from there.
Authoritative sources and further reading
The resources below cover the standards, SDK details, and practical examples referenced throughout this guide.
- OpenTelemetry GenAI Semantic Conventions — Covers
invoke_agent,chat,execute_toolspan definitions and model/token attributes; explains the integration-layer gap teams must fill manually. - Add OpenTelemetry Tracing to AI API Calls (EzAI Blog) — Practical walkthrough showing how tracing breaks a 14-second AI call into DNS, TLS, TTFT, and token generation phases; includes streaming instrumentation patterns.
- Instrumenting AI Agents (Honeycomb Docs) — Covers agent timeline views, remapping processors for GenAI semconv, and multi-agent trace coherence.
- OpenTelemetry for AI Agents: 8 Tracing Rules — Minimum attribute requirements for cost-aware tracing; explains why token counts are required for retrospective cost attribution.
- anjor-labs/anjor (GitHub) — Passive instrumentation library that patches HTTP clients to emit token usage, schema drift detection, and per-tool quality grades without code changes.
- NikhilBhutani/Go_AI_Backend (GitHub) — Domain-agnostic Go backend framework with LLM Gateway, audit logging, cost aggregation, and multi-agent orchestration; useful reference for backend AI integration architecture.
- Watchtower (fahd09/watchtower, GitHub) — Proxy-based tool for monitoring all API traffic between AI coding agents and their APIs; captures token counts, SSE stream events, agent hierarchy, and rate limits in a real-time dashboard.
- Microsoft Learn: Integrate Backend Services with AI Solutions — Learning path covering Azure Service Bus, Event Grid, and Azure Functions for building event-driven AI backends; relevant for async instrumentation patterns.
- Mlflow AI Observability — Mlflow's feature page for tracing and evaluation integrations; includes quickstart examples for agent tracing and AI Gateway setup.
- Mlflow GenAI and Agent Engineering — Primary docs for agent tracing, AI Gateway configuration, and LLM-as-a-Judge evaluation pipelines.