Fix LLM Trace Context Propagation With MLflow: Queue Fix Under an Hour

Use W3C Trace Context (traceparent and tracestate) as your identity format, and treat every async, queue, or LLM boundary as a place where context propagation can silently fail. The fix is almost always the same: capture the active context before the boundary, serialize it into the carrier (HTTP headers, message metadata, or a task payload), and extract it on the other side before starting a new span. Get that pattern right and your orchestrator, LLM calls, and tool invocations connect into one traceable chain instead of scattering into disconnected fragments.
TL;DR:
- Queues and background workers require explicit serialization of trace context, as they strip headers unless manually injected into message metadata.
- Injecting context into every outbound LLM API call and extracting it on response ensures span continuity and prevents orphaned traces.
- Using W3C Trace Context, baggage, and OpenTelemetry propagators in the correct configuration allows reliable propagation across diverse service boundaries.
- Implementing context attach/detach patterns in async tasks and background work prevents leaking trace context between unrelated operations.
- Fixing propagation in a single queue or API call typically reduces orphaned spans significantly, with a quick fix often taking less than an hour.
Table of Contents
- What Trace Context Propagation Actually Means for LLM Systems
- Why LLM and Agent Boundaries Break Propagation
- The Standards Your Propagators Should Be Built On
- Implementation Recipes That Actually Hold Up in Production
- How to Spot Orphaned Spans Before They Waste Your On-Call Time
- Keeping Baggage and Trace Data Safe in Production
- Where MLflow Fits Into an Orchestrator-Aware Tracing Setup
- A Rollout Plan That Doesn't Require a Big-Bang Rewrite
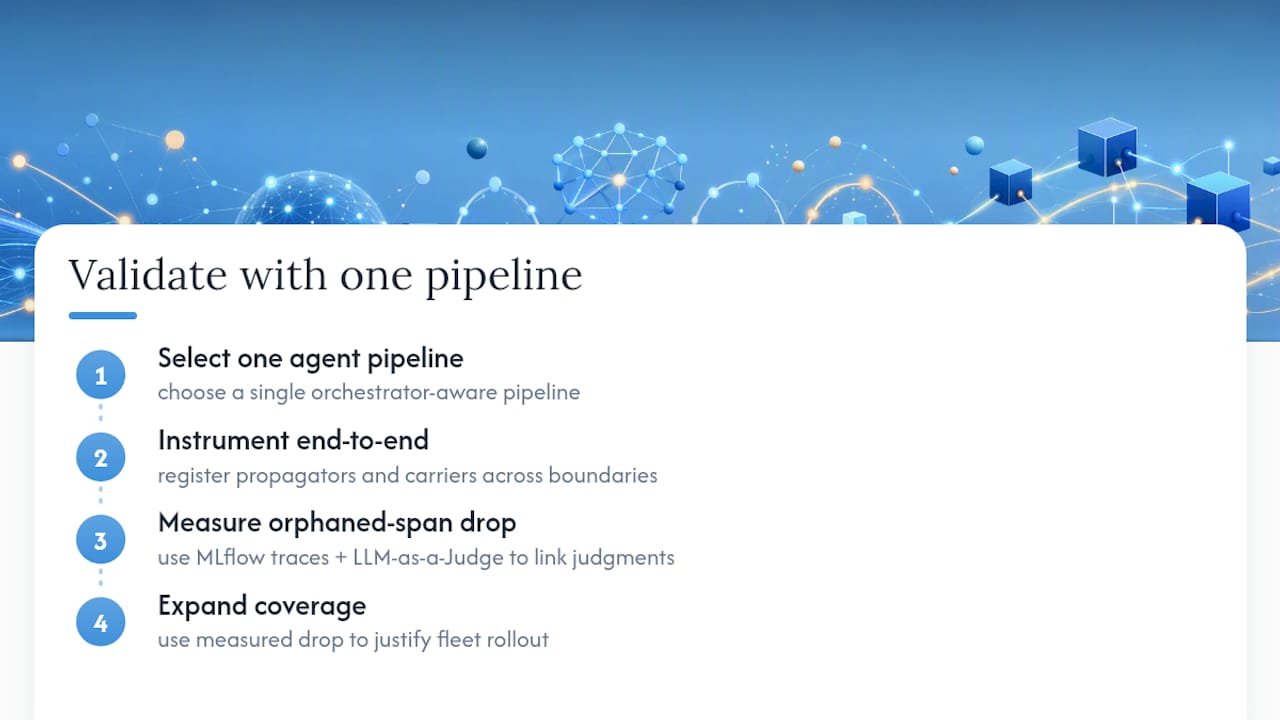
- Instrumenting One Pipeline End to End Is the Fastest Way to Prove This Works
- What Most Teams Get Wrong About Propagation
- Sources
What Trace Context Propagation Actually Means for LLM Systems
Trace context is the small bundle of identifiers that travels with a request as it hops between services: a trace ID, a span ID, and a sampling flag. Propagators are the code that serializes that bundle into a carrier (usually HTTP headers) on the way out and deserializes it back into a usable context object on the way in. Get this exchange wrong once in an agent pipeline, and every downstream span becomes orphaned.
Three pieces matter most for LLM traceability:
- traceparent: carries the trace ID, parent span ID, and sampling flag in a fixed, interoperable format defined by the W3C Trace Context specification.
- tracestate: vendor-specific extension data that rides alongside traceparent without breaking interoperability.
- baggage: arbitrary key-value pairs (like a session ID or user tier) that travel with the trace but are not the trace identity itself, and should never carry secrets.
OpenTelemetry formalizes this exchange as context propagation: the act of moving trace and baggage data between services using W3C Trace Context by default. That standardization is exactly why it works across a Python orchestrator calling a Node.js LLM proxy calling a Java vector database, without anyone writing custom glue code.
Why LLM and Agent Boundaries Break Propagation
HTTP-to-HTTP tracing is a solved problem. Agent systems break it in new, specific ways, because the transport isn't always HTTP and the reasoning isn't always visible to your instrumentation.
Message queues have no equivalent of an HTTP header by default. When your orchestrator drops a job onto a queue for a background worker to process, the trace context does not automatically travel with it, because queues are transport-agnostic and were never designed with distributed tracing in mind. Unless you explicitly serialize traceparent into the message metadata, the consumer starts a brand-new, disconnected trace.
Orchestrator-to-worker and agent-to-tool handoffs create the same gap. A planning agent that spins up a tool-calling sub-agent, or a workflow engine that hands a task to a worker pool, needs the same explicit capture-and-carry discipline. One technical analysis of agent service boundaries points out that W3C Trace Context handles single HTTP hops well but fails at queues, MCP servers, and opaque agent internals unless engineers add explicit extraction and injection.
Opaque agent frameworks compound the problem. Many agent libraries wrap LLM calls, tool calls, and retries inside a single black-box method. Auto-instrumentation sees the outer call and misses everything happening inside it, meaning your trace shows one long span with no visibility into which tool call actually caused the latency spike.
Concurrent branches add a final wrinkle. When two parallel sub-agents rejoin into a single response, their baggage needs to merge cleanly. Academic work on baggage propagation across concurrent branches recommends that merge operations be idempotent, commutative, and associative, so two joins in any order produce the same result.
- Queues and background workers strip headers unless you serialize context manually.
- Orchestrator-to-tool handoffs are the most common source of orphaned spans in agent pipelines.
- Black-box agent frameworks hide internal LLM and tool calls from automatic instrumentation.
- Fan-out/fan-in patterns require careful, deterministic baggage merging.
Pro Tip: If you only fix one thing this week, fix the queue carrier. It's the single highest-frequency source of orphaned spans in agentic systems, and the fix (adding a trace context field to your message schema) usually takes under an hour.
The Standards Your Propagators Should Be Built On
Three standards do almost all the heavy lifting for reliable context propagation. Treat them in this order:
- W3C Trace Context handles trace identity. The traceparent header is what lets a span in your LLM proxy know it belongs to the same trace as the span in your orchestrator, and tracestate carries any vendor-specific extensions without breaking that link.
- W3C Baggage carries correlation metadata, like a run ID or a customer tier, that you want visible at every hop. Keep it small. It is not encrypted, not access-controlled by default, and not meant for anything sensitive.
- OpenTelemetry propagators do the actual serialization work. Registering a global text-map propagator once, at application startup, means every instrumented HTTP client and server in your stack automatically injects and extracts headers without per-call boilerplate.
Where you configure that propagator depends on your language SDK. Python sets it through set_global_textmap(), Node.js configures it in the SDK's TracerProvider setup, and Java typically wires it through the agent's autoconfiguration properties. The registration call is nearly identical in spirit across languages: pick a composite propagator that includes TraceContextTextMapPropagator and W3CBaggagePropagator, and register it before any client makes its first outbound call.
Implementation Recipes That Actually Hold Up in Production
Standards explain the theory. Here's what actually needs to change in your code.
HTTP calls to LLM providers. Every outbound call to an LLM API, whether it's a direct provider SDK or a proxy layer, needs the active context injected into its headers. If you've registered a global propagator, most instrumented HTTP clients (requests, httpx, fetch with auto-instrumentation) handle this for you. If you're calling an LLM SDK that wraps its own HTTP client without hooking into OpenTelemetry, you need to inject manually before the call and extract on any callback.
Message queues. Queues need trace context stored as message metadata, not assumed. On publish, inject the current context into a trace_context field on the message envelope. On consume, extract it before you start your first span in the worker, so that span attaches as a child of the original request instead of starting a new root.
Background tasks and async work. This is where most teams get tripped up. The fix is a consistent attach-and-detach pattern:
from opentelemetry import context

ctx = context.get_current()

def run_background_task(ctx):
    token = context.attach(ctx)
    try:
        # do work; spans created here attach to the passed context
        pass
    finally:
        context.detach(token)
Capture the context before the task is scheduled, attach it inside the task, and always detach in a finally block so you never leak context between unrelated tasks running on a shared thread pool.
Language-specific notes. Python's contextvars module underlies OpenTelemetry's context implementation, and the OpenTelemetry Python propagation docs show working examples of TraceContextTextMapPropagator for both injection and extraction. JavaScript's async_hooks can lose context across certain event-loop boundaries, particularly with older callback-style code, so test propagation explicitly rather than assuming it. JVM reactive stacks need their own context bridge; MicroProfile's context propagation spec documents how managed executors snapshot and restore thread-local state, and guarantees vary by runtime.
Testing. Write unit tests that assert the traceparent header exists on every outbound call your service makes. Then write integration tests that assert the actual parent-child span relationship: fetch the finished trace and check that the LLM call's span lists the orchestrator's span as its parent, not as a sibling root.
- Inject on every outbound LLM call, queue publish, and task dispatch.
- Extract before starting any new span on the receiving side.
- Always pair
context.attach()with afinally: context.detach(). - Test header presence AND parent-child span relationships, not just header presence alone.
Pro Tip: A real-world fix documented in a production postmortem came down to exactly two changes: registering a global W3C propagator, and sourcing the context from opentelemetry::Context::current() right before injecting headers into an agent-to-proxy call. Both changes together resolved a chronic orphaned-span problem in under twenty lines of code.
How to Spot Orphaned Spans Before They Waste Your On-Call Time
Orphaned spans hide in plain sight until you know what to search for.
- Search for root spans mid-trace. If a tool-call span shows
parent_span_id: nullbut you know it was triggered by an orchestrator, that's a broken carrier, not a code bug in the tool itself. - Correlate logs with trace IDs. Log the active
trace_idandspan_idat every orchestrator decision point. If a log line has no trace ID, whatever call produced it lost context somewhere upstream. - Query for broken parent-child links. Most tracing backends let you query for spans where the parent ID doesn't resolve to any span in the same trace. Run that query weekly, not just when someone complains about a confusing trace.
- Sanity-check your sampling flag. A trace that looks complete in one view and truncated in another is often a sampling mismatch between services, not a propagation bug at all.
- Add propagation assertions to CI. A regression test that fails when a new queue consumer forgets to extract context catches the problem before it ships, not after a postmortem.
One useful mental model: agent tracing generally needs the orchestrator to manage span lifecycle explicitly, starting the parent span before the first LLM call and only closing it after the final tool response is consumed. Automatic instrumentation at the provider level typically stops at the boundary of the call it wraps, which means it misses the internal reasoning steps happening inside a multi-step agent loop. Provider-level auto-instrumentation is a floor, not a ceiling, for agent observability.
Keeping Baggage and Trace Data Safe in Production
Baggage travels in plain text across every hop in your system, which makes it a genuine data-handling decision, not a convenience feature.
- Never put secrets, API keys, or personally identifiable information into baggage. Map sensitive data to an opaque session or user ID and store the sensitive fields separately, in a system with actual access controls, as OpenTelemetry's own guidance recommends.
- Enforce a hard size limit on baggage and trim aggressively. Unbounded baggage growth across a multi-hop agent chain slows every downstream call and can hit header size limits at your load balancer.
- Set sampling and retention policies deliberately. Full-fidelity tracing on every request gets expensive fast in high-volume LLM systems, and long retention windows expand your exposure if trace data ever leaks.
- Treat trace data stores like any other system holding operational metadata: restrict access, and keep an audit trail for anyone querying traces that might contain customer-identifying baggage.
Where MLflow Fits Into an Orchestrator-Aware Tracing Setup
Everything above assumes you're wiring propagation by hand across every service boundary. That's the right foundation, but agent pipelines have a lot of boundaries, and an orchestrator-aware platform closes gaps that manual instrumentation tends to miss.
MLflow's tracing is built to manage span lifecycle at the orchestrator level, so it captures the full arc of an agent's reasoning: the initial LLM call, every intermediate tool invocation, and the final response, rather than just the outer HTTP boundary that provider-level auto-instrumentation typically catches.
- MLflow's AI Gateway centralizes header and baggage injection across providers, so a call to one LLM vendor and a call to another carry context consistently instead of depending on each provider's SDK behaving the same way.
- Its LLM-as-a-Judge evaluation attaches judgments directly to the trace that produced the output, so when a response looks wrong, you're looking at the exact reasoning chain, not guessing which of ten spans caused it.
- For the implementation recipes above, MLflow's SDK integrates with the propagator registration and queue carrier handling you'd otherwise build by hand, and it slots into the same unit and integration test patterns described earlier in this guide.
A Rollout Plan That Doesn't Require a Big-Bang Rewrite
Don't try to fix propagation everywhere at once. Phase one: register a global propagator and inject traceparent on every outbound LLM HTTP call. That alone resolves the majority of orphaned spans in most agent systems. Phase two: fix queue and background-task carriers, and lock the fix in with unit tests. Phase three: add orchestrator-level spans for deeper agent reasoning and payload-level tracing where you need forensic detail. Track your orphaned-span rate and mean time to root cause before and after each phase. Those two numbers tell you whether the work is paying off.
Instrumenting One Pipeline End to End Is the Fastest Way to Prove This Works
The fastest way to validate any of this is to pick one agent pipeline, wire propagation across every boundary it touches, and watch what happens to your orphaned-span rate. MLflow's AI observability tooling was built for exactly that kind of orchestrator-aware tracing, capturing the full agent reasoning chain instead of just the outer API call.
Where MLflow adds something manual instrumentation can't easily match is the link between traces and evaluation. Its LLM-as-a-Judge framework attaches automated judgments directly to the trace that generated the output, so when a response looks off, you go straight to the reasoning chain that produced it instead of reconstructing it from scattered logs. For teams building on agent frameworks covered in MLflow's multi-agent tracing guidance, the setup follows the same propagator registration and carrier patterns described above.
Start with one pipeline. Instrument it end to end, measure the drop in orphaned spans, and use that number to justify expanding coverage to the rest of your agent fleet.
What Most Teams Get Wrong About Propagation
Most engineering teams treat trace context propagation as a solved problem because OpenTelemetry's auto-instrumentation handles the common case so well. That confidence is exactly the trap. Auto-instrumentation was built for request-response HTTP chains, and agent systems are full of the boundaries it was never designed for: queues, background workers, and framework internals that swallow whole reasoning chains into a single opaque span.
The deeper issue is that most teams discover their propagation gaps reactively, during an incident, instead of proactively, through a test suite. A parent-child span assertion in CI costs almost nothing to write and catches a regression before it ships. Waiting until an on-call engineer stares at a truncated trace at 2 AM costs a lot more.
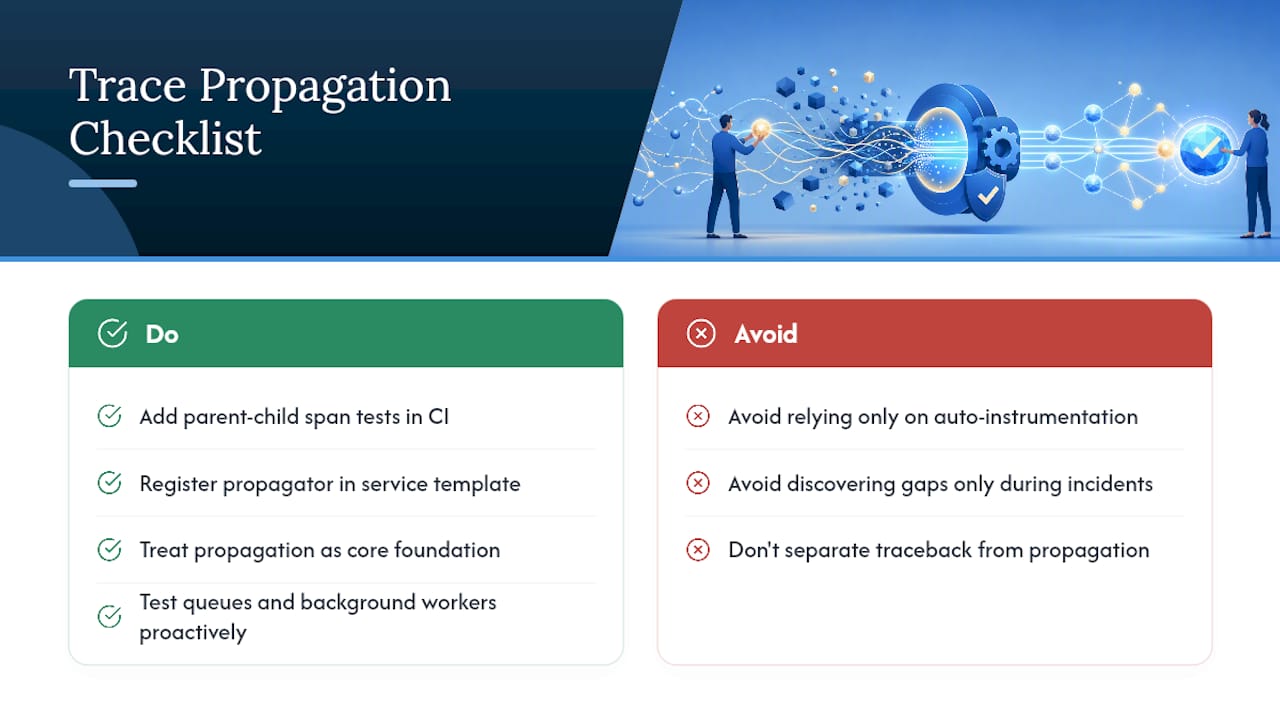
There's also a tendency to treat context traceback research like TracLLM as a separate, more advanced concern from basic propagation. It isn't separate so much as it's the next layer up: propagation gives you execution causality, which span called which, while context traceback tells you which piece of a long context actually drove a given output. Teams that get their propagation foundation solid are the ones positioned to use traceback research well, because they already have a trustworthy causal chain to attribute against. Skip the foundation, and traceback techniques have nothing solid to build on.
The teams that get this right don't treat it as an observability nice-to-have bolted on after launch. They wire the propagator registration into their service template on day one, so every new service inherits correct behavior instead of relearning the same lesson during an outage.
— Kevin
Sources
Consult the W3C Trace Context spec and OpenTelemetry's propagation docs for implementation detail, the TracLLM paper for context traceback research, and the librefang postmortem for a real-world fix.
- Context propagation | OpenTelemetry
- W3C Trace Context specification
- librefang pull request / postmortem (trace header injection fix)