Why Developers Log AI Traces: A 2026 Guide

Developers log AI traces because traditional logs simply cannot explain what an AI system actually did. A standard log tells you a function ran and returned HTTP 200. An AI trace tells you the model saw low-quality retrieved context, its confidence collapsed mid-reasoning, and it hallucinated a confident answer anyway. That gap is where production failures hide, and closing it is exactly why tracing has become the foundation of serious AI development in 2026.
The core distinction matters: logging records discrete, timestamped events (a prompt was sent, a tool was called, a response was returned). Tracing connects those events causally into a hierarchical tree that reflects the agent's actual reasoning sequence. Together, they give you the full picture of why an AI behaved the way it did, not just that it ran.
Key reasons developers prioritize AI trace logging:
- Debugging hallucinations and silent failures that return HTTP 200 while producing wrong answers
- Reconstructing causality across multi-step agentic workflows with dozens of tool calls
- Detecting gradual quality degradation before it becomes a user-facing incident
- Compliance and audit trails for high-stakes AI decisions involving sensitive data
- Continuous evaluation by attaching eval scores directly to trace data
Platforms like Mlflow make this observability practical at scale, providing production-grade tracing for LLM and agent workflows out of the box.
How logging and tracing actually differ in AI systems
The mental model most developers carry from web services breaks down fast when applied to AI. In a deterministic API, logging inputs and outputs is enough because the same input always produces the same output. AI systems produce different outputs for the same input depending on context, temperature, prompt formatting, and model checkpoint. Two executions of identical code can return contradictory results.

This forces a richer data model. Logging in AI systems must capture the full prompt (including system prompt, injected context, and conversation history), model parameters, token counts, tool call arguments and results, confidence signals, and retrieval similarity scores. Without the exact prompt, you cannot reproduce a model's output or explain a customer-facing error.
Tracing goes further by arranging these log events into a structured hierarchy. A typical AI agent request includes multiple model calls, tool calls, and retrieval steps organized as child spans of a root trace, all linked via a shared trace_id. This tree structure makes causality explicit: you can see that step 2's reasoning was shaped by step 1's retrieval result, and that a confidence mismatch between those two spans is worth investigating.
| Concept | What it captures | Structure | Primary use |
|---|---|---|---|
| Logging | Discrete timestamped events: prompts, API calls, outputs, errors | Flat stream | Point-in-time debugging, cost tracking |
| Tracing | Causal chain of spans across an entire request | Hierarchical tree (root + child spans) | Workflow reconstruction, root cause analysis |
| Structured logs (JSON) | Machine-parseable event fields with trace_id and span_id | Flat, indexed | Correlation with traces, alerting |
| Distributed trace | Full causal graph across services and sub-agents | Nested spans with parent-child links | Multi-agent observability, compliance |
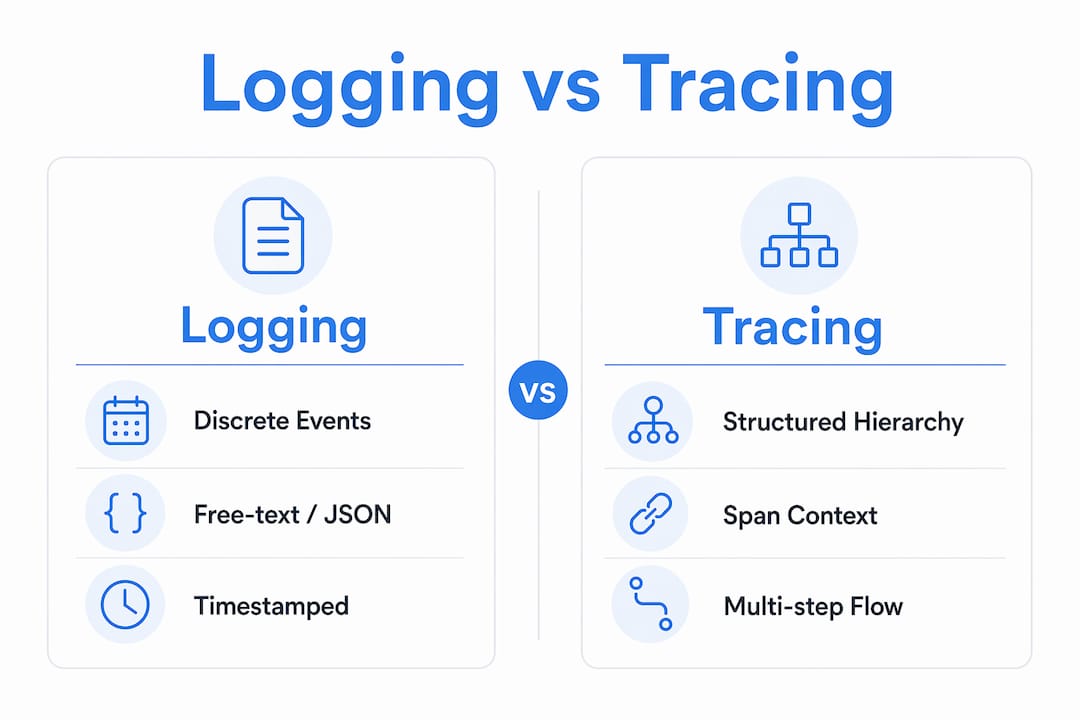
Structured logs (JSON rather than free text) are non-negotiable for AI systems. Free-text logs are human-readable but machine-unanalyzable. A structured log entry for an LLM call includes trace_id, span_id, model name, token counts, latency, finish reason, and a hashed user ID for PII protection. That trace_id is what OpenTelemetry's log SDK injects automatically into every log record produced during a traced request, enabling correlation across dispersed events with zero per-log-call effort.
Why tracing makes AI debugging, evaluation, and observability practical
The most common AI production failure mode is the silent one: the system runs without errors, returns a plausible response, and is completely wrong. A support agent that hallucinates returns HTTP 200. A retrieval step that pulls stale documents reports success. Conventional logs cannot distinguish between these states because the decision logic lives entirely between the logged events.
Traces solve this by capturing decision metadata at each span. When you log retrieval similarity scores alongside model confidence signals, the hallucination fingerprint becomes visible: a span where retrieval_confidence: 0.31 immediately precedes output_confidence: 0.89 flags a mismatch worth investigating. That pattern is invisible in I/O logs because both the retrieval success and the model response look identical to a correct interaction.
Benefits of AI trace logging for debugging and evaluation:
- Root cause analysis in minutes, not hours. A production hallucination visible in a confidence-mismatch span takes minutes to diagnose; the same failure invisible in I/O logs may require hours of trace replay.
- Query-driven debugging. Structured trace-and-span logging converts debugging from manual log mining to predictable, query-based troubleshooting: "Show me every run where a tool returned an empty result and the final answer still claimed success."
- Gradual quality detection. Treating LLM outputs as data rather than code, and logging structured quality metrics (faithfulness score, relevance score, refusal flag) alongside raw outputs, enables early warning of output degradation before it becomes a customer incident.
- Multi-step workflow observability. A single user request in a RAG-based agent may trigger embedding lookups, vector DB queries, multiple LLM calls, and tool executions. Without tracing, these appear as disconnected log entries with no causal link.
- Evaluation and continuous improvement. An eval failure is just a trace with a verdict attached. Attaching evaluation scores directly to trace data means debugging and evaluation become the same workflow, not separate concerns.
- Compliance and audit. Reasoning traces link prompts, tool calls, policy decisions, and secret access events, enabling reconstruction of causality and authorization in ways a state snapshot never could.
Pro Tip: When a user reports a hallucination, pull the trace ID from your observability backend using the timestamp and user ID. Check the span waterfall for the retrieval relevance scores, the prompt version active at that moment, and any confidence mismatch between retrieval and output spans. With all four logged, root cause analysis typically takes minutes.
The comparison between flat logs and structured traces is stark in practice:
| Debugging scenario | Flat logs | Structured traces |
|---|---|---|
| Hallucination in final answer | No signal (HTTP 200 returned) | Confidence mismatch span visible |
| Wrong tool selected | Tool name logged, no context | Alternatives considered + confidence logged |
| Retrieval degradation | Document fetched: success | Similarity scores per chunk logged |
| Multi-agent failure | Events in separate systems, no link | Single trace with causal child spans |
| Gradual quality drift | No early warning | Faithfulness/relevance scores trend over time |
Tools and best practices for instrumenting AI systems
The instrumentation principle that separates useful traces from noisy ones: wrap every decision boundary, not every function call. Model calls, tool selections, retrieval steps, and state mutations are the spans worth capturing. Instrumenting every function produces noise that makes debugging harder, not easier.
Here is a practical implementation approach:
-
Establish hierarchical span structure. Every user request roots a trace. Each model call, tool invocation, retrieval query, and memory operation becomes a child span. Use a shared
trace_idthreaded through every span so you can reconstruct the full decision path when something goes wrong. -
Capture decision metadata, not just I/O. For each model invocation, log the fully resolved input (not the template, the actual rendered messages including retrieved context), raw output including tool-call arguments before parsing, token counts for input and output separately, the model and parameters actually used, and timing split into network/queue time versus generation time.
-
Log tool results explicitly. The tool result re-enters the context and steers everything after it. Garbage in a tool result is the most common root cause of a confidently wrong final answer, and it is invisible unless you store it.
-
Use OpenTelemetry for correlation. OpenTelemetry's log SDK automatically injects
trace_idandspan_idinto every log record produced while a trace is active, enabling automatic correlation across dispersed events. The AgentTrace framework demonstrates how this integrates across cognitive, operational, and contextual surfaces while exporting to an OpenTelemetry backend for distributed tracing. -
Structure logs as JSON. Include
trace_id,span_id, model name, token counts, latency, finish reason, and a hashed user ID. Cost logged at the individual call level (not aggregated) enables attribution by product area. -
Apply PII scrubbing at the collector level. Log raw prompts via span events following the OpenTelemetry GenAI convention, not in span attributes. This lets you drop or scrub prompt content at the OpenTelemetry Collector before it reaches storage without changing application code.
-
Treat traces as queryable structured data. A trace stored as a flat log file is half the job done. Index fields, attach evaluation scores to the same trace object, and enable queries like "which model version started producing 3x the tool calls last Tuesday?" That is where observability and evaluation converge.
Pro Tip: Wrap your model client and tool dispatcher so trace instrumentation happens automatically. If capturing a span requires discipline at every call site, it will rot within a month. Automatic wrapping at the client level means every model call and tool dispatch emits a span without developer overhead.
| Framework / tool | Role in AI tracing |
|---|---|
| OpenTelemetry | Injects trace_id/span_id, auto-instruments libraries, exports to backends |
| Mlflow | Lifecycle management, LLM and agent tracing, evaluation, experiment tracking |
| JSON structured logs | Machine-parseable event records enabling query-driven debugging |
| AgentTrace schema | Cognitive, operational, and contextual surface taxonomy for LLM agents |

Understanding how AI observability works at the instrumentation level is what separates teams that can debug production failures in minutes from those spending hours in log archaeology.
Where AI logging and tracing are heading in 2026
The most significant shift underway is from code-centric to trace-centric AI development. In traditional software, the code documents the application. In AI systems, the traces do. Debugging, testing, profiling, and monitoring all shift from operating on code to operating on traces, because the decision logic lives in the model at runtime, not in the codebase.
One practical consequence: trace-centric development enables switching models without changing code. When telemetry reveals actual runtime reasoning, you can swap underlying models and compare trace behavior directly, rather than inferring changes from output quality alone.
Runtime governance is the other major trend. Frameworks including OWASP Agentic AI Top 10 and NIST AI Risk Management Framework now treat traces as security evidence, not just debugging telemetry. Sensitive information in prompts or retrieved context demands selective trace retention and PII scrubbing, making policy-driven tracing a compliance requirement rather than an engineering nicety. The emerging best practice is to capture each tool call with timestamp, actor, input, output, and policy outcome, and link the trace to workload identity rather than a shared service account.
The privacy tension is real. Tighter trace logging increases storage, privacy, and operational overhead. The practical resolution is surgical rather than binary: keep structured metadata (tool name, error code, latency, token counts) always on in production, apply PII redaction to tool arguments and retrieval results, and enable full content recording in development and replay contexts. Turning tracing off entirely to solve a privacy concern trades one risk for another, removing the visibility needed to catch silent failures that may themselves represent compliance risks.
AI observability platforms are also converging with continuous evaluation pipelines. The fastest teams capture production traces, analyze them for failure patterns, build test datasets from real usage, and run evaluations to measure quality. That loop, traces feeding evals feeding prompt A/B tests feeding replay, is becoming the standard development cycle for production AI systems.
How Mlflow powers advanced AI tracing and lifecycle management
Mlflow is a comprehensive open-source platform built specifically for the lifecycle management of GenAI and LLM applications, with first-class support for agent tracing and observability. It covers experiment tracking, LLM tracing, automated evaluation, and a centralized AI Gateway for secure prompt management and cross-provider governance.
What Mlflow provides for AI tracing:
- Hierarchical LLM and agent tracing that captures detailed decision metadata across multi-step agentic workflows, including sub-agent spans and tool call chains
- Automated evaluation using LLM-as-a-Judge frameworks, enabling teams to attach pass/fail verdicts directly to trace data for continuous quality monitoring
- Experiment tracking that links trace data to model versions, prompt templates, and parameter configurations, making it possible to compare trace behavior before and after a change
- Integration with AI safety tooling including Inspect AI, supporting production readiness and governance for agentic systems
- Open-source community adoption with active development and broad framework compatibility, including support for OpenTelemetry-based telemetry pipelines
A practical Mlflow tracing workflow looks like this: instrument your agent's model calls and tool dispatchers using Mlflow's tracing SDK, which emits spans with decision metadata (confidence scores, retrieval similarity, token counts) to Mlflow's tracking server. From there, you can query traces by failure pattern, attach evaluation scores from an LLM-as-a-Judge run, and compare trace trees across model versions side by side.
Pro Tip: Use Mlflow's AI monitoring capabilities to set span-level latency thresholds and quality score alerts. When a retrieval span's similarity scores drop below your defined threshold, you want an alert before users notice degraded answers, not after.
| Mlflow capability | What it enables |
|---|---|
| Agent tracing | Full span hierarchy for multi-step agentic workflows |
| LLM-as-a-Judge evaluation | Automated quality scoring attached to trace data |
| Experiment tracking | Compare trace behavior across model versions and prompt changes |
| AI Gateway | Secure prompt management and cross-provider governance |
| Inspect AI integration | AI safety evaluation linked to production trace data |
For teams building GenAI and agent applications, Mlflow's open-source model means you own your trace data, control your retention policies, and integrate with your existing observability stack without vendor lock-in. That combination of production-grade tracing and open governance is what makes it the platform of choice for teams serious about AI observability in 2026.
How logging and tracing affect AI model performance and privacy
Tracing does carry overhead, but the cost is manageable when instrumentation is targeted. Capturing a span's structure and transmitting it costs more than the decision metadata itself. A promiscuous approach that instruments every function call produces noise and storage costs that outweigh the debugging value. Targeted instrumentation at model calls, tool selections, and retrieval steps keeps overhead low while preserving the diagnostic signal that matters.
The privacy dimension is more complex. Production AI systems routinely handle prompts containing user names, email addresses, financial data, and health information. Storing these in an observability platform without controls creates GDPR, HIPAA, and EU AI Act exposure. The solution is not to disable tracing but to apply policy-driven selective retention with PII scrubbing at the collector level before data reaches storage.
Sampling strategy also matters. Traditional APM sampling (tracing 1% of requests) is reasonable for web services where failures are statistically distributed. Agent failures are not. A hallucination triggered by a specific combination of user context and memory state will not appear in a 1% sample. For AI systems, monitoring every session is the standard, with PII redaction applied to content fields rather than sampling applied to sessions.
Understanding how your AI logging best practices interact with data governance requirements is part of production readiness. Teams that treat trace data as structured, queryable, and privacy-controlled from the start avoid the painful retrofit of adding governance controls after a compliance review. Logging LLM output quality metrics alongside raw outputs is one concrete way to maintain observability without retaining sensitive prompt content indefinitely.
Key Takeaways
Logging and tracing AI systems is the foundational practice that makes debugging, evaluation, and governance possible for any production AI application in 2026.
| Point | Details |
|---|---|
| Traces reveal reasoning, not just execution | A trace captures confidence signals, tool alternatives, and retrieval quality that flat logs miss entirely. |
| Structured hierarchy is required | Organize spans as a tree with a shared trace_id so causality across model calls and tool steps is explicit. |
| Target decision boundaries | Instrument model calls, tool selections, and retrieval steps only; logging every function call creates noise. |
| Policy-driven PII scrubbing | Apply redaction at the OpenTelemetry Collector level to protect sensitive prompt content without disabling tracing. |
| Mlflow unifies tracing and evaluation | Mlflow's open-source platform links trace data to LLM-as-a-Judge evaluation scores for continuous quality monitoring. |
Start tracing your AI agents with Mlflow

If your agents are running in production without structured trace data, you are working without the source of truth for what they actually do. Mlflow's open-source AI platform gives you production-grade agent tracing, automated evaluation, and a centralized AI Gateway, all in one place, without proprietary lock-in.
Instrument your first agent trace today and see exactly where your model's reasoning goes wrong, before your users do.