Setting Up LLM Observability Pipelines in 2026

When an LLM agent returns a hallucinated answer, loops unexpectedly, or burns through token budgets without explanation, traditional application logs give you almost nothing useful. Setting up LLM observability pipelines is what separates teams that debug in minutes from those that debug for days. Unlike conventional services where a stack trace tells the whole story, LLM applications require tracing across prompt construction, model inference, retrieval steps, tool calls, and evaluation scoring. This article walks you through every layer of that system, from foundational OpenTelemetry instrumentation to production-grade evaluation pipelines.
Table of Contents
- Key Takeaways
- Setting up LLM observability pipelines: foundational concepts
- Step-by-step pipeline setup with OpenTelemetry
- Observability for agentic workflows and RAG
- Evaluation and quality monitoring inside the pipeline
- Troubleshooting common mistakes in LLM observability
- My take on where LLM observability is heading
- How MLflow makes LLM observability production-ready
- FAQ
Key Takeaways
| Point | Details |
|---|---|
| Start with semantic conventions | Use OpenTelemetry GenAI attributes like "gen_ai.systemandgen_ai.usage.input_tokens` for vendor-neutral, consistent tracing. |
| Instrument every pipeline layer | Capture spans for LLM calls, retrieval steps, and tool invocations so you can attribute latency and cost to each step. |
| Sample for evaluation, not just volume | Run LLM-as-judge scoring on 10 to 20% of production traffic to balance quality coverage against evaluation cost. |
| Sanitize before you store | Automate prompt and completion scrubbing in your instrumentation wrapper to protect privacy at the source. |
| Pin your convention versions | Treat OpenTelemetry GenAI semantic conventions as a versioned contract and update regularly to avoid silent data breakage. |
Setting up LLM observability pipelines: foundational concepts
Before you write a single line of instrumentation code, you need a clear mental model of how LLM tracing differs from standard distributed tracing.
The bedrock standard here is OpenTelemetry. Its GenAI semantic conventions extend the core specification with LLM-specific spans and metrics, giving you a vendor-neutral schema that works whether you are calling OpenAI, Anthropic, or a self-hosted model. The key attributes you will encounter constantly are standardized across vendors: gen_ai.system, gen_ai.request.model, gen_ai.prompt, gen_ai.completion, gen_ai.usage.input_tokens, and gen_ai.usage.output_tokens. These attributes give every span a consistent shape regardless of which model provider sits behind it.
Beyond OpenTelemetry, you should know about OpenInference semantic conventions. These are compatible with OpenTelemetry and add detailed attributes for tool call correlation, including message.tool_call_results and tool_call_result.* fields. For agentic pipelines specifically, these attributes become indispensable.
A few concepts to lock in before proceeding:
- Parent-child span relationships. Every LLM request sits inside a parent trace. The parent span represents the user-facing operation. Each LLM call, retrieval step, or tool invocation becomes a child span under it. This hierarchy is what lets you attribute latency and cost to specific pipeline steps.
- Sampling strategy. Not every trace needs to be stored at full fidelity. Head-based sampling (decided at trace start) is simpler; tail-based sampling (decided after the trace completes) is more powerful for capturing error cases. For most production LLM systems, a hybrid approach works best.
- Data privacy. Prompts and completions often contain sensitive user data. Your instrumentation layer must scrub or mask this content before it reaches any observability backend.
Step-by-step pipeline setup with OpenTelemetry
With the conceptual foundation in place, here is how to build the instrumentation layer.
-
Initialize your tracer provider and OTLP exporter. Configure the OpenTelemetry SDK with an OTLP exporter pointing at your observability backend (Jaeger, Tempo, or a managed service). Set
service.nameandservice.versionas resource attributes so every span carries deployment context. -
Create a root span early. The root span must be created at the very start of the request lifecycle. This matters because batch processors buffer child spans until the root arrives. If the root span is emitted late or after its children, attribute aggregation and enrichment will fail silently.
-
Instrument your LLM call as a child span. Wrap your model invocation in a span named with the
gen_ai.prefix pattern. Recordgen_ai.request.model,gen_ai.usage.input_tokens, andgen_ai.usage.output_tokensas span attributes. Log the prompt and completion as span events rather than attributes when content size is large. -
Sanitize before recording. Automate prompt data scrubbing inside your instrumentation wrapper rather than relying on developers to remember it call by call. A wrapper function that strips PII before writing span events is the right pattern.
-
Set sampling rates by environment. Use 100% sampling in development and staging. In production, 10 to 30% head-based sampling on the trace level is typical for cost management, with tail-based sampling triggered on errors or high latency.
-
Export and verify the data flow. Send a test request and confirm spans appear in your backend with the correct attribute names. Check that parent-child relationships are intact and that token counts are present.
from opentelemetry import trace
from opentelemetry.sdk.trace import TracerProvider
from opentelemetry.exporter.otlp.proto.grpc.trace_exporter import OTLPSpanExporter
from opentelemetry.sdk.trace.export import BatchSpanProcessor

provider = TracerProvider()
exporter = OTLPSpanExporter(endpoint="http://localhost:4317")
provider.add_span_processor(BatchSpanProcessor(exporter))
trace.set_tracer_provider(provider)

tracer = trace.get_tracer("llm-service")

with tracer.start_as_current_span("llm.chat") as span:
    span.set_attribute("gen_ai.system", "openai")
    span.set_attribute("gen_ai.request.model", "gpt-4o")
    # call model here, then record usage
    span.set_attribute("gen_ai.usage.input_tokens", 512)
    span.set_attribute("gen_ai.usage.output_tokens", 128)
Pro Tip: Never log raw completion content as a span attribute in production. Span attributes are indexed and stored long-term in most backends. Use span events for completion content and apply a sanitization filter at the event level.
Instrumentation wrappers are the right abstraction boundary. A single, well-tested wrapper around your LLM client keeps sanitization, attribute naming, and span lifecycle logic in one place. Every new model integration then inherits correct behavior for free.
Observability for agentic workflows and RAG
Simple LLM call tracing is a solved problem. Agentic workflows are where LLM data flow monitoring gets genuinely complex. When an agent reasons over multiple steps, selects tools, and chains completions, you need a span model that reflects that structure.

For agents, the recommended pattern is a hierarchy with three levels. The top-level span represents the agent session or user turn. Below it, reasoning spans capture each planning or deliberation step. Tool call spans sit as children of the reasoning span that triggered them, with their results recorded as attributes on the span itself. Distributed tracing with parent-child spans is the dominant pattern here because it lets you reconstruct exactly which reasoning step chose which tool and what the result was.
For RAG pipelines specifically, the span model becomes:
- Embedding span. Records the input query, embedding model name, and latency.
- Retrieval span. Captures the vector store query, number of documents returned, and any reranking scores. An end-to-end RAG observability implementation instruments each of these steps as discrete spans so you can isolate whether poor answers come from bad retrieval or bad generation.
- Generation span. Records the assembled context length, the model call attributes, and the final completion.
Cost and latency attribution per step is what turns a RAG trace into an optimization tool. When your p95 latency spikes, a well-structured trace will tell you whether the retrieval step or the generation step is responsible. Without that granularity, you are guessing.
Capturing fine-grained agent behavior including tool selection rationale, decision scores, and reasoning paths is what separates observability that answers "what happened" from observability that answers "why."
Evaluation and quality monitoring inside the pipeline
Latency and token cost are easy to measure. Output quality is not. Embedding automated evaluation directly into your observability pipeline closes that gap.
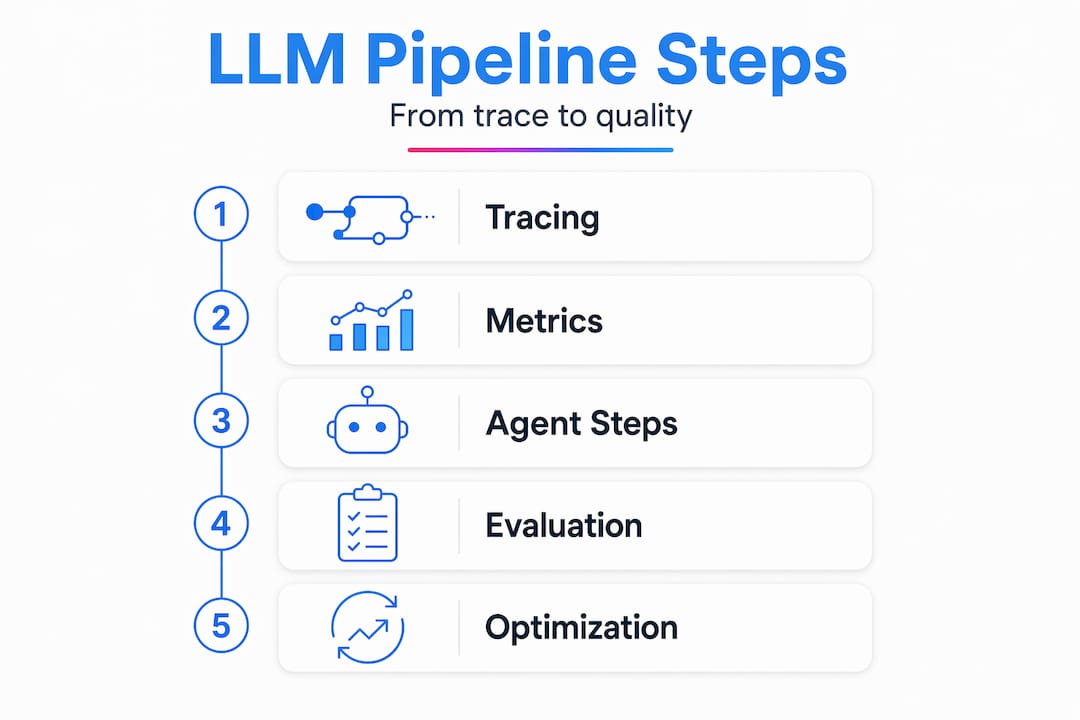
The LLM-as-judge pattern works well here. You route a sampled subset of production completions to a judge model that scores them against criteria like factual accuracy, relevance, or instruction following. Running judges on 10 to 20% of traffic gives you statistically meaningful signal without doubling your inference costs. Those scores feed back into your observability platform as custom metrics or span attributes, making them queryable alongside latency and token data.
A few practices that make this work reliably in production:
- Write scores back as span attributes. Attach the judge score directly to the generation span so it correlates with the full trace context. This lets you query "show me all traces where quality score dropped below 0.7 and retrieval returned fewer than three documents."
- Track calibration drift. Judge models drift over time as the distribution of inputs shifts. Schedule periodic human validation sessions to compare automated scores against human ratings. When agreement drops below a threshold, retrain or reconfigure the judge.
- Alert on anomalies, not just averages. A rolling average quality score can look stable while a specific intent cluster degrades badly. Set up per-intent or per-topic alerts so regressions in narrow use cases surface before users report them.
Pro Tip: Store judge prompts and scoring rubrics in a version-controlled prompt registry. When your quality scores shift unexpectedly, the first question is always whether the judge prompt changed. A prompt registry removes that uncertainty.
Troubleshooting common mistakes in LLM observability
Even well-designed observability pipelines break in predictable ways. Here are the failure modes we see most often and how to address them.
| Failure Mode | Root Cause | Fix |
|---|---|---|
| Missing attributes on root span | Root span emitted before child spans complete enrichment | Create root span early; use async-safe context propagation |
| Silent data loss in dashboards | GenAI convention version mismatch after SDK update | Pin convention versions; treat as versioned contracts |
| Tool call results not correlating | Missing tool_call_id on result spans | Use OpenInference attributes; propagate call IDs explicitly |
| Storage cost spikes | Sampling not applied; raw completions indexed | Apply head-based sampling; move completions to span events |
| Traces broken across services | Missing context propagation headers | Inject and extract W3C traceparent headers at service boundaries |
The version pinning issue deserves specific emphasis. New attributes like gen_ai.usage.reasoning.output_tokens have been added to the GenAI conventions. When you upgrade your SDK without updating your instrumentation, dashboards that query old attribute names silently return null values. Pin your semantic convention version in your dependency manifest and treat each upgrade as a planned instrumentation migration, not a patch update.
For multi-step agents, designing span models that capture input parameters, tool call identifiers, execution results, and reasoning metadata from the start prevents observability dead-ends later. Retrofitting this structure into a running production system is expensive.
My take on where LLM observability is heading
I've spent considerable time working with teams deploying agentic systems in production, and my honest view is this: most engineers underestimate how quickly their observability setup becomes stale.
When I first started instrumenting LLM pipelines, the instinct was to treat them like microservices. Add some logs, track response times, watch error rates. That breaks down fast once you add a second agent or a tool-calling loop. The non-determinism is the hard part. The same input can produce radically different reasoning paths on different runs, and without semantic traces that capture each decision point, you cannot tell whether a failure is a fluke or a pattern.
What I've found works is building observability as a first-class concern from day one, not as an afterthought after the pipeline is already running in production. The teams that do this early invest maybe 15% more time upfront and save enormous amounts of debugging effort later. The teams that skip it end up flying blind when a cost spike or quality regression hits at 2 AM.
The other thing I'd push back on is the idea that "good enough" evaluation is fine for production. Calibration drift in your judge model is real, and it compounds. I've seen teams confident in their quality metrics only to discover their judge had drifted significantly from human ratings over three months. Periodic human validation is not optional; it's how you keep the evaluation signal honest.
Evolving conventions require ongoing attention. This is not a set-it-and-forget-it system. Budget time each quarter to review new OpenTelemetry GenAI convention releases and update your instrumentation accordingly.
— Kevin
How MLflow makes LLM observability production-ready
Getting LLM observability right from scratch requires significant engineering investment. MLflow reduces that burden considerably, giving you production-grade tooling without building every layer yourself.

MLflow's LLM tracing and agent observability platform provides deep, automatic instrumentation for agentic reasoning, tool calls, and retrieval steps. It follows OpenTelemetry-compatible conventions out of the box, so your traces integrate cleanly with existing backends. For evaluation, MLflow's LLM-as-a-judge framework lets you configure custom judges, run them on sampled production traffic, and push scores back into your trace data. The built-in prompt registry versions your judge prompts alongside your application prompts, closing the calibration drift loop. If you are building or scaling agent and LLM evaluation pipelines, MLflow gives your team a structured path from prototype to monitored production system.
FAQ
What attributes does OpenTelemetry use for LLM tracing?
OpenTelemetry GenAI semantic conventions define standard attributes including gen_ai.system, gen_ai.request.model, gen_ai.usage.input_tokens, and gen_ai.usage.output_tokens to capture model calls consistently across vendors.
How do you trace multi-step LLM agents?
Use a parent-child span hierarchy where the agent session is the root span, reasoning steps are child spans, and tool invocations are nested under the reasoning span that triggered them. This lets you reconstruct the full decision path for any production trace.
What sampling rate should I use for LLM-as-judge evaluation?
Running judge evaluation on 10 to 20% of production traffic balances quality coverage against inference cost, and requires periodic human validation to detect calibration drift in the judge model.
How do I prevent sensitive prompt data from reaching my observability backend?
Automate sanitization inside your instrumentation wrapper so all prompt and completion content is scrubbed before any span events are written. Never rely on individual developers to apply this manually at each call site.
Why do my traces show missing attributes after an SDK update?
This is almost always a semantic convention version mismatch. Pin your GenAI convention version in your dependency manifest and treat upgrades as planned migrations. New attributes added to the spec, like gen_ai.usage.reasoning.output_tokens, will silently return null if your instrumentation still queries old attribute names.