Model Serving Infrastructure: A Practical MLOps Guide

Model serving infrastructure is the production-grade software and hardware stack that exposes trained ML models as reliable, observable, and scalable services. It handles runtime concerns that have nothing to do with model accuracy: autoscaling, load balancing, health checks, versioning, and monitoring. If you're asking whether you need to invest in it, here's a quick check:
- Latency-sensitive production APIs where users or downstream systems expect sub-second responses
- Multiple models or tenants running concurrently, each with independent versioning and traffic policies
- LLM or GPU-accelerated workloads, or any system with strict cost and SLA constraints
The rest of this guide unpacks every layer of that stack, from architecture patterns and component roles to deployment controls, observability, and where Mlflow fits as the lifecycle and observability anchor.
Key Takeaways
Model serving infrastructure is the runtime layer that determines whether a trained model actually delivers value in production, and getting it right requires deliberate choices across architecture, tooling, observability, and operations.
| Point | Details |
|---|---|
| Serving is distinct from deployment | A containerized model is not production-ready; serving adds autoscaling, SLA enforcement, versioning, and output monitoring. |
| Architecture pattern drives tradeoffs | Choose synchronous for sub-500ms APIs, async for bursty workloads, streaming for LLMs, and batch for staleness-tolerant pipelines. |
| Instrument model outputs, not just infra | p99 latency and error rate are necessary but not sufficient; add output schema checks and feature drift monitoring from day one. |
| Mlflow anchors the lifecycle | Mlflow's model registry, LLM-as-a-Judge evaluation, and agent tracing connect experiment tracking to production serving observability. |
Table of Contents
- What is model serving infrastructure, and how does it differ from training and deployment?
- What does a model serving infrastructure actually need to do?
- Which serving architecture pattern fits your use case?
- How does the full infrastructure stack fit together?
- Which serving frameworks and runtimes should you use?
- How do you deploy model updates safely in production?
- What should you monitor once a model is in production?
- What security and compliance controls does production serving require?
- How do you optimize performance and control costs?
- How does Mlflow map to model serving infrastructure needs?
- The first 90 days of running a serving system: a practitioner's perspective
- Mlflow gives you the observability layer your serving stack is missing
- Sources
What is model serving infrastructure, and how does it differ from training and deployment?
Engineers often treat a containerized model as "done." It isn't. Training, deployment, and serving are three distinct phases with different goals, different failure modes, and different owners.
Training is about experimentation and throughput. You're iterating on data, features, and hyperparameters. Correctness matters; latency doesn't. A job that runs for six hours overnight is fine.
Deployment is the act of making a trained artifact available. You package the model, push it to a registry, and declare it ready. This is a one-time transition, not a continuous runtime concern.
Serving is the continuous runtime layer. It's where the model actually receives requests, processes them under concurrency, and returns responses within an SLA. Serving owns latency, caching, autoscaling, rollback, and output quality monitoring. A model can be "deployed" and still completely fail at serving if the infrastructure behind it isn't production-grade.
| Dimension | Training | Deployment | Serving |
|---|---|---|---|
| Primary goal | Model accuracy | Artifact availability | Runtime reliability and SLA |
| Key metric | Loss, F1, AUC | Build success, registry push | p99 latency, throughput, error rate |
| Failure mode | Divergence, overfitting | Broken container, missing deps | Timeout, OOM, drift, cold-start |
| Shared concerns | Model registry, reproducibility | Model registry, versioning | Versioning, rollback, CI/CD hooks |
| Unique concerns | Data pipelines, compute cost | Packaging, environment parity | Autoscaling, caching, traffic routing |
The overlap sits in the model registry and reproducibility. Both deployment and serving depend on a versioned artifact store. But only serving must answer the question: "What happens when 10,000 requests arrive in the next second?"
What does a model serving infrastructure actually need to do?
A production serving stack carries more operational responsibility than most teams anticipate at first. The feature surface is wide.
Runtime API and concurrency:
- Expose a typed HTTP or gRPC endpoint per model version
- Handle concurrent requests without blocking, using thread pools or async workers
- Enforce request timeouts and circuit breakers to prevent cascade failures
Model lifecycle management:
- Version-pinned model loading with hot-swap capability (no restart required for new versions)
- Rollback to a previous version within seconds when a new version degrades
- Health and readiness probes that distinguish "container is up" from "model is loaded and warm"
Traffic and routing controls:
- Weighted traffic splitting for canary and A/B deployments
- Request routing by model version, tenant, or feature flag
- Rate limiting per client or API key to protect capacity
Observability and quality:
- Structured request/response logging with configurable sampling rates
- Latency histograms (p50, p95, p99), throughput in requests per second, and error rate
- Output quality checks and drift detection, not just infrastructure metrics
- Explainability hooks for audit trails in regulated industries
Operational governance:
- CI/CD integration so model updates flow through automated validation before promotion
- Secret management for model store credentials and API keys
- Deployment governance: approval gates, staging parity enforcement, and rollback thresholds
Pro Tip: Test model output quality inside your health check, not just container liveness. A pod that returns HTTP 200 but produces hallucinated or schema-invalid outputs is a silent production failure. Add a lightweight smoke-test inference call with a known input/output pair to your readiness probe.
Which serving architecture pattern fits your use case?
The four major patterns each optimize for a different point on the latency-throughput-cost triangle. Choosing the wrong one is one of the most common and expensive mistakes in ML infrastructure.
Batch serving
The model processes a large dataset in a scheduled job. No live endpoint, no concurrency pressure. Cost-efficient and operationally simple. The tradeoff is staleness: predictions are only as fresh as the last batch run.
Best for: Overnight scoring pipelines, recommendation pre-computation, fraud scoring on historical data, any use case where a few hours of staleness is acceptable.
Synchronous (online) serving
The model receives a single request and returns a response in the same HTTP connection. This is the standard REST or gRPC inference API pattern. Latency is the primary constraint; the infrastructure must keep p99 latency within SLA under peak load.
Best for: User-facing features (search ranking, content moderation, real-time pricing), any system where the caller blocks on the response.
Asynchronous serving
The caller submits a request to a queue and polls or receives a callback when the result is ready. This decouples request ingestion from model execution, which smooths traffic spikes and allows the serving layer to batch opportunistically.
Best for: Long-running inference (large document processing, image generation), workloads with bursty traffic patterns, or cases where the caller can tolerate seconds of latency.
Streaming serving
The model processes a continuous stream of inputs, often with stateful context. LLM token streaming is the canonical example: the model generates tokens incrementally and the client renders them as they arrive. ML serving architectures note that streaming increases system complexity significantly but enables high throughput and low time-to-first-token for generative workloads.

Best for: LLM chat interfaces, real-time anomaly detection on event streams, any use case where partial results have value before the full response is complete.
Decision rubric: Start with your latency requirement. If the caller blocks and needs a response in under 500ms, synchronous serving is the only viable pattern. If latency tolerance is measured in seconds or minutes, async or batch become options. If you're running LLMs and token-streaming matters to the user experience, streaming is non-negotiable. GPU availability and cost then determine whether you run dedicated endpoints or share capacity across tenants.
How does the full infrastructure stack fit together?
A production serving architecture organizes into three primary layers: the inference engine at the bottom, the serving layer in the middle, and the orchestration layer at the top. Each layer has distinct responsibilities, and the failure modes at each level are different.
Layer 1: Inference engine
This is where the model actually runs. The inference engine loads model weights, manages GPU/CPU memory, and executes the forward pass. Key components:
- Model runtime: TensorFlow, PyTorch, ONNX Runtime, TensorRT, or a framework-specific backend
- Hardware allocation: GPU memory partitioning, multi-GPU tensor parallelism or pipeline parallelism for large models
- Optimization layer: quantization (INT8/FP16), kernel fusion, KV-cache management for LLMs
For LLMs specifically, KV-cache efficiency is the dominant cost driver. A poorly configured cache forces recomputation on every request, which multiplies GPU hours and latency simultaneously.
Layer 2: Serving layer
The serving layer wraps the inference engine with the API contract and request management logic:
- Request ingestion, input validation, and preprocessing
- Dynamic batching to group concurrent requests into a single forward pass
- Output postprocessing and response serialization
- Request routing between model versions or predictor/transformer/explainer components
Layer 3: Orchestration
The orchestration layer manages the serving layer at scale:
- Container scheduling and placement (Kubernetes is the dominant choice)
- Autoscaling policies: CPU/GPU utilization, request queue depth, or custom LLM metrics via KEDA
- Health probes, pod disruption budgets, and rolling update controls
- Resource quotas and namespace isolation for multi-tenant deployments
Supporting infrastructure components:
- API gateway / load balancer: TLS termination, auth, rate limiting, and traffic routing before requests reach the serving layer
- Model registry: versioned artifact storage with lineage metadata; the handoff point between training and serving
- Feature store: low-latency feature retrieval for models that require online features at inference time
- Cache layer: Redis or a similar store for memoizing repeated inference results or feature vectors
- Observability stack: metrics (Prometheus), tracing (OpenTelemetry), and log aggregation (Loki, Elasticsearch)
Production readiness checklist:
- Liveness and readiness probes configured with model-warm checks, not just process checks
- Secrets (model store credentials, API keys) managed via Vault or Kubernetes Secrets with rotation policies
- Staging environment with production-parity containers, libraries, and hardware configurations
- Graceful shutdown handling so in-flight requests complete before pod termination
- Resource requests and limits set on every container to prevent noisy-neighbor failures
On hardware choices: CPU serving works well for small models with low concurrency. Once you cross roughly 50 concurrent requests or move to transformer-based models above a few hundred million parameters, GPU serving typically becomes necessary to hit latency SLAs. For very large LLMs (70B+ parameters), tensor parallelism across multiple GPUs is standard. Pipeline parallelism is an alternative when inter-GPU bandwidth is the bottleneck.
Which serving frameworks and runtimes should you use?
Production deployments require automation of containerization, orchestration, API setup, and monitoring. The framework you choose determines how much of that automation comes out of the box versus what you build yourself.
-
KServe: Kubernetes-native standardized inference platform supporting both generative and predictive AI. Includes request-based autoscaling, model caching, KV cache offloading, and inference pipelines. Best for: teams running Kubernetes who need a single platform for both classical ML and LLMs. Operational complexity is moderate; the CRD-based model spec is clean but requires Kubernetes fluency.
-
TensorFlow Serving: Production-ready serving system with model versioning, dynamic batching, and performance optimizations for TensorFlow models. Best for: TensorFlow-native shops that need a battle-tested, low-overhead runtime. Limited to TF SavedModel format; not a fit for PyTorch or ONNX-first teams.
-
TorchServe: PyTorch's own serving runtime, designed for multi-model serving and model management with a clean REST and gRPC API. Best for: PyTorch-first teams who want a first-party solution without Kubernetes overhead. Supports custom handlers for pre/postprocessing, which is useful for vision and NLP pipelines.
-
NVIDIA Triton Inference Server: High-performance inference server supporting TensorFlow, PyTorch, ONNX, TensorRT, and custom backends. Designed for GPU-accelerated workloads with dynamic batching and concurrent model execution. Best for: teams with heterogeneous model formats and GPU fleets who need maximum throughput. Operationally complex but unmatched on raw GPU utilization.
-
BentoML: Python-native framework for packaging and serving ML models with a focus on developer experience. Supports most major frameworks and generates Docker images and Kubernetes manifests automatically. Best for: teams that want to go from a Python model to a production API quickly, without deep Kubernetes expertise. Less opinionated on hardware optimization than Triton.
-
vLLM: High-throughput LLM inference engine with PagedAttention for efficient KV-cache management. Supports continuous batching, which dramatically improves GPU utilization for LLM workloads. Best for: teams serving large language models at scale where throughput and cost efficiency are the primary constraints. Not designed for classical ML models.
-
Mlflow: Open-source platform for the full ML and GenAI lifecycle, including a model registry, artifact storage, and serving integration. Supports deployment to multiple runtimes and provides built-in observability, LLM-as-a-Judge evaluation, and agent tracing. Best for: teams that need a unified lifecycle platform connecting experiment tracking, model registry, and production serving with deep observability for LLMs and agents.
-
Hugging Face Inference Endpoints: Managed inference service for Hugging Face Transformers models. Handles hardware provisioning, autoscaling, and security. Best for: teams that want to deploy a Transformers model without managing infrastructure. Fastest path to production for open-source LLMs; less flexible for custom pre/postprocessing pipelines.
| Framework | Best for | Supported formats | Autoscaling | GPU support | Ops complexity |
|---|---|---|---|---|---|
| KServe | Kubernetes-native, LLMs + classical ML | TF, PyTorch, ONNX, custom | Request-based, scale-to-zero | Yes, multi-GPU | Moderate |
| TF Serving | TensorFlow production workloads | TF SavedModel | Manual / K8s HPA | Yes | Low |
| TorchServe | PyTorch multi-model serving | PyTorch, TorchScript | Manual / K8s HPA | Yes | Low |
| NVIDIA Triton | GPU-heavy, multi-framework | TF, PyTorch, ONNX, TensorRT | Manual / K8s HPA | Yes, optimized | High |
| BentoML | Fast Python-to-API, any framework | Most major frameworks | Built-in, K8s | Yes | Low |
| vLLM | LLM throughput at scale | HuggingFace, GGUF | Manual / K8s | Yes, PagedAttention | Moderate |
| Mlflow | Lifecycle + observability + agents | TF, PyTorch, ONNX, custom | Via runtime integration | Via runtime | Low to moderate |
| HF Inference Endpoints | Managed Transformers deployment | Transformers, GGUF | Managed | Managed | Very low |
How do you deploy model updates safely in production?
Safe model updates require more than pushing a new container. The deployment pattern you choose determines how much production traffic is at risk during a rollout, and how quickly you can recover when something goes wrong.
Deployment patterns
-
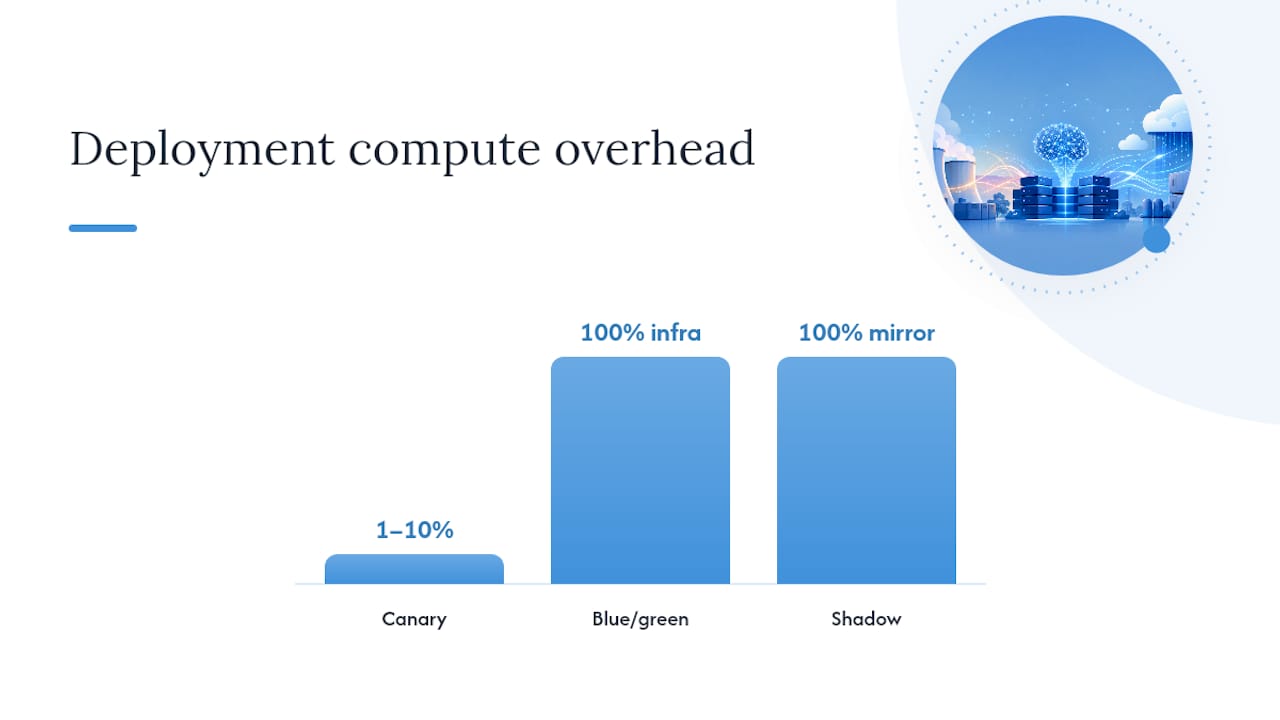
Blue/green deployment: Two identical environments run in parallel. Traffic switches atomically from the current version (blue) to the new version (green). Rollback is instant: flip traffic back. The cost is doubled infrastructure during the transition window.
-
Canary deployment: A small percentage of traffic (typically 1–10%) routes to the new model version while the majority continues on the stable version. Metrics are compared between cohorts. If the canary degrades, traffic shifts back automatically. This is the most common pattern for model updates because it limits blast radius while gathering real traffic signal.
-
Rolling update: Pods running the old version are replaced incrementally with pods running the new version. No traffic splitting logic required; Kubernetes handles pod replacement. Simpler than canary but offers less control over the traffic ratio during rollout.
-
Shadow deployment: The new model receives a copy of live traffic but its responses are discarded. This lets you compare output quality and latency between versions without any user impact. Expensive in compute but invaluable before a major model version change.
-
A/B deployment: Traffic is split by user segment or feature flag rather than by percentage. Useful when you want to measure business metrics (click-through rate, conversion) rather than just technical metrics. Requires a feature flagging system integrated with your serving layer.
Deployment checklist for model updates:
- Staging environment tested with production-parity data and the same container image
- Automated validation metrics pass (latency p99, error rate, output quality score) before promotion
- Rollback threshold defined: if p99 latency increases by more than X% or error rate exceeds Y%, trigger automatic rollback
- Governance approval recorded in the model registry (who approved, which version, what evaluation passed)
- Canary traffic percentage and observation window documented in the deployment manifest
A compact Kubernetes traffic-splitting example using KServe's InferenceService with canary:
apiVersion: serving.kserve.io/v1beta1
kind: InferenceService
metadata:
  name: my-model
spec:
  predictor:
    canaryTrafficPercent: 10
    model:
      modelFormat:
        name: pytorch
      storageUri: gs://my-bucket/models/v2
Adjust canaryTrafficPercent as confidence builds, then promote by setting it to 100.
For MLOps pipeline automation, integrating these deployment controls into your CI/CD pipeline means every model promotion is gated by automated tests, not manual judgment.
What should you monitor once a model is in production?
Standard infrastructure metrics (CPU, memory, pod restarts) tell you whether your containers are healthy. They don't tell you whether your model is producing correct outputs. A model can show healthy server metrics while generating incorrect or hallucinatory outputs, which means observability for serving infrastructure must go deeper than the infra layer.
Infrastructure-level metrics:
- Latency: p50, p95, and p99 response times per model version and endpoint
- Throughput: requests per second, tokens per second for LLMs
- Error rate: HTTP 4xx (client errors, schema violations) and 5xx (model errors, OOM) separately
- Queue depth: pending requests in the async queue; a leading indicator of capacity pressure
- Cold-start time: time from pod schedule to first successful inference; critical for scale-to-zero deployments
Model-level metrics:
- Output quality checks: schema validation, confidence score distributions, output length distributions
- Data drift: statistical distance between incoming feature distributions and training distributions (PSI, KL divergence, Wasserstein distance)
- Concept drift: degradation in downstream business metrics correlated with model outputs
- KV cache utilization: for LLMs, cache hit rate directly affects cost and latency
Suggested alert thresholds (adjust to your SLA):
- p99 latency exceeds 2× the baseline rolling average for more than 5 minutes
- Error rate exceeds 1% over a 5-minute window
- Input schema validation errors spike above 0.1% of requests (signals upstream data pipeline change)
- Drift score (PSI) exceeds 0.2 on any top-10 feature
Governance hooks:
- Log every request/response pair with a configurable sampling rate; store in an append-only store for audit trails
- Record model version, feature snapshot, and prediction in a lineage table for explainability queries
- Require model registry metadata (training data version, evaluation scores, approver) to be populated before a version is eligible for production promotion
- For regulated industries (FINRA-governed financial models, HIPAA-covered health applications), payload logging policies and data retention rules must align with sectoral requirements
Mlflow's AI observability layer provides deep tracing for agentic reasoning, LLM-as-a-Judge automated evaluation, and structured logging that connects production behavior back to the experiment that produced the model.
What security and compliance controls does production serving require?
Security in model serving is not a separate concern you add at the end. It's a set of controls that must be designed into the stack from the first deployment.
Network and transport security:
- TLS on all external endpoints; mTLS between internal services where the threat model warrants it
- Network segmentation: model serving pods in a dedicated namespace with ingress rules that allow only the API gateway
- API gateway enforces authentication (OAuth2/OIDC, API keys) and rate limiting before any request reaches the model
Secrets and access control:
- Model store credentials (S3, GCS, Azure Blob) managed via Vault or Kubernetes Secrets with automatic rotation
- Least-privilege IAM roles for serving pods: read-only access to the model artifact bucket, no write access to training data
- Audit logs for all model registry access and deployment approvals
Data protection:
- Encrypt model weights at rest and in transit
- PII handling policy for request/response logs: mask or tokenize sensitive fields before writing to log storage
- Define retention periods for payload logs; align with your organization's data governance policy and any applicable sectoral rules (HIPAA for health data, FINRA for financial model outputs)
Pro Tip: Run a threat model specifically against your model registry access path. The registry is the highest-value target in a serving stack: compromising it lets an attacker swap model weights silently. Treat registry write access with the same rigor as production database write access.
Production readiness security checklist:
- TLS certificates auto-renewed (cert-manager or equivalent)
- API authentication enforced at the gateway layer, not inside the model container
- Rate limiting configured per API key and per IP
- Secrets rotation policy documented and tested
- Network policies deny all ingress to serving pods except from the gateway namespace
- Payload logging PII masking verified with a sample of real request shapes
How do you optimize performance and control costs?
GPU serving is expensive. The gap between a well-optimized serving stack and a naive one can be a 3–5× difference in cost for the same throughput, without any change to the model itself.
Rules of thumb
-
Batch before you scale. Dynamic batching groups concurrent requests into a single forward pass. For transformer models, a batch of 8 requests costs roughly the same GPU time as a batch of 1. Enable dynamic batching in your serving runtime before adding more GPU replicas.
-
Quantize before you upgrade hardware. INT8 quantization typically reduces model memory footprint by 50% and increases throughput by 30–60% with minimal accuracy loss on most production models. Try quantization before provisioning a larger GPU instance.
-
Scale to zero for non-critical endpoints. Endpoints that receive traffic only during business hours or in response to batch triggers don't need to hold a GPU 24/7. KServe and similar Kubernetes-native platforms support scale-to-zero with KEDA-based autoscaling on request queue depth.
-
Use dedicated endpoints for high-traffic models. Shared multi-tenant endpoints reduce cost at low traffic but introduce noisy-neighbor latency at high concurrency. Once a model exceeds roughly 100 requests per minute sustained, a dedicated endpoint typically pays for itself in SLA reliability.
-
Plan for 2–3× capacity during peak traffic. LLM workloads in particular have spiky concurrency patterns. Autoscaling reacts to load; it doesn't prevent the latency spike during the scale-up window. A standing capacity buffer absorbs the spike while new pods warm up.
Optimization tactics:
- Continuous batching (vLLM, TensorRT-LLM): process requests as they arrive rather than waiting for a fixed batch window; dramatically improves GPU utilization for LLM workloads
- KV-cache strategies: maximize cache hit rate by routing requests with similar prefixes to the same replica (cache-aware routing); KServe's llm-d integration supports this natively
- Model distillation: replace a large model with a smaller distilled version for latency-critical paths where the accuracy tradeoff is acceptable
- Async pipelines: offload preprocessing and postprocessing to CPU workers so GPU time is spent exclusively on the forward pass
- Spot GPU instances: acceptable for batch workloads and shadow deployments; not appropriate for synchronous user-facing APIs without a fallback to on-demand capacity
Capacity planning checklist:
- Baseline p99 latency and throughput measured under realistic concurrency
- Peak traffic multiplier estimated from historical patterns (or assumed at 3× for new services)
- Autoscaling policy tested: scale-up time measured from zero to full capacity
- Cost per 1,000 requests calculated for GPU vs CPU serving at target concurrency
- Quantization and batching evaluated before any hardware upgrade decision
For optimizing model serving in practice, the most reliable path is to instrument first, then optimize. Guessing at bottlenecks without latency histograms and GPU utilization data wastes engineering time.
How does Mlflow map to model serving infrastructure needs?
Mlflow isn't a serving runtime in the same sense as Triton or vLLM. It's the lifecycle and observability layer that connects model development to production serving, and that distinction matters operationally.
Model registry as the serving handoff point:
- Every model version in the Mlflow registry carries training metadata, evaluation scores, and lineage back to the experiment run that produced it
- Serving runtimes pull artifacts from the registry by version alias (e.g.,
@champion,@staging), which decouples the serving configuration from the artifact path - Promotion workflows (staging → production) are gated by evaluation criteria recorded in the registry, not by manual file copies
Observability and evaluation hooks:
- Mlflow's tracing layer captures agentic reasoning traces, LLM token-level telemetry, and sub-agent interactions in a structured format that maps directly to the observability metrics described earlier in this guide
- The LLM-as-a-Judge evaluation framework automates output quality assessment, which is the hardest part of the model-level monitoring described above
- Evaluation results feed back into the registry, so every production version has a documented quality baseline
CI/CD and agent deployment integration:
- Mlflow integrates with standard CI/CD systems to automate the evaluate → register → promote → deploy flow
- For agent workloads, Mlflow's agent server deployment capability handles the orchestration of multi-step reasoning pipelines as first-class serving objects, not just single-model endpoints
- The AI Gateway provides centralized prompt management and cross-provider governance, which is the control plane for LLM serving across multiple model providers
Where Mlflow fits in your stack:
- Use Mlflow as the model registry and lifecycle anchor regardless of which serving runtime you deploy to
- Use Mlflow's GenAI and agent engineering capabilities when your serving workload involves LLMs, agents, or multi-step reasoning pipelines
- Use Mlflow's observability layer to close the feedback loop between production behavior and the next training iteration
The first 90 days of running a serving system: a practitioner's perspective
Most teams spend their first 90 days firefighting issues that were predictable. Here's what we'd prioritize differently.
Instrument before you optimize. The first week should produce a latency histogram and an error rate dashboard, not a performance tuning sprint. You can't optimize what you haven't measured, and the bottleneck is almost never where you expect it.
Automate rollback before you automate rollout. It's tempting to build a slick CI/CD promotion pipeline first. Build the rollback trigger first. A broken model in production that takes 45 minutes to roll back manually is a worse outcome than a slow promotion pipeline.
Accept imperfect drift detection early. A simple statistical test on input feature distributions is better than nothing, even if it generates some false positives. Tune the thresholds over the first month as you learn your traffic patterns. Don't wait for a perfect drift detection system before shipping.
90-day operational ramp checklist:
- Week 1: Latency p50/p95/p99 and error rate dashboards live; alerting on p99 and error rate
- Week 2: Staging environment at production parity (same container, same hardware class); smoke tests automated
- Week 3: Rollback procedure documented and tested; rollback time measured
- Week 4: Canary deployment pattern in place for all model updates
- Month 2: Input drift monitoring on top-10 features; output schema validation on every response
- Month 3: Capacity buffer sized from real traffic data; autoscaling policy validated under load test
The teams that operate serving infrastructure well aren't the ones with the most sophisticated stack. They're the ones who know exactly what their system is doing at any given moment and can change it safely.
Mlflow gives you the observability layer your serving stack is missing
The serving runtimes covered in this guide handle inference execution well. What most of them don't provide is a unified view of model quality, lineage, and agent behavior across your entire production fleet.

Mlflow connects the model registry, evaluation pipeline, and production observability into a single platform. You get structured tracing for LLM and agent workloads, automated LLM-as-a-Judge quality scoring, and a centralized AI Gateway for cross-provider prompt governance. Every production model version carries a documented quality baseline, and every serving decision traces back to the experiment that justified it. For teams moving from prototype to production on GenAI or agent workloads, that lifecycle continuity is what separates a fragile demo from a system you can actually operate. Explore Mlflow's AI observability and agent engineering capabilities and see how it integrates with your existing serving infrastructure.
Sources
- What is Model Serving? Deploying AI Models That Work at Scale
- ai-model-serving-architecture-building-scalable-inference-apis-for-production-applications
- KServe
- TensorFlow Serving guide
- TorchServe