ML Pipeline Orchestration: A Practical Guide for Engineers

ML pipeline orchestration is defined as the automated coordination of machine learning workflow stages, structured as a Directed Acyclic Graph (DAG) to manage task dependencies, retries, and scheduling across diverse environments. In practice, this means every stage of your ML workflow, from data ingestion and feature engineering through model training, validation, and deployment, runs in a controlled, repeatable sequence without manual intervention. Tools like Kubeflow Pipelines, MLFlowX, and Rivers each implement this coordination differently, but all share the same goal: reproducible, scalable AI model development. Understanding what is ML pipeline orchestration is the first step toward building production-grade workflows that hold up under real operational pressure.
What is ML pipeline orchestration and how does it work?
ML pipeline orchestration works by representing your workflow as a DAG of tasks, where each node is a discrete component and each edge defines a dependency. The orchestration backend reads this graph, resolves execution order, and launches tasks in the correct sequence, running independent steps in parallel when possible. This architecture is what separates orchestrated pipelines from ad hoc scripts: the system, not the engineer, manages execution logic.
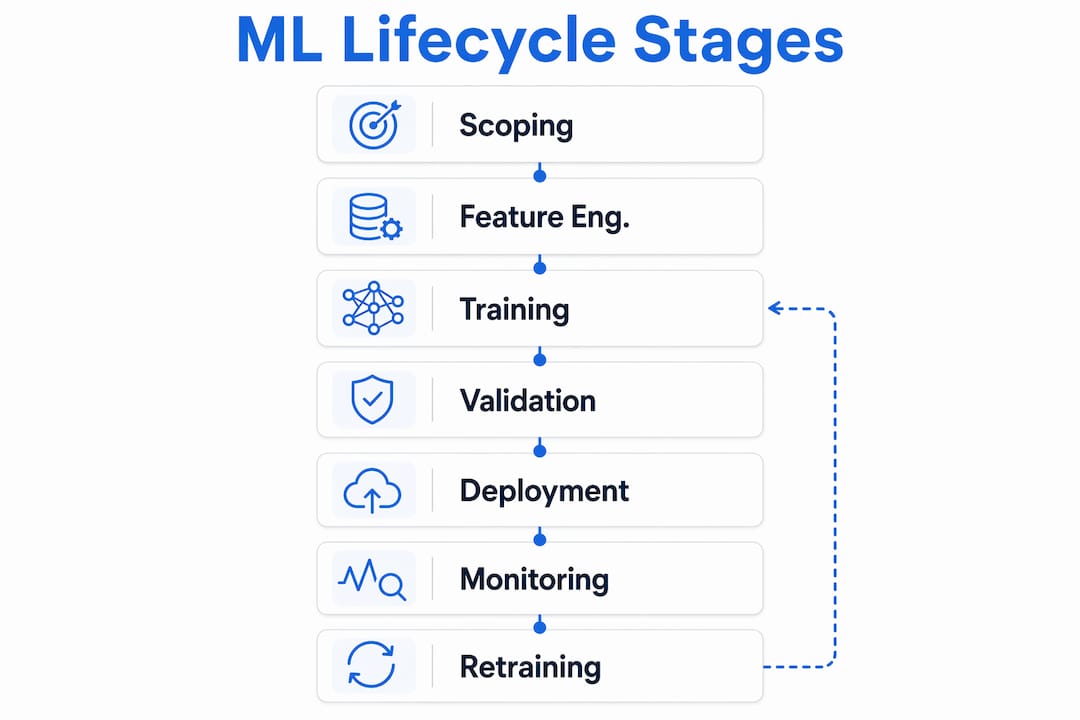
The core workflow components in any orchestrated ML pipeline follow a consistent pattern:
- Data ingestion: Pull raw data from storage systems like Amazon S3, Google Cloud Storage, or a feature store.
- Feature engineering: Transform and preprocess data, applying scaling, encoding, or embedding generation.
- Model training: Execute training runs with frameworks like PyTorch, scikit-learn, or Hugging Face Transformers.
- Validation: Evaluate model performance against held-out data and defined thresholds.
- Deployment: Push validated models to a serving endpoint or model registry.
- Monitoring: Track live model behavior and trigger retraining when drift is detected.
The orchestration backend handles more than just execution order. Kubeflow Pipelines runs each task in an isolated Kubernetes Pod, managing environment variables, resource allocation, and automatic retries on failure. Caching is built in, so a step that already ran successfully with the same inputs is skipped on re-execution. This saves significant compute time during iterative development.
Passing data between steps deserves special attention. Artifacts, not raw data, should flow between containers. An artifact is a typed, versioned object, such as a dataset, a trained model, or a set of evaluation metrics. Passing artifacts rather than raw file paths gives the orchestrator full lineage tracking, which is the foundation of reproducibility.
Pro Tip: Design each pipeline component to accept and emit typed artifacts from the start. Retrofitting artifact passing onto a pipeline that was built around raw file paths is painful and error-prone.
How do leading pipeline orchestration tools compare?
Choosing the right tool for ML workflow management depends on your infrastructure constraints, team size, and how much complexity you can absorb. The table below summarizes the key attributes of three widely used options.
| Tool | Architecture | Framework support | Complexity | Best for |
|---|---|---|---|---|
| Kubeflow Pipelines | Kubernetes-native DAG | PyTorch, TensorFlow, scikit-learn | High | Large-scale, multi-team production environments |
| MLFlowX | Lightweight, plugin-based | Multiple libraries, YAML-first config | Low | Smaller teams needing fast iteration |
| Rivers | Rust execution backend, Python API | Python-native asset functions | Medium | High-performance, asset-centric workflows |
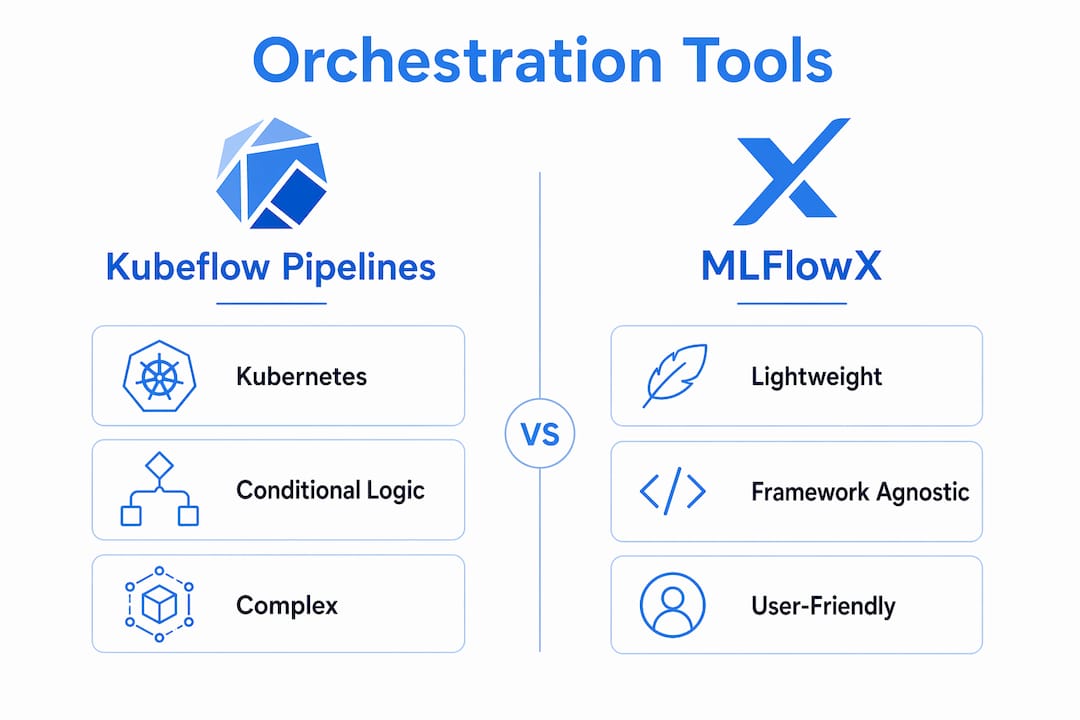
Kubeflow Pipelines is the most mature option for teams already running Kubernetes. It provides conditional logic, exit handlers, and parallel and conditional execution out of the box. The trade-off is infrastructure overhead: you need a functioning Kubernetes cluster and familiarity with container orchestration before you write a single pipeline step.
MLFlowX takes a different approach. It is a lightweight, framework-agnostic toolkit that integrates DAG execution with unified experiment tracking in a single package. Its YAML-first configuration and extensible plugin architecture mean you can add support for new ML libraries without forking the core codebase. For teams that want orchestration without the Kubernetes tax, MLFlowX is a practical starting point.
Rivers is the most architecturally interesting of the three. It resolves data assets as Python functions with a native Rust execution backend, achieving sub-millisecond planning on large DAGs. The Python API stays clean and readable while the execution layer handles performance. This separation of API surface from execution backend is a design pattern worth understanding regardless of which tool you ultimately choose.
Key differentiators to evaluate before committing to a tool:
- Experiment tracking integration: Does the tool log metrics, parameters, and artifacts natively, or do you need to wire in a separate system?
- Scheduling and triggering: Can you trigger runs on a cron schedule, on data arrival, or based on upstream pipeline completion?
- UI and observability: Does the tool provide a dashboard for comparing runs and inspecting lineage?
- Community and extensibility: Is there an active open-source community maintaining the project?
Pro Tip: Before evaluating any orchestration tool, write down the three most painful manual steps in your current workflow. The right tool is the one that eliminates all three, not the one with the longest feature list.
What are advanced orchestration concepts worth knowing?
Standard task-based orchestration gets most teams to production. But as your pipelines grow in complexity and your data volumes increase, three advanced concepts become critical: data-centric policies, asset-based orchestration, and modular component design.
Data-centric orchestration and selective retraining
Most teams retrain models from scratch on every data update. This is expensive and often unnecessary. Data-centric orchestration policies, as demonstrated by the Modyn platform, apply selective retraining triggers that evaluate whether new data is sufficiently different to justify a full retraining run. The result is maintained model accuracy with significantly less compute overhead. Modyn's research shows that intelligent data selection and triggering minimizes unnecessary retraining while keeping models current.
"Advanced orchestration avoids retraining models from scratch on every data update by applying data-centric policies for efficient model updates." — Modyn platform research
Asset-based orchestration
Asset-based orchestration treats data assets and model artifacts as first-class citizens in the pipeline graph, not just outputs of tasks. Rivers implements this pattern by resolving assets as Python functions with dependency declarations. When an upstream asset changes, only the downstream assets that depend on it are recomputed. This is a meaningful improvement over task-driven models, where the entire pipeline reruns regardless of what actually changed.
The practical benefits of asset-based design include:
- Faster iteration cycles because unchanged assets are cached and reused
- Cleaner dependency graphs that are easier to reason about and debug
- Better lineage tracking because every asset has a defined provenance
Modular, containerized components
Component reuse across projects reduces redundant engineering effort significantly. A containerized preprocessing component built for one project can be pulled into another pipeline with a single reference. This only works if components have well-defined input and output specifications and carry no hidden state. Containerization enforces this discipline by isolating each component's runtime environment.

What are best practices for ML orchestration design?
Building a pipeline that works in development is straightforward. Building one that holds up in production, across team members, over months of data drift and model updates, requires deliberate design choices.
- Define clear task boundaries. Each component should do exactly one thing. A component that preprocesses data and trains a model is two components that haven't been separated yet.
- Version everything. Artifacts, pipeline definitions, and environment configurations should all be versioned. This is the only way to reproduce a specific run six months later.
- Use caching aggressively. Most orchestration tools support step-level caching. Enable it by default and disable it only for steps where fresh execution is explicitly required.
- Implement automated retries with backoff. Transient failures in cloud environments are common. Configure retries at the task level rather than rerunning entire pipelines manually.
- Centralize experiment tracking. Logging metrics and artifacts to a unified system like Mlflow's experiment tracking gives you a single source of truth for comparing runs across pipeline versions.
- Set intelligent triggering policies. Running a full retraining pipeline on a fixed daily schedule regardless of data volume is wasteful. Trigger-based policies that respond to data arrival or drift detection are more efficient.
Monitoring deserves its own emphasis. A pipeline that deploys a model without tracking its live behavior is incomplete. Production observability practices should be built into the pipeline design from day one, not added after the first production incident.
Pro Tip: The most common orchestration failure we see is pipelines that pass file paths between steps instead of typed artifacts. When a file path breaks, you get a cryptic error at runtime. When an artifact type mismatches, you get a clear error at pipeline definition time.
Key takeaways
ML pipeline orchestration is the foundation of reproducible, production-grade machine learning: without it, every deployment is a manual, error-prone process that doesn't scale.
| Point | Details |
|---|---|
| DAG-based execution | Pipelines defined as DAGs manage task dependencies, parallel execution, and retries automatically. |
| Artifact passing is critical | Passing typed artifacts between steps, not raw file paths, enables lineage tracking and reproducibility. |
| Tool selection depends on scale | Kubeflow Pipelines suits large Kubernetes environments; MLFlowX and Rivers fit smaller or performance-focused teams. |
| Data-centric policies save compute | Selective retraining triggers from platforms like Modyn reduce overhead while maintaining model accuracy. |
| Unified tracking is non-negotiable | Centralizing metrics and artifact logging within orchestration prevents fragmented experiment records. |
My take on where orchestration is actually headed
The conversation in most teams I've observed still centers on "which tool should we use." That's the wrong question to start with. The right question is "what does our pipeline need to guarantee." Reproducibility is the answer almost every time. Once you commit to that, the tool choice follows naturally from your infrastructure constraints.
What I find underappreciated is the shift toward asset-based orchestration. Task-driven pipelines are intuitive because they mirror how engineers think about code: do this, then do that. But assets are how data scientists actually think about their work. A trained model is an asset. A feature table is an asset. Designing pipelines around assets rather than tasks produces graphs that are easier to explain to stakeholders and easier to maintain over time.
The data-centric retraining angle is also more important than most teams realize. I've watched teams burn significant GPU budget retraining models daily on data that barely changed. Intelligent triggering policies are not a nice-to-have. They are the difference between an ML platform that scales and one that becomes a cost center.
My honest recommendation: start with the lightest orchestration tool that meets your current needs. Migrate to heavier infrastructure only when you hit a concrete limitation. Complexity introduced too early creates maintenance burden without delivering value. Modular, well-specified components and unified experiment tracking will serve you better than any specific tool choice.
— Kevin
How Mlflow supports your orchestration workflows
Mlflow is built for teams that need more than a task runner. It provides DAG-based pipeline management alongside production-grade experiment tracking, artifact logging, and model serving in a single open-source platform.
Mlflow integrates with PyTorch, scikit-learn, Hugging Face, and other major ML frameworks without requiring you to rewrite your existing code. Its plugin architecture means you can extend it to fit your specific infrastructure. For teams building GenAI and LLM workflows, Mlflow's agent engineering platform adds deep tracing, LLM-as-a-Judge evaluation, and a centralized AI Gateway on top of the core orchestration layer. Explore the Mlflow Cookbook for practical, hands-on implementation guides that take you from pipeline definition to production deployment.
FAQ
What is ML pipeline orchestration in simple terms?
ML pipeline orchestration is the automated management of machine learning workflow stages, structured as a DAG that handles task dependencies, retries, and scheduling without manual intervention.
How does ML pipeline orchestration differ from workflow orchestration?
ML pipeline orchestration is a specialized form of workflow orchestration focused on ML-specific tasks like model training, artifact management, and experiment tracking, rather than general business process automation.
What tools are used for pipeline orchestration in machine learning?
Kubeflow Pipelines, MLFlowX, and Rivers are three widely used pipeline orchestration tools, each suited to different infrastructure scales and team requirements.
Why is artifact passing important in orchestrated ML pipelines?
Passing typed artifacts between pipeline steps, rather than raw file paths, enables full lineage tracking and reproducibility, which are the core guarantees that make orchestration valuable in production.
What is data-centric orchestration?
Data-centric orchestration applies intelligent triggering policies, as demonstrated by the Modyn platform, to decide when retraining is actually necessary, reducing compute cost while maintaining model accuracy.