Sampling Strategies for Distributed Systems Observability

The most practical default for production systems is hybrid sampling: a lightweight head-based baseline that protects your pipeline, combined with tail-based or adaptive policies that catch errors, slow requests, and rare operations. Skip sampling entirely if your volume is low, retention rules demand full capture, or you're tracing LLM and agent calls. Otherwise, start with the OpenTelemetry Collector and its tail_sampling and probabilistic processors.
TL;DR:
- Sampling should be used primarily when trace volume exceeds a few hundred per second, especially for cost and capacity management.
- Tail-based sampling offers higher accuracy for errors, latency thresholds, and rare operations but requires stateful infrastructure to ensure consistent trace decisions.
- Head-based sampling is cost-effective and stateless but can result in biases and misses of important signals if not carefully tuned per-service.
- Combining head and tail sampling in a hybrid architecture balances capacity protection with data fidelity, with dynamic adjustment to prevent buffer overloads.
- For agentic workloads and AI models, full fidelity tracing is crucial, and tools like Mlflow are designed to capture deep reasoning chains without sampling bias.
Table of Contents
- What Do Head-Based and Tail-Based Sampling Actually Mean?
- When Should You Sample Observability Data at All?
- How Does Head-Based Sampling Work in Practice?
- When Does Tail-Based Sampling Make Sense?
- Which Sampling Policy Type Fits Your Workload?
- How Do Hybrid Architectures Balance Cost and Coverage?
- What Does a Working OpenTelemetry Collector Config Look Like?
- Why Do LLM and Agent Workloads Need a Different Sampling Approach?
- What Should You Do Next?
- Where This Framework Falls Short in Practice
- See High-Fidelity Agent Tracing in Action
- Sources
What Do Head-Based and Tail-Based Sampling Actually Mean?
Before you configure anything, your team needs to agree on what these terms mean. Misaligned vocabulary is how "we sample 10%" turns into three different implementations across three services.
- Sampled flag: a bit in the trace context (the W3C
traceparentheader) that tells downstream services whether a trace was selected for export. - Head-based sampling: the keep/drop decision happens at trace start, before you know how the request turns out.
- Tail-based sampling: the decision waits until the trace completes, so you can judge it by latency, errors, or span count.
- Consistent (deterministic) sampling: every service reaches the same decision independently, usually by hashing the trace ID, so a trace doesn't get half kept and half dropped.
- Exemplars: individual sampled traces attached to a metric data point, letting you jump from an aggregate number straight into a real request.
Standardized schemas, like the Simple Schema for Observability, give these fields consistent names across services, which matters more than it sounds once sampling rules start referencing specific attributes.
When Should You Sample Observability Data at All?
Sampling exists to solve a cost and capacity problem, not a philosophical one. Once ingestion, indexing, or query load starts choking under full trace volume, or your storage bill outpaces the value of the data, sampling becomes the pragmatic move.
A rough operational threshold: systems pushing more than a few hundred traces per second typically need some form of sampling to keep collector memory and downstream indexing manageable. Below that, many teams run full capture without issue.
Three costs come with any sampling strategy, and teams often only budget for the first one:
- Compute cost: running tail processors, buffering spans, and evaluating policies consumes CPU and RAM in the collector tier.
- Maintenance cost: policies drift out of sync with your actual traffic patterns unless someone owns them.
- Missed-signal cost: the incident you can't debug because the one relevant trace got dropped by a probabilistic rule.
A few situations override the cost argument entirely; for example, you can streamline security monitoring and automation for compliance in regulated environments. Regulatory retention requirements (financial audit trails, healthcare logs) often mandate full or near-full capture regardless of volume. LLM and agent calls carry similar logic, since each output can be non-reproducible in a way a typical HTTP request isn't. When sampling doesn't fit, consider aggregation, pre-aggregation at the edge, or routing raw data to cheaper cold storage instead of cutting volume outright.
How Does Head-Based Sampling Work in Practice?
Head sampling makes its call at the start of a trace, using no knowledge of how the request ends. That's its strength (cheap, stateless, easy to reason about) and its weakness (blind to outcome).
- Deterministic hashing: OpenTelemetry's
TraceIdRatioBasedsampler hashes the trace ID to decide inclusion, so the same trace ID always produces the same decision, even across independent collector instances. - SDK-side vs. collector-side: SDK-side sampling drops the decision before any spans leave the process, saving network bandwidth; collector-side probabilistic sampling lets you centralize policy changes without redeploying every service.
- Per-service rates: a checkout service generating 50 requests per second might run at 100% capture, while a high-traffic search endpoint at 20,000 requests per second might sample at 1% or lower.
The limitation is structural, not tunable.
Pro Tip: Set head sampling rates per-service, not globally. A single global rate either drowns your low-traffic services in near-zero capture or floods your high-traffic ones with unnecessary volume.
When Does Tail-Based Sampling Make Sense?
Tail sampling waits for a trace to finish, then applies rules that head sampling can't: keep all errors, keep anything above a latency threshold, keep rare operation types, and drop the rest at a much lower probabilistic rate. That ordering matters. Specific rules need to run before the generic fallback, or a boring probabilistic policy will silently discard traces your error policy was supposed to catch.
Running this requires a stateful architecture. Spans belonging to the same trace need to land on the same collector instance, which is why production setups typically add a loadbalancingexporter upstream to route consistently by trace ID before the buffering, decision-making processor ever sees the data.
Three configuration knobs control both accuracy and memory footprint:
| Parameter | What it controls | Typical impact |
|---|---|---|
decision_wait | How long the collector waits before deciding | Longer waits catch late spans but hold more traces in memory |
num_traces | Maximum traces held in the buffer at once | Directly drives RAM usage |
expected_new_traces_per_sec | Expected incoming trace rate, used for buffer pre-allocation | Set too low, and the collector reallocates memory under load |
Get the buffer sizing wrong and you hit one of two failure modes. A full buffer forces the collector to either drop new traces outright or fall back to a crude probabilistic decision, undermining the whole point of tail sampling. Late-arriving spans, common with asynchronous or long-running operations, can also miss the decision window entirely if decision_wait is set too tight, as The New Stack details in its breakdown of tail sampling tradeoffs.
Which Sampling Policy Type Fits Your Workload?
Four policy types cover almost every production case, and most mature setups run more than one at once, layered by priority.
- Probabilistic: keeps a fixed percentage of traces at random. Simple, cheap, statistically representative for aggregate latency numbers, but blind to individual importance.
- Fixed-rate: caps throughput to a set number of traces per second regardless of total volume. Useful for capping collector load during traffic spikes, less useful for guaranteeing you catch specific events.
- Rate-limiting: similar to fixed-rate but typically scoped per operation or per service, preventing one noisy endpoint from starving the sampling budget for everything else.
- Adaptive: adjusts the sampling rate automatically based on current conditions, often ramping up during incidents and back down once things stabilize.
A policy stack that works well in practice runs errors first, then slow traces above a latency threshold, then rare or low-frequency operations, with probabilistic sampling as the catch-all fallback for everything else. Measuring whether it's working means tracking recall on known incidents (did the sampler keep the traces that mattered), coverage across service and operation types, and watching for sample bias, where your kept traces stop reflecting real traffic patterns because non-uniform rates weren't corrected in your dashboards.
How Do Hybrid Architectures Balance Cost and Coverage?
The two-stage pattern is the one worth defaulting to: head sampling at the source keeps ingestion volume within budget, and tail sampling downstream, in a buffered collector tier, recovers the traces that actually matter. Head sampling protects capacity; tail sampling recovers what a flat head rate would have thrown away, which is exactly the tradeoff documented as the pragmatic hybrid default in production tracing setups.
Tuning the head baseline matters as much as the tail policy itself. If the head rate is too aggressive, you starve the tail sampler of the raw material it needs, since a trace dropped at the source never reaches the buffer to be evaluated at all. Dynamic rate control, adjusting the head baseline based on current tail sampler load, keeps that pipeline healthy without manual intervention every time traffic shifts.
Operating this reliably means watching a specific set of signals:
- Buffer utilization: how full the tail sampler's trace buffer is relative to
num_traces. - traces_in_buffer: current count, useful for spotting slow leaks before they become outages.
- decisions_per_sec: throughput of the decision engine itself.
- dropped_traces: the number that never made it past a full buffer, your canary for undersized capacity.
Pro Tip: Keep your head baseline high enough that it still produces a statistically meaningful sample on its own. If you ever need to reconstruct overall latency distributions without the tail sampler's bias, that baseline is your fallback.
What Does a Working OpenTelemetry Collector Config Look Like?
A tail_sampling processor configuration in the OpenTelemetry Collector typically layers policies by priority, something like errors first, then latency, then a probabilistic fallback, each with its own type and parameters. The processor evaluates policies top to bottom, and the first matching policy determines the outcome for that trace.
Combine AlwaysOn SDKs (full capture at the instrumentation layer) with collector-side probabilistic sampling when you want simple, centralized rate control without touching every service's code. This pattern is common precisely because it lets platform teams change sampling behavior without a redeploy.
Sizing the buffer comes down to one calculation: num_traces × average_trace_size ≈ approximate RAM required. A collector holding 50,000 traces at an average size of 20 KB needs roughly 1 GB just for the trace buffer, before accounting for processing overhead.
| Input | Example value | Resulting estimate |
|---|---|---|
| num_traces | 50,000 | Buffer capacity |
| avg_trace_size | 20 KB | Per-trace memory cost |
| Approximate RAM | ~1 GB | Buffer memory floor |
Picking decision_wait means balancing completeness against memory pressure. Most services with request durations under a few seconds do fine with a wait of 10 to 30 seconds; longer-running async workflows need more, at the cost of a larger buffer. For anything dropped by sampling that you might need later for forensic or compliance review, route the raw, unsampled stream to cold object storage rather than discarding it outright, a pattern that pairs well with OpenTelemetry's native tracing support in MLflow.
Why Do LLM and Agent Workloads Need a Different Sampling Approach?
A dropped HTTP request trace is a minor loss. A dropped trace from an autonomous agent making a chain of tool calls and reasoning steps can be the only record of why the agent did what it did, since the same prompt rarely produces an identical output twice. That non-reproducibility is the core reason aggressive probabilistic sampling, fine for a login endpoint, is the wrong default for agentic workloads.
Mlflow approaches this by supporting high-fidelity tracing purpose-built for agentic reasoning, capturing the full chain of tool calls, intermediate steps, and model outputs rather than a probabilistic slice of them:
- Deep tracing designed around agent reasoning chains, not generic request/response spans.
- Automated evaluation through LLM-as-a-Judge scoring layered on top of captured traces.
- A centralized gateway for prompt management across providers, so sampling and evaluation policy stay consistent regardless of which model served the request.
Teams applying the hybrid principles above to LLM traffic should read Mlflow's guidance on monitoring agentic AI in production before defaulting to the same sampling math they use for web services.
What Should You Do Next?
Start by measuring your actual trace volume and cost pressure. Pick a head baseline that fits your budget, layer tail rules on top for errors, slow traces, and rare operations, then monitor buffer health and dropped_traces to catch sizing mistakes early. Reserve full-fidelity capture and cold storage for anything regulatory, forensic, or agent-generated, where a missing trace isn't just noise.
Where This Framework Falls Short in Practice
Most sampling guides treat the decision as purely mathematical: pick a percentage, apply it, move on. That's backwards. The real failure mode isn't picking the wrong sampling rate, it's picking a rate before anyone has looked at what "interesting" means for their specific system.
I'd argue the industry's obsession with probabilistic sampling as a starting point is misplaced. A flat percentage answers a question nobody asked: "what does average traffic look like?" Engineers debugging production incidents don't care about average traffic. They care about the one trace where the payment failed, or the one agent run where the reasoning chain went sideways. Tail-based policies, ordered so specific rules beat generic fallbacks, answer the question that actually matters, and teams that skip straight to probabilistic sampling because it's simpler to configure are optimizing for ease of setup over usefulness of data.
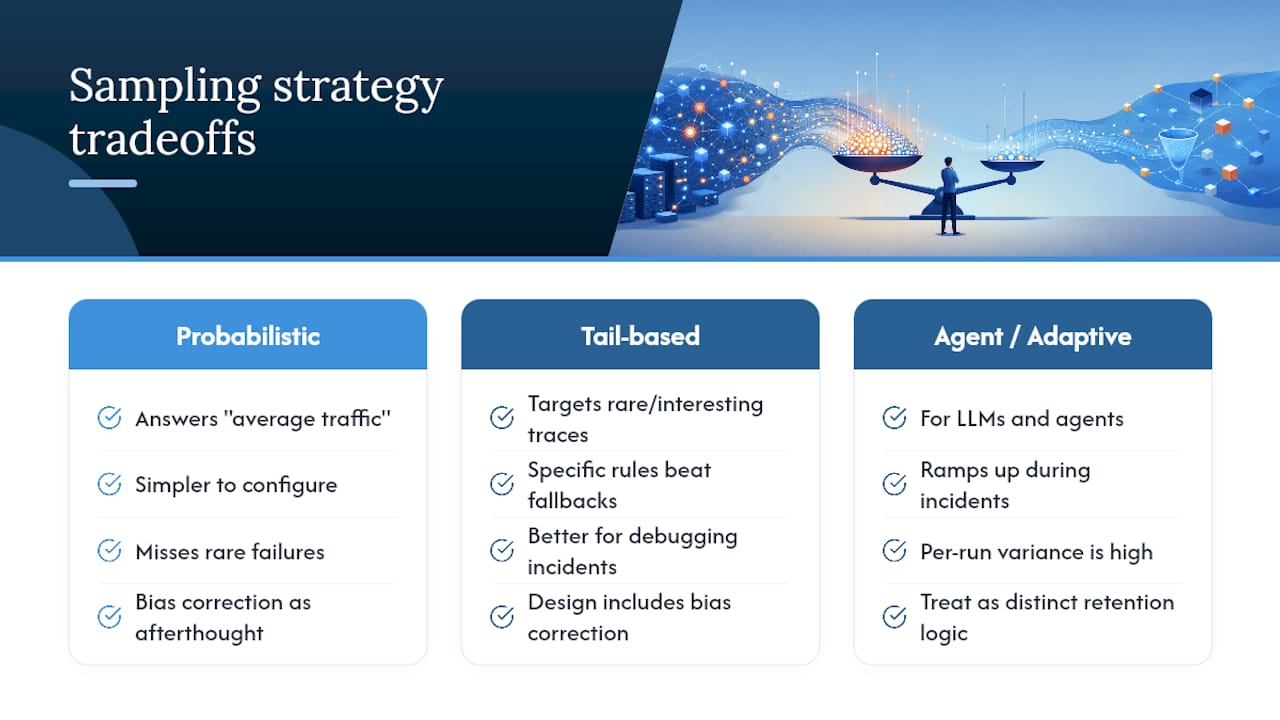
The other underrated point: sampling bias correction gets treated as an afterthought, something you fix later if dashboards look wrong. It should be part of the initial policy design.
For LLM and agent workloads, the calculus shifts even further. Adaptive sampling that ramps up during incidents helps with conventional services, but agent traces carry so much per-run variance that a "typical" run barely exists. That's the case for treating agent observability as a distinct category with its own retention logic, not a smaller version of the same web-service sampling playbook.
— Kevin
See High-Fidelity Agent Tracing in Action
If the hybrid strategy above sounds right for your web services but insufficient for your agent workloads, that gap is exactly what Mlflow's AI observability platform was built to close. Instead of forcing agentic reasoning chains through the same probabilistic sampling math designed for HTTP endpoints, Mlflow captures deep traces of tool calls, intermediate reasoning, and model outputs by default, then layers automated LLM-as-a-Judge evaluation on top so you're not just storing traces, you're scoring them.

For teams running production agents where a dropped trace means losing your only record of a non-reproducible decision, that's the difference between debugging with real data and debugging with guesses. Explore Mlflow's Agent and LLM Engineering platform and see how full-fidelity tracing works alongside your existing OpenTelemetry pipeline.
Sources
- Sampling | OpenTelemetry
- Trace Sampling Strategies — Head-Based, Tail-Based & Cost-Quality Tradeoff | Systems Explained
- Sampling: the philosopher's stone of distributed tracing - The New Stack
- Simple Schema for Observability (ss4o) — OpenSearch Docs