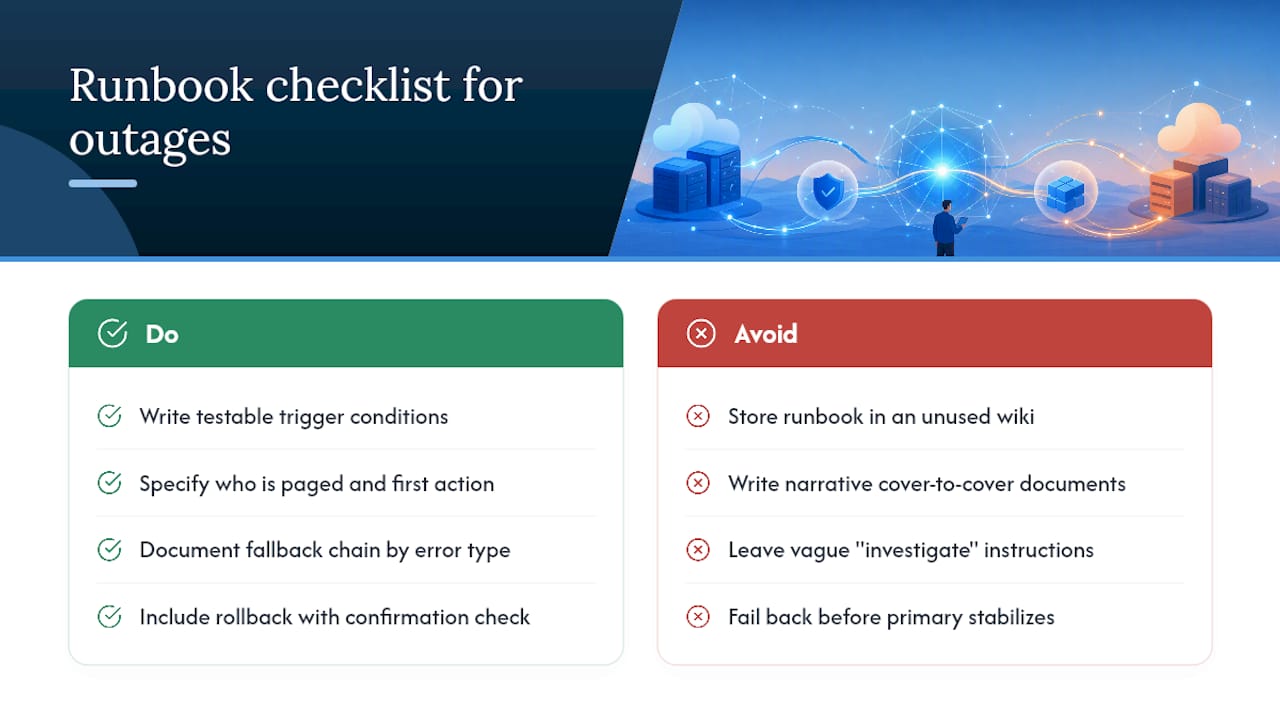
Provider Quota Management for LLM and Agent Apps

Provider quota management is the practice of keeping your LLM and agent traffic inside the limits your AI providers set on your account, while dividing that capacity fairly among your own users, apps, and workloads. Done well, it means no surprise 429s, no single batch job starving your real-time chat, and no monthly bill that nobody forecast. This guide covers how provider limits work, how to allocate them internally, what to do when you hit a ceiling, and how to monitor usage across several providers.
TL;DR
- Provider limits (requests, tokens, spend) are fixed by your account tier. Per-tenant quotas are your own design, enforced in your application or gateway.
- Treat a quota as three knobs: a token budget per window, a request rate, and a concurrency cap. Enforce tokens first and use requests as a guardrail.
- A temporary rate-limit 429 calls for backoff and pacing. A spend or credit error needs a change to the limit or balance, because retries will not fix it.
- Plan below 100% of provider limits, reconcile estimates against actual usage, and route all traffic through one place so you can see it.
Table of Contents
- What provider quota management actually covers
- How providers structure their limits
- Setting quotas across users, apps, and workloads
- Admission control: estimate, reserve, reconcile
- What to do when you approach a limit or get a 429
- Requesting higher limits
- Forecasting and monitoring across multiple providers
- Perspective: a gateway plus traces beats scattered counters
- Putting it together: a rollout plan
- Run provider access through one governed endpoint
- FAQ
- Sources
What provider quota management actually covers
The phrase gets used loosely, so start with a working vocabulary. A rate limit controls traffic over a short window, such as requests or tokens per minute. A quota controls allowed usage over a longer window, such as a daily or monthly allowance. A spend cap controls cost exposure in currency terms. Providers do not always use these words consistently: one may call a request-rate ceiling a "quota", and another may call a cost alert a "budget" even though it never stops spend. Before you classify any control, read its unit, its scope, its reset rule, and what happens when it is exhausted.
There are two layers to manage:
- Upstream provider limits. These cap what your API key can pull from the provider. Your tier and relationship with the provider fix them, and they protect the provider's infrastructure. When you exceed them, the provider returns a 429.
- Internal quotas. These are caps your own application enforces on what each customer, team, or feature can consume. They protect your unit economics and fairness, and they are entirely your design choice. When a tenant exceeds one, your system returns its own 429 or downgrades the request.
Provider limits are applied to your account as a shared pool. That is the core problem: if one component saturates the pool, everything else gets throttled with it, and the provider has no idea which of your customers or features caused it. Quota management is how you add that missing isolation.
How providers structure their limits
Limits vary by provider, by model, and by account tier, so you cannot plan from one provider's numbers.
OpenAI documents RPM, RPD, TPM, and TPD limits, plus modality-specific limits such as images per minute. Limits are scoped to the organization and project and vary by model, and some model families share a pool. OpenAI's usage tiers upgrade automatically as total credit purchases cross $5, $100, and $500 for the Build, Launch, and Grow tiers, which generally raises rate limits.
Anthropic measures requests per minute, input tokens per minute, and output tokens per minute. Exceeding any one can return a 429 that identifies which limiter you hit and includes a retry-after header. Its rate limits page lists per-model figures by tier, and they rise as you move up tiers.
Across vendors, you will see the same dimensions recombined in different ways: requests per minute, input and output tokens, total tokens, daily request caps that reset at a provider-defined time, concurrency, rolling spend windows, and acceleration limits that react to sharp traffic increases even when steady-state usage sits below the published number.

That last point matters in practice. Short bursts can trigger errors even when your averages look fine, because providers may enforce limits over shorter sub-intervals than the displayed window. A dashboard showing 60% of your per-minute limit does not prove you are safe.
A quick comparison of control types
| Control | Typical unit | Window | What it protects | What happens at the limit |
|---|---|---|---|---|
| Rate limit | Requests or tokens per minute | Seconds to minutes | Provider capacity | 429, retry later |
| Quota | Requests or tokens per day, credits | Daily, monthly, rolling | Provider allowance | Blocked until reset or raised |
| Spend cap | Currency | Billing period | Your budget | Requests rejected or alert only, depending on the provider |
| Internal tenant quota | Tokens, requests, concurrency | Your choice | Your margins and fairness | Your 429 or a downgrade |
Setting quotas across users, apps, and workloads
Once you know the ceiling, divide it. The most common design mistake is treating a per-tenant quota as one knob. It is at least three:
- Token budget: total tokens per time window. This is the natural unit of cost, because a single LLM request can cost anywhere from a few dozen tokens to six figures.
- Request rate: requests per minute, which guards against bursts even when a tenant is inside its token budget.
- Concurrency cap: simultaneous in-flight calls per tenant, which stops one tenant from eating the connection pool.
A tenant can stay within its token budget and still take down the system through concurrency, and it can stay within concurrency caps and still blow the monthly budget. The pragmatic pattern is token-based enforcement as the primary control, with request-based limits as a guardrail, because they catch different failure modes.
Isolate by workload class
Separate budgets for separate kinds of traffic is where quota management pays off most. A nightly evaluation run, a bulk summarization job, and a live agent conversation should not share one bucket. Give real-time traffic a protected allocation and let batch work use what is left, ideally through a queue.
A workable allocation for a shared provider limit might look like this:
- Reserve a slice for administrative traffic, health checks, and failover.
- Reserve a protected slice for interactive, user-facing requests.
- Split the remainder among teams or tenants by weight.
- Let batch and evaluation jobs borrow unused capacity but yield first when interactive load rises.
Plan below the ceiling
A provider quota is an upstream constraint, not guaranteed capacity. Your application owns scheduling and fairness, and it should keep its own limits below provider ceilings with headroom for estimation error, in-flight requests, retries, and failover. A reasonable starting point is to cap application admission at a fraction of the published limit and adjust from observed rejections, latency, and queueing, rather than planning at 100%.
Admission control: estimate, reserve, reconcile
Token counts are only known precisely after a response completes, so a quota system has to work with estimates first. The loop that works well in production:
- Estimate the input tokens from the prompt and bound the output with a max-tokens setting.
- Reserve that capacity against every relevant budget dimension (tenant tokens, tenant requests, provider RPM, provider TPM). Admit the request only if all of them have room.
- Dispatch the request.
- Reconcile the reservation with the actual usage the provider reports, and release the difference.
- Learn from the estimate-versus-actual error so the next forecast is tighter.
If you skip reconciliation, estimates drift and your internal counters stop matching what the provider sees. That is how teams end up throttled by a provider while their own dashboard says there is plenty of room.
Here is a minimal sketch of the reserve-and-reconcile pattern:
def admit(tenant, est_input, max_output):
    need = est_input + max_output
    if not budget.try_reserve(tenant, tokens=need, requests=1):
        return reject_or_queue(tenant)
    return need

def complete(tenant, reserved, usage):
    actual = usage.input_tokens + usage.output_tokens
    budget.release(tenant, reserved - actual)
    forecast.update(tenant, reserved, actual)
The details of your counter store (in-memory, Redis, a database) matter less than making the reservation atomic and the reconciliation reliable.
What to do when you approach a limit or get a 429
Not every 429 means the same thing, and the response depends on which kind you got.
Temporary rate-limit errors
For a rate-limit 429, honor the Retry-After header when it is present. If it is missing or invalid, use exponential backoff with jitter, and pace requests so you avoid bursts. Jitter matters: without it, many clients retry on the same schedule and recreate the spike that caused the error.
Backoff alone is not a strategy at scale. When your queue drains faster than the limit refills, apply backpressure upstream so the queue enforces flow control, rather than flooding a retry loop. Degrade or shed low-priority work before you let retry storms form.
Billing, spend, and quota errors
Some 429s are not about speed at all. OpenAI's guidance lists error codes such as credit_balance_exhausted, organization_usage_limit_exceeded, organization_spend_limit_exceeded, and project_spend_limit_exceeded, and notes that retrying a billing or quota error does not restore access. The fix depends on the code, as the spend limits guide describes:
| Error code | Fix |
|---|---|
organization_spend_limit_exceeded or project_spend_limit_exceeded | Raise or remove the limit that was reached, or wait for the monthly reset |
organization_usage_limit_exceeded | Request a higher approved usage limit |
credit_balance_exhausted | Add credits |
That guide also notes that enforcement is not instantaneous, so recorded spend can slightly exceed the configured amount. Set your internal alert thresholds well below the hard limit.
In your client code, branch on error.code before deciding whether to retry. A retry policy that treats every 429 as transient will hammer a provider that has already refused you for billing reasons.
Requesting higher limits
When forecasts show you will outgrow a tier, ask early. On Anthropic, you request higher limits in the Claude Console, where you can also see your organization's current tier and limits. Requests become available once the organization is using at least 50% of its current limits. With OpenAI, tier upgrades follow credit purchases, and a higher approved usage limit is a separate request, per the spend limits guide.
Confirm the change by re-reading your limits in the provider console after approval, then update your internal allocation so the new headroom is divided deliberately rather than grabbed by whichever workload runs first.
Forecasting and monitoring across multiple providers
Once several teams share several providers, rate limiting stops being an integration detail and becomes a shared-capacity problem. One provider limits requests and input tokens, another separates input from output, and a third applies quotas at the project level. A retry loop inside each SDK cannot coordinate those constraints across tenants, apps, and model routes.
The practical answer is a central point that estimates demand, reserves capacity before dispatch, queues or rejects work by policy, and reconciles afterward. Whatever you build, track these signals per provider, model, and tenant:
- Tokens consumed (input and output separately) against each limit
- Requests per minute and peak concurrency
- 429 counts, split by rate-limit versus billing codes
- Queue depth and time spent waiting
- Estimate-versus-actual token error
- Spend against each project or organization limit
Look at peaks over short windows, not only hourly averages, because that is where throttling happens.
Perspective: a gateway plus traces beats scattered counters
We see the same pattern in teams moving agents to production. Quota problems rarely show up as a clean quota problem. They show up as a slow agent, a failed tool call, or a surprising invoice, and by the time someone asks which workload caused it, the data lives in six places.
That is why we think quota management belongs next to observability, not apart from it. When every LLM call passes through one governed endpoint and becomes a trace with its payload, latency, and token counts, you can answer the questions that matter: which team used the tokens, which prompt version inflated them, which agent step retried. The MLflow AI Gateway is designed to give your team a single endpoint across providers, with usage tracking and native tracing built in, and with AI observability on the same platform you can drill from a latency or error spike straight into the individual traces behind it.
Everything in MLflow is open source under Linux Foundation governance, with no enterprise feature paywall, so the visibility you need to set sensible per-tenant budgets is not a premium add-on. Our advice: centralize provider access first, measure real token consumption per workload for a couple of weeks, and only then set your quotas from observed data rather than guesses.
Kevin
Putting it together: a rollout plan
- Inventory your limits. For each provider and model, record RPM, token limits, daily caps, spend limits, and scope (organization, project, model family).
- Route through one entry point. Direct SDK calls scattered across services make coordination impossible. A shared gateway gives you one place to measure and enforce.
- Measure before you cap. Capture tokens per tenant, feature, and workload class. Use real traces to see how prompts and agent loops actually consume capacity.
- Set three-part quotas. Token budget, request rate, and concurrency cap per tenant, with protected capacity for interactive traffic.
- Build the 429 policy. Retry-After first, then backoff with jitter, with separate handling for spend and credit errors.
- Reconcile and forecast. Compare estimates to actuals weekly and adjust headroom.
- Ask for more before you need it. Use provider request processes while you still have room to wait.
For more reading from our team, browse our posts on LLM rate limits, per-tenant rate limits, and scaling LLM applications.
Run provider access through one governed endpoint
If your team calls several LLM providers from several services, the first step is making that traffic visible and consistent. MLflow gives you an open-source AI Gateway for cross-provider access and governance, tracing for agent reasoning and LLM calls, and automated evaluation on real traffic. You can start with the MLflow AI platform for agents and LLMs.
To try the gateway locally, install MLflow with the GenAI extras and start a server, then follow the quickstart to connect your own provider keys:
pip install 'mlflow[genai]'
mlflow server
The MLflow AI Gateway announcement walks through the setup.
FAQ
What is the difference between a rate limit and a quota?
A rate limit controls traffic over a short window, such as requests or tokens per minute. A quota controls allowed usage over a longer window, such as a day or month. Providers sometimes use the words interchangeably, so check the unit, scope, reset rule, and exhaustion behavior of each control.
Should I limit by requests or by tokens?
Use tokens as your primary control, because tokens are the real cost and capacity dimension and one request can vary enormously in size. Keep a request-rate limit and a concurrency cap as guardrails, since they catch bursts and connection exhaustion that a token budget misses.
Why do I get 429 errors when my average usage is under the limit?
Providers may enforce limits over shorter sub-intervals than the window shown in a dashboard, so a short burst can trip the limit even if the minute-level average looks safe. Smooth traffic with pacing and queues, and honor the Retry-After header when it is returned.
Does retrying fix a spend or credit-balance error?
No. Errors such as an exhausted credit balance or a reached spend limit need a change on the account: add credits, raise or remove the limit, or wait for the monthly reset. Check the error code first, then retry only the errors that are temporary.
How do I split one provider limit among many teams?
Give each team or tenant a token budget, a request rate, and a concurrency cap. Reserve protected capacity for interactive traffic and headroom for retries and failover. Let batch jobs use leftover capacity through a queue, and revisit the split as your measured usage changes.
Sources
- Rate limits | OpenAI
- Troubleshooting API usage and spend limits | OpenAI Help
- Troubleshooting API rate limits and 429 errors | OpenAI Help
- Spend limits | OpenAI
- Our approach to rate limits for the Claude API | Claude Help
- Rate limits | Anthropic
- LLM rate limits: tokens per minute, requests per minute | Microsoft Learn
- LLM Rate Limiting and Token Quotas in Production | metacto
- AI quota vs. rate limit vs. spend cap | BaristaLabs
- Build a Provider-Neutral LLM Rate Limit Broker | B2B LLM
- Rate limiting, quota, and admission-control engineering for AI systems | AI Stack Current
- Introducing MLflow AI Gateway | MLflow