What is LLM observability? A guide for AI ops teams

Deploying a large language model to production and assuming your existing monitoring stack will catch failures is one of the most common and costly mistakes AI ops teams make today. Understanding what is LLM observability, and why it differs fundamentally from traditional system monitoring, is now a core competency for any team running LLMs at scale. Your infrastructure dashboards can show green across the board while your model is confidently generating hallucinated facts, violating content policies, or drifting away from your intended use case. This guide breaks down what LLM observability actually covers, how to implement it, and why getting it right is non-negotiable for enterprise deployments.
Table of Contents
- What is LLM observability and why does it matter?
- Core components of LLM observability: tracing, metrics, and evaluations
- Why traditional monitoring falls short for large language models
- Implementing LLM observability in enterprise environments
- Why traditional AI monitoring approaches won’t cut it for LLMs
- Streamline your LLM observability with MLflow AI platform
- Frequently asked questions
Key Takeaways
| Point | Details |
|---|---|
| LLM outputs require semantic monitoring | LLM observability tracks output quality and safety beyond traditional system health metrics. |
| Tracing links failures to root causes | Combining trace data with quality evaluations accelerates debugging and reduces investigation time. |
| Prompt tracking is crucial | Monitoring prompt templates and versions helps correlate changes to performance and output quality. |
| LLM observability improves reliability | Continuous monitoring of LLMs enables early anomaly detection and helps maintain alignment with business goals. |
| MLflow supports end-to-end observability | MLflow provides SDKs and tools for instrumentation, tracing, evaluation, and cost monitoring in production LLMs. |
What is LLM observability and why does it matter?
LLM observability is the practice of continuously monitoring, tracing, and evaluating the behavior of large language models across the full application lifecycle. It extends far beyond infrastructure metrics. As LaunchDarkly documents, LLM observability analyzes how models behave across development, testing, and production by tracking inputs, outputs, latency, quality, safety, and cost.
The distinction from traditional observability is significant. With a conventional API or database, a successful response means the system did what it was supposed to do. With an LLM, a 200 OK response only tells you the model returned something. Whether that something is accurate, relevant, safe, or aligned with your business goals is an entirely separate question, and one that standard monitoring tools cannot answer.
The AI observability overview from MLflow captures this well: observability for AI systems must account for the semantic dimension of outputs, not just the operational one. For enterprise teams, this means building monitoring pipelines that cover:
- Input tracking: Logging every prompt, including template versions and injected variables
- Output evaluation: Assessing responses for correctness, relevance, toxicity, and hallucinations
- Latency and throughput: Measuring end-to-end response times and throughput under load
- Token usage and cost: Tracking per-request token consumption to manage spend
- Safety and alignment checks: Detecting policy violations, off-topic responses, and prompt injections
- Drift detection: Identifying when model behavior shifts over time, even without a code change
Each of these dimensions addresses a failure mode that traditional monitoring simply cannot see. That is the core argument for LLM observability as a distinct practice.
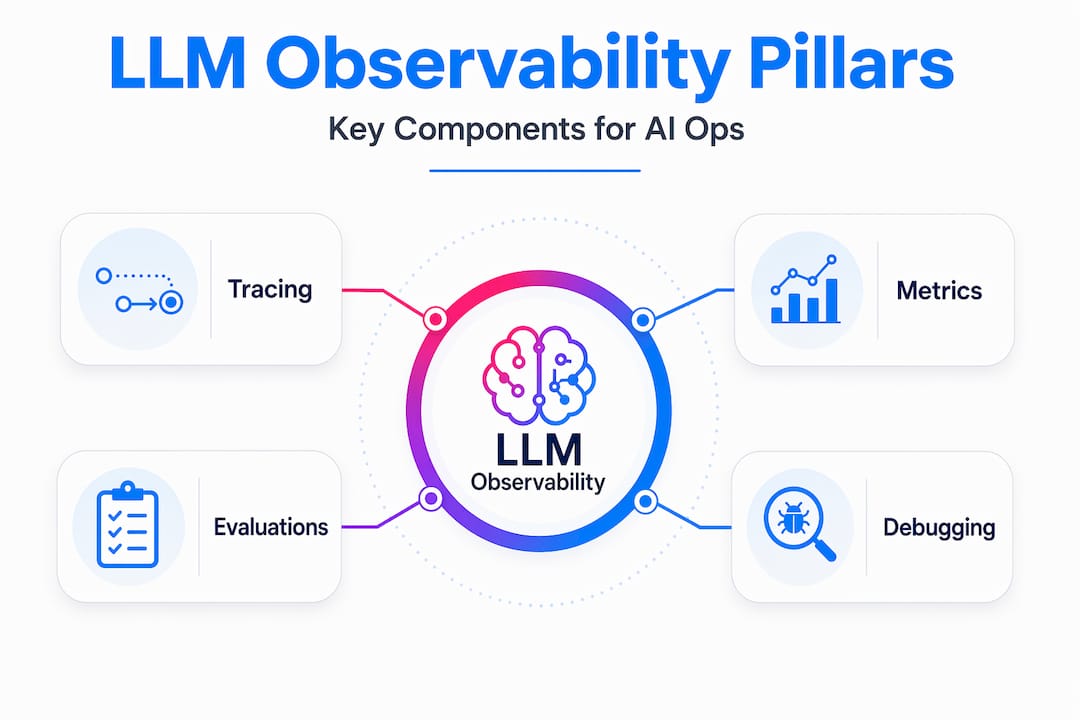
Core components of LLM observability: tracing, metrics, and evaluations
Now that we’ve introduced the need for LLM observability, let’s look at the specific technical pillars that make this practice work in production. There are three primary components: tracing, metrics, and evaluations. Together, they give your team a complete picture of system health and output integrity.
Tracing maps the full lifecycle of a request through your LLM application. This includes the initial prompt, any retrieval steps in a RAG pipeline, calls to external tools or APIs, sub-agent invocations, and the final model response. LLM tracing techniques are essential for root cause analysis because they let you pinpoint exactly where in a complex workflow something went wrong, rather than hunting through disconnected logs.

Metrics are the quantitative signals your team needs to track continuously. As Elastic’s LLM observability documentation outlines, LLM observability includes tracing each request through the stack, capturing token usage and cost, tracking latency and errors, and running quality and safety evaluations on outputs. On the instrumentation side, Datadog’s approach supports capturing prompts and completions, token usage, latency, error info, and model parameters.
Evaluations are what truly separate LLM observability from everything that came before. These are automated or human-in-the-loop assessments of whether model outputs meet defined quality criteria. Evaluations for LLMs typically include:
- Relevance scoring: Does the response address what the user actually asked?
- Faithfulness checks: In RAG systems, is the answer grounded in the retrieved context?
- Hallucination detection: Did the model fabricate facts, names, or citations?
- Toxicity and safety: Does the response contain harmful, biased, or policy-violating content?
- Task-specific rubrics: Custom criteria aligned to your application’s business requirements
Here is a quick reference for the three pillars and what each captures:
| Component | What it captures | Why it matters |
|---|---|---|
| Tracing | Request flow, spans, tool calls, sub-agents | Root cause analysis in complex workflows |
| Metrics | Token count, cost, latency, error rate | Operational health and spend management |
| Evaluations | Quality, relevance, safety, hallucinations | Output integrity and business alignment |
Pro Tip: Wire your evaluations directly to individual traces, not just aggregate reports. When an evaluation flags a low-quality response, you want to jump straight to the exact prompt, context, and model parameters that produced it. Aggregate scoring alone tells you there is a problem. Trace-linked evaluation tells you why.
Why traditional monitoring falls short for large language models
Understanding these components helps clarify why traditional monitoring misses key LLM failure modes. The gap is not a matter of degree. It is structural.
Traditional monitoring was built around a simple contract: if the system returns a valid response within an acceptable time, the request succeeded. That contract holds for deterministic systems. An API that returns the wrong JSON is a bug you can catch. A database query that returns stale data triggers an alert. The failure is visible at the infrastructure layer.
LLMs break this contract entirely. As Swept AI’s observability guide notes, an LLM can have sub-second latency and 200 OK status yet produce fabricated, harmful, or off-topic content undetectable by traditional monitoring. Your uptime monitor sees a healthy system. Your user sees a confidently wrong answer.
“Infrastructure metrics alone miss hallucinations and incorrect outputs even when requests technically succeed.” — Swept AI LLM Observability Guide
The failure modes unique to LLMs include:
- Hallucinations: The model generates plausible-sounding but factually incorrect information
- Topic drift: Responses gradually shift away from intended use cases without any code change
- Prompt injection: Malicious inputs manipulate the model into ignoring system instructions
- Refusal failures: The model refuses valid requests due to overly aggressive safety tuning
- Bias amplification: Outputs reflect or amplify demographic or ideological biases present in training data
None of these show up in your existing production observability challenges tooling unless you build explicitly for them. A customer-facing LLM that starts hallucinating product specifications will not trigger a single alert in a traditional monitoring stack. The only signal you get is a surge in support tickets, or worse, a public incident.
Implementing LLM observability in enterprise environments
With these challenges in mind, let’s explore how enterprise teams actually build practical observability into their LLM deployments. The good news is that the implementation path is well-defined, even if the tooling is still maturing.
- Instrument your application with an observability SDK. The fastest path to tracing and metric collection is integrating an SDK that auto-instruments your LLM calls. Getting started with MLflow tracing requires minimal code changes and immediately begins capturing spans, token counts, and latency for every request.
- Treat prompts as versioned artifacts. Prompt templates are the primary lever teams use to change model behavior, but they are often managed as strings in a config file. Treating prompts as first-class observables helps correlate prompt changes with latency, cost, and evaluation metrics. When a quality regression appears, you can immediately check whether a prompt version change preceded it.
- Link evaluations to traces. Run automated evaluations on every response, or a statistically significant sample, and attach the results to the originating trace. Datadog reports a roughly 20x reduction in debugging time by correlating evaluator failures with trace-level context. That is the difference between knowing a problem exists and knowing exactly where to fix it.
- Set up cost and safety dashboards with proactive alerts. Token costs can spike unexpectedly when users find creative ways to send long prompts. Safety violations can cluster around specific input patterns. Dashboards that surface these signals in real time, with alerts that fire before costs or risks escalate, are essential for production operations.
Here is a practical breakdown of what to instrument at each stage of your deployment:
| Deployment stage | Key observability actions | Primary benefit |
|---|---|---|
| Development | Trace all LLM calls, log prompt versions | Catch regressions before they ship |
| Staging | Run LLM-as-a-Judge evaluations on test sets | Validate quality against baselines |
| Production | Monitor cost, latency, safety, and drift | Detect failures before users report them |
| Post-incident | Replay traces with updated prompts | Confirm fixes without re-deploying |
Pro Tip: Do not wait for user complaints to discover quality regressions. Set up automated evaluation runs on a rolling sample of production traffic and alert on any statistically significant drop in your quality scores. This is the LLM equivalent of synthetic monitoring, and it catches problems hours or days before they surface in user feedback.
Why traditional AI monitoring approaches won’t cut it for LLMs
Here is the uncomfortable truth we have observed working with enterprise AI teams: most organizations treat LLM observability as something they will add later, once the model is “stable.” That framing misunderstands what stability means for probabilistic systems.
LLM outputs are probabilistic and drift over time, so teams must observe both system performance and model behavior to catch anomalies. A model does not need a code change to start behaving differently. A provider model update, a shift in user input distribution, or a subtle change in retrieved context can all alter output quality without touching a single line of your application code. If you are not observing outputs continuously, you will not know until the damage is done.
We also see teams conflate evaluation with testing. Running an eval suite before deployment is necessary but not sufficient. Production inputs are messier, more varied, and more adversarial than any test set. The LLM evaluation perspective we advocate is that evaluation is a continuous process, not a gate. It belongs in your monitoring pipeline, not just your CI/CD workflow.
The rise of autonomous LLM agents makes this even more critical. When a model is not just answering questions but taking actions, calling APIs, and making decisions in multi-step workflows, an undetected failure does not just produce a bad response. It can trigger a cascade of incorrect actions that are difficult to reverse. Observability at the agent level, tracing every reasoning step and tool call, is the only way to maintain meaningful oversight of these systems.
Output correctness is a separate dimension from system health. Treating them as the same problem is how teams end up with production LLMs that are technically healthy and operationally broken.
Streamline your LLM observability with MLflow AI platform
If you are building or scaling LLM applications in production, the gap between what your current monitoring covers and what LLM observability requires is real and consequential. MLflow was built to close that gap.
MLflow LLM observability gives your team end-to-end instrumentation with minimal code changes, capturing traces, token metrics, and evaluation results in a unified platform. You can correlate prompt versions with quality scores, drill into individual traces when evaluations flag failures, and monitor cost and safety signals from a single dashboard. For teams running complex agentic workflows, MLflow AI observability provides deep tracing of multi-step reasoning chains and sub-agent interactions. MLflow LLM tracing integrates with the frameworks your team already uses, so you get production-grade visibility without rebuilding your stack.
Frequently asked questions
What is the difference between LLM observability and traditional monitoring?
LLM observability includes monitoring of model outputs for quality, safety, and relevance, whereas traditional monitoring focuses mainly on system health metrics like uptime and latency. As LaunchDarkly’s guide notes, LLM observability extends traditional monitoring by tracking semantic output evaluations in addition to infrastructure metrics.
Why can an LLM response be a failure even if the latency and error rates are low?
Because LLMs generate probabilistic outputs, a response can be incorrect, hallucinatory, or unsafe even if the system returns quickly without errors. LLMs can produce fabricated or harmful content despite successful system performance signals like sub-second latency and HTTP 200 status.
How does tracing help reduce debugging time for LLM applications?
Tracing correlates evaluation failures with exact request and workflow details, enabling faster identification of issues within complex LLM workflows. Datadog reports 20x faster debugging by linking evaluator failures to trace-level context for LLM agents.
What are key metrics to monitor with LLM observability?
Important metrics include token usage and cost, latency, error rates, model parameters, and quality evaluations such as hallucination detection and topic relevance. Datadog’s instrumentation captures prompts, completions, token usage, costs, latency, errors, and model parameters including temperature and max tokens.
Can LLM observability detect prompt injection attacks or content policy violations?
Yes, observability tools can monitor prompts and responses for harmful content and detect injection attempts, helping enforce safety guardrails. Elastic’s LLM observability monitors for prompt injection attacks and tracks policy-based interventions with built-in guardrails support.