Why Log ML Training Metrics: A 2026 Practitioner Guide

Logging ML training metrics is defined as the systematic capture of hyperparameters, evaluation scores, loss curves, and system performance data during model training runs. This practice, formally called experiment tracking, transforms ML development from ad hoc trial and error into structured, reproducible science. Without it, you lose the ability to compare runs, diagnose failures, or explain why one model outperforms another. Tools like Mlflow make this practice accessible across frameworks, capturing metrics like accuracy, F1 score, and RMSE alongside system data like GPU memory and inference latency.
Why log ML training metrics in the first place?
Logging ML training metrics reduces rework by centralizing parameters, metrics, and artifacts in one place. When you skip logging, every failed experiment becomes a dead end. You cannot trace what changed, what caused a performance drop, or which configuration produced your best validation F1 score last Tuesday.
The core value is reproducibility. A model that performs well in a notebook but cannot be recreated is not a model. It is a lucky accident. Structured logging gives you the full recipe: learning rate, batch size, data split, random seed, and every evaluation metric across every epoch.

Logging also enables collaboration. When a teammate picks up your experiment, they need context. A centralized log in Mlflow gives them the full picture without a 30-minute Slack thread. Structured experiment tracking drives team consistency and reduces chaos in shared ML projects.
What metrics should you log during training?
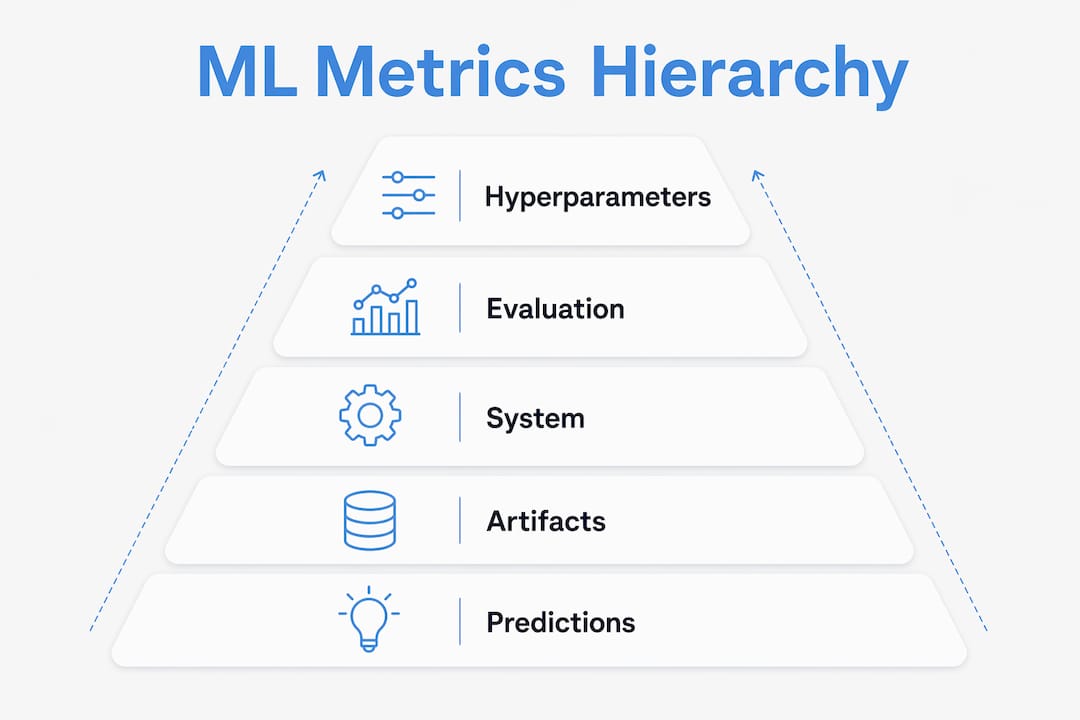
The three categories of metrics worth logging are hyperparameters, evaluation metrics, and system metrics. Each serves a different diagnostic purpose.
Hyperparameters to log:
- Learning rate and learning rate schedule
- Batch size and number of epochs
- Optimizer type (Adam, SGD, AdamW)
- Regularization settings (dropout rate, weight decay)
- Model architecture details (layer count, hidden dimensions)
Evaluation metrics to log:
- Loss values per epoch (training and validation)
- Accuracy and macro F1 score for classification tasks
- RMSE or MAE for regression tasks
- AUC-ROC for imbalanced datasets
- Inference latency per batch
System metrics to log:
- GPU memory usage and utilization per epoch
- CPU load and RAM consumption
- Disk I/O for large dataset pipelines
ML training metrics span all three categories, and skipping any one of them leaves a gap in your diagnostic picture. A model with great F1 but 98% GPU memory usage is a production risk you will not catch without system logging.
Pro Tip: Log raw predictions alongside ground truth labels for at least a sample of your validation set. This lets you compute custom metrics post hoc and analyze failure modes by class or input feature.
How does logging prevent silent failures and support debugging?
Silent failures are the most dangerous class of ML bug. The training loop runs, loss decreases, and nothing throws an error. But the model is learning nothing useful because a GPU ran out of memory and silently fell back to CPU, or a data pipeline bug introduced label noise at epoch 3.
Logging GPU memory and utilization per epoch catches Out-Of-Memory errors that manifest as stuck or unresponsive training sessions. Libraries like pynvml integrate with custom callbacks to push these metrics into Mlflow at each epoch boundary. Without this, a training run that "completed" may have produced a garbage model.
Logging distributions of predictions and input features over time is the only reliable way to detect data drift. Traditional single-output application logs miss the subtleties that degrade model performance gradually. Statistical context is not optional. It is the difference between a model that holds up in production and one that quietly fails.
Four failure patterns that extended logging catches:
- GPU OOM fallback. Training silently switches to CPU after an OOM event. Loss curves look normal but training speed drops 10x. GPU utilization logs reveal the switch immediately.
- Label leakage. Validation accuracy spikes to 99% in epoch 1. Logging input feature distributions alongside labels exposes the leakage before you ship a broken model.
- Learning rate collapse. Loss plateaus early. Logging the learning rate schedule per step shows whether a scheduler fired too aggressively.
- Data pipeline starvation. GPU utilization drops to 20% mid-run. System metric logs reveal that the data loader is the bottleneck, not the model.
Statistical context logging captures the "why" behind model behavior, not just the output. That distinction is what separates debugging in minutes from debugging in days.
Best practices for efficient ML metric logging
Logging everything at every step is not the answer. Logging every batch creates overhead and data volume that slows training and fills storage. Mlflow enforces a limit of 10 million metric steps per run, and each logged step adds approximately 2ms of latency. At scale, that adds up.
The table below compares logging strategies by granularity and cost:
| Strategy | Granularity | Overhead | Best for |
|---|---|---|---|
| Every step | Highest | High | Short debug runs only |
| Every Nth step | Medium | Low | Standard training loops |
| Per epoch | Low | Minimal | Long training runs |
| Uncertainty sampling | Adaptive | Low | High-dimensional inputs |
Sampling strategies like uncertainty-based sampling reduce infrastructure strain while preserving the most informative log entries. For large-scale distributed training, decoupled logging systems that write asynchronously prevent the logging layer from becoming a bottleneck in the training loop.
Mlflow's autolog feature handles the basics automatically. It captures parameters, losses, and model artifacts for supported frameworks including PyTorch and TensorFlow. Autologging adds minimal latency per epoch and requires no manual instrumentation for standard metrics. The practical approach is to use autolog as a baseline and layer custom logging on top for GPU metrics, custom evaluation functions, and artifact tagging.
Pro Tip: Tag every Mlflow run with metadata like dataset version, git commit hash, and team member name. These tags cost nothing to log and save hours when you need to audit which run used which data version.
How do logged metrics improve model performance and deployment?
Logged metrics are the raw material for systematic experiment comparison. Without them, you are choosing between models based on memory and gut feel. With them, you can query your Mlflow experiment store and rank every run by validation F1, filter by learning rate, and identify the configuration that generalizes best.
The practical workflow looks like this:
- Compare experiments systematically. Query logged metrics across runs to identify which hyperparameter combinations drive the best validation performance.
- Version models with context. Mlflow's model registry links each registered model version to the exact run that produced it, including all logged parameters and metrics.
- Build retraining feedback loops. When production performance degrades, logged training metrics let you diagnose whether the issue is data drift, a hyperparameter choice, or a system resource constraint.
- Anticipate deployment bottlenecks. System metric logs correlate GPU usage during training with expected inference latency in production, giving you a hardware sizing estimate before you deploy.
The model registry is particularly valuable for teams moving models from staging to production. Each version carries its full training history. A reviewer can inspect the logged F1 curve, the GPU memory profile, and the dataset version before approving a promotion. That audit trail is what structured experiment tracking makes possible.
Logged metrics also support continuous improvement workflows by creating a feedback loop between production monitoring and training. When you log the same evaluation metrics in both training and production, you can detect the moment a deployed model starts to drift and trigger a targeted retraining run with a clear hypothesis about what changed.
Key Takeaways
Logging ML training metrics is the foundation of reproducible, debuggable, and continuously improving machine learning workflows, and Mlflow provides the infrastructure to do it at scale.
| Point | Details |
|---|---|
| Log all three metric categories | Capture hyperparameters, evaluation metrics, and system metrics to get a complete diagnostic picture. |
| Use statistical context | Log prediction distributions and input feature distributions, not just scalar outputs, to detect drift early. |
| Balance granularity and overhead | Log every Nth step or per epoch to stay within Mlflow's 10M step limit and keep latency low. |
| Combine autolog with custom logging | Use Mlflow autolog for standard metrics and add manual logging for GPU stats and custom evaluations. |
| Link metrics to model versions | Use Mlflow's model registry to tie every registered model to its full training history and logged metrics. |
Why I think most teams are still logging too little
Most teams I have worked with treat logging as an afterthought. They add a few print statements, maybe a loss curve, and call it done. Then they spend three days debugging a model that "should have worked" because they have no record of what actually happened during training.
The shift that changed my perspective was logging GPU memory alongside model metrics for the first time. I caught a silent OOM fallback that had been corrupting training runs for two weeks. The loss curves looked fine. The model was not. That experience made me a believer in system-level observability as a first-class part of any training pipeline.
The other thing most teams underestimate is the value of statistical context in logs. Logging a single accuracy number per epoch tells you almost nothing about what the model is actually learning. Logging the distribution of predicted probabilities across classes tells you whether the model is confident, calibrated, or collapsing to a majority class prediction. That is the difference between a log and an insight.
My advice: start with Mlflow autolog to get the basics in place, then add one custom metric per week until your logs tell the full story of every training run. The structured data discipline you build in training will pay dividends when you move to production monitoring.
— Kevin
Mlflow makes experiment tracking a first-class workflow
Mlflow gives AI practitioners a single platform to log, compare, and act on training metrics across the full model lifecycle.

The Mlflow tracking API supports autologging for PyTorch, TensorFlow, scikit-learn, and XGBoost, capturing parameters, losses, and model artifacts with minimal setup. For teams building GenAI and LLM applications, Mlflow extends the same logging discipline to agent reasoning traces, evaluation scores, and prompt versions. The Mlflow AI platform connects training observability to production monitoring, so the metrics you log during training become the baseline you monitor in deployment. If you are ready to move from ad hoc notebooks to a structured experiment workflow, Mlflow is the place to start.
FAQ
What are ML training metrics?
ML training metrics are quantitative measurements captured during model training, including hyperparameters like learning rate, evaluation metrics like F1 score and RMSE, and system metrics like GPU memory usage. They provide the data needed to evaluate, compare, and improve model performance.
How do I log ML training metrics with Mlflow?
Use mlflow.autolog() to automatically capture standard metrics for supported frameworks, then add mlflow.log_metric() calls for custom measurements like GPU utilization or per-class accuracy. Mlflow stores all metrics in a centralized experiment store for comparison across runs.
How often should I log metrics during training?
Log evaluation metrics per epoch for standard training runs and use every-Nth-step logging for loss curves to balance granularity with overhead. Mlflow supports up to 10 million metric steps per run, and each logged step adds approximately 2ms of latency.
What is the difference between autologging and manual logging?
Mlflow autolog captures parameters, losses, and model artifacts automatically for supported frameworks with minimal latency per epoch. Manual logging gives you full control over custom metrics, GPU stats, and artifact tagging that autolog does not cover by default.
Why do system metrics matter for ML training?
System metrics like GPU memory and utilization reveal silent failures such as Out-Of-Memory errors that cause training runs to stall or degrade without throwing an error. Correlating hardware metrics with model performance also helps predict production inference costs before deployment.