What is model health monitoring: A data scientist's guide

Shipping a model to production is not the finish line. It is mile one. The moment your model starts serving real traffic, data distributions shift, user behavior evolves, and the world your model was trained on gradually diverges from the world it is operating in. What is model health monitoring, then? It is the continuous discipline of tracking model performance in production to catch accuracy degradation, data drift, and operational failures before they compound into serious incidents. For data scientists and ML engineers responsible for production AI, this is not optional hygiene. It is the foundation of reliable, trustworthy, and compliant AI systems.
Table of Contents
- Fundamentals of model health monitoring
- Model health monitoring in regulatory and risk management frameworks
- Comparing model health monitoring approaches and key metrics
- Implementing robust and compliant model health monitoring systems
- Best practices and pitfalls in model health monitoring
- Why traditional model monitoring approaches often fall short
- Empower your monitoring with MLflow AI platform
- Frequently asked questions
Key Takeaways
| Point | Details |
|---|---|
| Continuous monitoring essential | Model health monitoring requires ongoing tracking of performance and data signals, not one-off checks. |
| Compliance requires documentation | Regulations like the EU AI Act mandate documented, auditable post-market monitoring plans. |
| Track multiple metric types | Effective monitoring covers performance, operational, data quality, and business metrics. |
| Integrate with risk management | Monitoring must align with risk frameworks for proactive detection and response. |
| Build audit-ready pipelines | Design monitoring systems from day one to log data and metadata needed for audits. |
Fundamentals of model health monitoring
Model health monitoring is the practice of continuously observing every signal a deployed model emits — not just whether it returns a response, but whether that response is still accurate, fair, and operationally sound. Think of it less as a smoke detector and more as a full diagnostic panel running 24/7.
The signals worth watching fall into several distinct categories:
- Performance metrics: Accuracy, precision, recall, F1-score, AUC-ROC. These tell you whether predictions are still trustworthy.
- Operational metrics: Latency, throughput, error rates, and timeout frequency. A model that degrades in response time often signals upstream data pipeline issues or infrastructure pressure.
- Data quality signals: Missing values, out-of-range inputs, schema violations. These are often the earliest signs of trouble.
- Output distribution: Prediction confidence scores, class distribution shifts, and anomalous output patterns.
Monitoring accuracy, response times, and output distributions continuously is what separates teams that catch drift early from teams that discover it through a customer complaint.
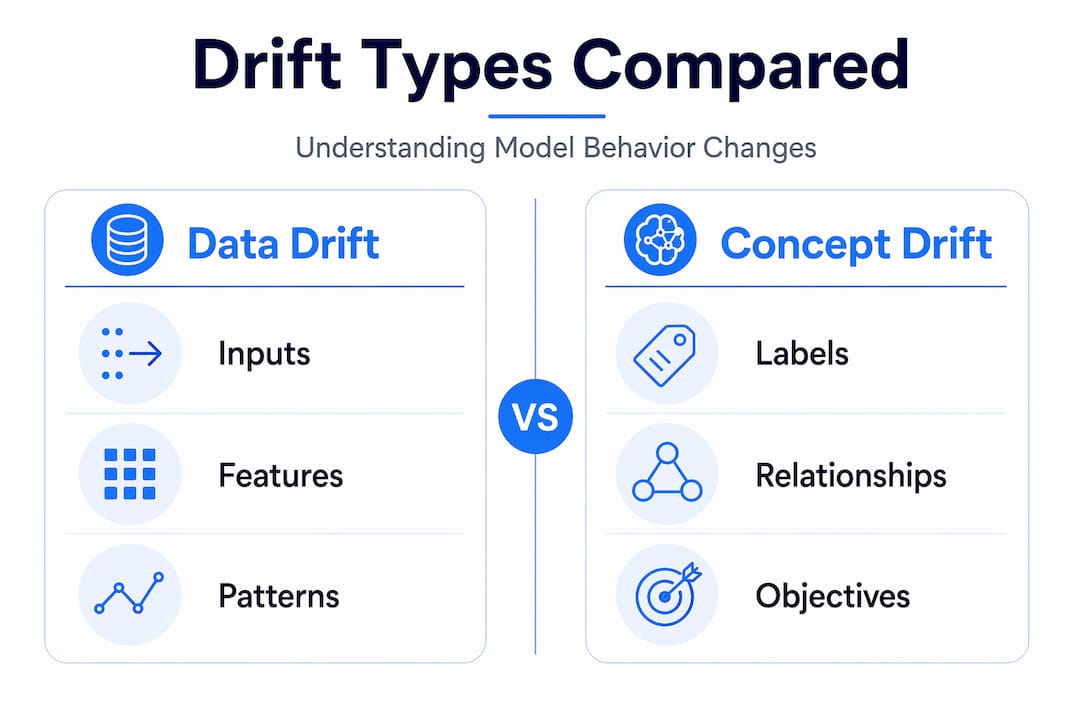
The four drift types you need to distinguish are: data drift (input feature distributions change), concept drift (the relationship between features and labels changes), prediction drift (the model's output distribution shifts independently), and upstream drift (changes in source systems feeding the model). Each requires a different detection strategy and response.

Baselines matter enormously here. Before you can detect anomalies, you need to capture what "healthy" looks like. Establish your baseline during a stable period post-deployment, log key model evaluation metrics at regular intervals, and store them as reference distributions. One-off checks tell you almost nothing. Continuous tracking tells you everything.
Pro Tip: Set up shadow scoring pipelines that run your new model candidate against live traffic in parallel before full deployment. This gives you a real-world baseline before the model ever takes on production load.
Model health monitoring in regulatory and risk management frameworks
Monitoring is no longer just good engineering practice. Increasingly, it is a legal obligation. If your models touch credit decisions, hiring, medical diagnostics, or any high-risk domain under emerging AI regulation, documented monitoring is mandatory.
The EU AI Act mandates post-market monitoring systems that are proportionate, active, and documented throughout the system's entire lifetime. This means you cannot ship a model, check it quarterly, and call it monitored. You need a formally documented post-market monitoring plan that specifies what you collect, how often, how you analyze it, and how you act on findings.
"Continuous monitoring must be tied to trustworthiness characteristics and integrated risk management rather than one-off testing." — NIST AI RMF
The NIST AI Risk Management Framework takes a compatible but broader view, calling for continuous risk measurement and documentation across the AI system lifecycle. Under this framework, monitoring evidence feeds directly into your risk management posture, not just your performance dashboards.
What this means practically for your monitoring setup:
- Traceability: Every monitoring event should be linked to the model version, input dataset, and timestamp.
- Documentation links: Monitoring logs must tie back to your technical documentation and risk assessments for audit readiness.
- User feedback loops: Incident reports, user complaints, and edge-case flagging should feed back into monitoring pipelines.
- Proportionality: High-risk models need higher monitoring frequency and more granular data collection than low-stakes internal tools.
Your AI monitoring strategies and AI observability approaches need to be designed with these compliance requirements in mind from day one, not retrofitted after a regulatory audit surfaces gaps.
With these frameworks in hand, let's compare the monitoring techniques and approaches available to you.
Comparing model health monitoring approaches and key metrics
Not all model health monitoring approaches are equal, and the right choice depends heavily on whether you are monitoring a classical ML model, a large language model, or a multi-agent system. The signal landscape is genuinely different across model types.
| Monitoring dimension | Classical ML models | LLMs and generative AI |
|---|---|---|
| Primary performance signal | Accuracy, precision, recall | Response quality, groundedness, toxicity |
| Drift detection | Feature distribution shifts | Prompt distribution changes, output length shifts |
| Latency concern | Inference time per request | Token generation rate, context window usage |
| Business impact metric | Conversion rate, error cost | Task completion rate, user satisfaction score |
| Alert strategy | Fixed thresholds on known metrics | Dynamic baselines, LLM-as-a-Judge evaluation |
Effective monitoring tracks input distribution drift, output confidence, latency, error rates, fallback activation, and business impact as a connected signal set, not isolated metrics.
The fixed-threshold versus dynamic-baseline debate is worth resolving clearly. Fixed thresholds work well for known, stable metrics — say, flagging when error rate exceeds 2%. Dynamic baselines are more appropriate for metrics that fluctuate seasonally or by user cohort, where a static threshold would generate constant false alarms or miss real issues. The best setups combine both: fixed floors for non-negotiable limits, dynamic windows for contextual drift detection.
Key monitoring signals by category:
- Performance: Accuracy, precision, recall, F1, AUROC, calibration error
- Operational: P50/P95/P99 latency, timeout rate, fallback activation frequency
- Data quality: Feature missingness rate, distribution Wasserstein distance, schema violations
- LLM-specific: Hallucination rate, faithfulness score, semantic similarity to reference outputs
The classical ML monitoring tools and LLM observability tools you choose should cover multiple signal categories simultaneously. A single-metric dashboard is a liability.
Pro Tip: Confidence score distributions are often the earliest warning signal available. If your model's average prediction confidence drops 5% before accuracy degrades visibly, that confidence shift is your early warning. Instrument it.
Implementing robust and compliant model health monitoring systems
Building a monitoring pipeline that holds up under regulatory scrutiny requires more than plugging metrics into a dashboard. It demands deliberate design from the pipeline level up.
Here is a practical implementation sequence:
- Define your observability surface. Identify every metric category relevant to your model's risk profile. For a credit scoring model, that includes fairness metrics. For an LLM-based support agent, that includes response groundedness.
- Instrument logging at the source. Log exact input datasets, prediction outputs, model version identifiers, and request timestamps. Every log entry must be attributable and reproducible.
- Establish baselines. Run your model under controlled conditions during the initial deployment period. Capture percentile distributions for every tracked metric.
- Configure tiered alerting. Define severity levels: informational (subtle drift detected), warning (threshold breached), critical (incident triggered). Route each severity to the appropriate owner.
- Integrate with incident response. Monitoring without a clear escalation path is noise. Each alert type should map to a documented response procedure.
- Build rollback triggers. When a critical threshold is breached, automated or one-click rollback to a previous stable version should be available.
| Implementation component | Purpose | Compliance relevance |
|---|---|---|
| Versioned model registry | Links predictions to exact model state | Traceability for audits |
| Immutable log storage | Preserves evidence for incident review | Legal defensibility |
| Automated drift reports | Documents distribution changes over time | Post-market monitoring plan |
| Alert escalation matrix | Defines response ownership and SLAs | Incident response documentation |
Compliance-ready monitoring requires linking evidence directly to technical documentation — this is not a documentation afterthought. It is a system design requirement. Your experiment tracking best practices and AI incident response runbook should be integrated into the same pipeline, not maintained as separate documents.
Pro Tip: Assign metadata tags to every logged prediction: model version, feature pipeline version, data source identifier, and deployment environment. This makes root-cause analysis during incidents dramatically faster.
Best practices and pitfalls in model health monitoring
Even teams with solid tooling fall into predictable traps. Here are the patterns we see most often and how to avoid them.
- Treating monitoring as a post-release activity. Monitoring design belongs in the model development phase. If you are defining your observability surface after deployment, you have already lost visibility on the baseline.
- Ignoring subtle early-warning signals. Confidence distribution shifts, slight increases in feature missingness, and small latency increases are all precursors to visible accuracy degradation. Instrument them explicitly.
- Alert fatigue from poorly calibrated thresholds. If every minor fluctuation triggers a page, teams start ignoring alerts. Calibrate thresholds against your baseline distributions, and review them quarterly.
- Unclear incident ownership. When an alert fires, someone specific needs to own it within a defined SLA. Ambiguity here turns incidents into prolonged outages.
- Weak communication protocols. During an incident, factual, timely updates to stakeholders matter as much as the technical response. Build this into your runbook.
Mature MLOps teams prioritize rapid detection, isolation, and recovery over reactive firefighting. The difference between a team that detects a drift event in two hours versus two weeks is almost always in the quality of their monitoring instrumentation, not the quality of their engineers.
The LLMOps operational insights perspective adds another layer: generative AI models require behavioral monitoring, not just statistical monitoring. A model that stays within latency bounds but starts producing subtly unfaithful responses is degrading — just not in a way classical metrics capture.
Pro Tip: Run quarterly monitoring fire drills. Inject synthetic drift into a staging environment and measure how quickly your system detects and escalates it. This is the most reliable way to validate your monitoring pipeline before a real incident forces the test.
Why traditional model monitoring approaches often fall short
Here is something most monitoring guides will not say directly: the majority of monitoring setups we see in production are built to satisfy a checklist, not to genuinely protect system integrity.
The checklist mentality looks like this: accuracy dashboard, check. Latency alert, check. Data drift detector, check. Box ticked, compliance conversation moved on. The problem is that continuous monitoring must anchor to trustworthiness characteristics and integrated risk management, not isolated metric tracking. When monitoring is treated as a compliance artifact rather than an operational necessity, it becomes exactly what it was designed to prevent: a blind spot.
We also see over-reliance on superficial aggregate metrics. A model's average accuracy across all requests can look healthy while accuracy on a specific demographic slice has collapsed. Aggregate metrics hide distributional failures. Slice-level monitoring, cohort analysis, and fairness tracking are not advanced features for mature teams — they are baseline requirements for any model with real-world consequences.
The teams that genuinely get monitoring right share three characteristics. First, they treat monitoring as a first-class engineering concern with dedicated ownership and resources. Second, they combine technical signals with qualitative inputs: user feedback, support ticket analysis, and downstream business metrics. Third, they embed monitoring outcomes into their governance and change management cycles, so that drift detection actually triggers a decision process rather than an email.
A holistic AI monitoring strategy is not about having more dashboards. It is about building the organizational processes that turn monitoring signals into timely, confident action.
Empower your monitoring with MLflow AI platform
If you are building out a production monitoring strategy, tooling matters — but integrated tooling matters more. Disconnected observability tools create the exact visibility gaps that monitoring is meant to close.
MLflow provides a unified platform for monitoring both classical ML models and generative AI applications, with production-grade observability built in from the start. You get deep tracing for agentic reasoning, automated evaluation using LLM-as-a-Judge frameworks, and LLM and agent observability that covers the behavioral signals classical monitoring tools miss. ML experiment tracking ties every run, parameter, and metric back to a specific model version, giving you the audit trail that compliance frameworks require. From real-time dashboards to retraceable data pipelines, MLflow gives your team the foundation to monitor confidently, respond quickly, and deploy with justifiable trust.
Frequently asked questions
What is model health monitoring in machine learning?
Model health monitoring is the continuous process of tracking an AI model's performance, data inputs, outputs, and operational metrics in production to detect issues like drift or errors early. It ensures your model remains accurate and reliable after deployment rather than degrading silently.
How does model health monitoring help with regulatory compliance?
It fulfills documented legal requirements around post-deployment oversight. For example, the EU AI Act mandates that high-risk AI providers maintain active post-market monitoring plans that collect and analyze performance data throughout the system's operational lifetime.
What key metrics should be monitored to ensure model health?
Core metrics include prediction accuracy, precision, recall, latency, input data distribution, output confidence, error rates, and business impact metrics. Effective monitoring includes fallback activation and business impact alongside the statistical performance signals.
How can teams prepare their monitoring systems for audits and compliance?
Design your logging pipelines from day one to capture exact datasets, telemetry, and model version identifiers. Compliance-ready monitoring links evidence to technical documentation so that every monitoring outcome is traceable and defensible during an audit.
What are common pitfalls in model health monitoring?
The most damaging pitfalls are treating monitoring as a post-release activity, ignoring subtle early-warning signals, and lacking clear incident ownership. Mature MLOps teams prioritize rapid detection and isolation over reactive responses, which requires having monitoring infrastructure in place before incidents occur.