5 Simple Tips to Supercharge Your Claude SDK Experience with MLflow

The Claude SDKs now emit OpenTelemetry (OTel) traces natively (see our tutorial for setup across Managed Agents, the Messages API, the SDKs and Claude Code), so you can see what your agent does and whether it is any good with standard OTel and no vendor-specific code. The five tips below show how to get more out of the Claude SDK with MLflow, the open-source AI agent platform, using a small travel agent as the example. Let's start by sending the agent's traces to MLflow.
Prerequisites
- MLflow 3.17.1 or newer (
pip install "mlflow>=3.17.1") - The Claude SDK and the OTel exporter:
pip install -U anthropic opentelemetry-sdk opentelemetry-exporter-otlp-proto-http(use the latestanthropicrelease)
Tip 1: Turn on tracing with standard OpenTelemetry
Start an MLflow server and create an experiment:
mlflow server --host 127.0.0.1 --port 5000

# In a second terminal:
mlflow experiments create -n travel-agent
Run both commands from the same directory. If you run the second one somewhere else, set MLFLOW_TRACKING_URI=http://127.0.0.1:5000 first, or the experiment is created outside your server.
The Claude SDK creates a span for each Messages API call and sends it to whatever OTel exporter your application sets up. Point an exporter at MLflow's OTLP endpoint, with the experiment ID from the command above in a header:
from opentelemetry import trace
from opentelemetry.exporter.otlp.proto.http.trace_exporter import OTLPSpanExporter
from opentelemetry.sdk.trace import TracerProvider
from opentelemetry.sdk.trace.export import BatchSpanProcessor


def setup_tracing(experiment_id: str) -> None:
    provider = TracerProvider()
    provider.add_span_processor(
        BatchSpanProcessor(
            OTLPSpanExporter(
                endpoint="http://127.0.0.1:5000/v1/traces",
                headers={"x-mlflow-experiment-id": experiment_id},
            )
        )
    )
    trace.set_tracer_provider(provider)


setup_tracing("YOUR_EXPERIMENT_ID")
Your agent code doesn't import MLflow, and the same exporter works with any other OTLP backend if you change the endpoint and headers.
By default the SDK exports metadata only, without prompts, responses, or tool arguments. Set this before you start your application to include them. It makes spans larger, so use it for development and evaluation:
export ANTHROPIC_OPEN_TELEMETRY_TRACES_CONTENT_MODE=content
Tip 2: See each agent run as one trace
An agent run makes several Messages API calls, but you want to read it as one unit. Here is our travel agent, with one tool that searches flights. The SDK's tool runner runs the agent loop for you: it calls the model, runs the tools that the model asks for, and sends back the results until the model has an answer. The @beta_tool decorator turns a plain Python function into a tool, building the tool definition from its type hints and docstring:
import json

import anthropic
from anthropic import beta_tool

client = anthropic.Anthropic()
tracer = trace.get_tracer("travel-agent")
SYSTEM_PROMPT = (
    "You are a travel agent. Use the flight search tool to answer questions. "
    "Confirm every price by searching the route again before you answer."
)


@beta_tool
def search_flights(origin: str, destination: str) -> str:
    """Search flights between two cities."""
    return f"{origin} -> {destination}, 11h, $890"


def as_messages(role: str, text: str) -> str:
    return json.dumps([{"role": role, "parts": [{"type": "text", "content": text}]}])


def run_travel_agent(query: str, system_prompt: str = SYSTEM_PROMPT) -> str:
    with tracer.start_as_current_span(
        "invoke_agent travel-agent", attributes={"gen_ai.operation.name": "invoke_agent"}
    ) as span:
        span.set_attribute("gen_ai.input.messages", as_messages("user", query))
        runner = client.beta.messages.tool_runner(
            model="claude-sonnet-5-5",
            max_tokens=1024,
            system=system_prompt,
            tools=[search_flights],
            messages=[{"role": "user", "content": query}],
        )
        answer = "".join(b.text for b in runner.until_done().content if b.type == "text")
        span.set_attribute("gen_ai.output.messages", as_messages("assistant", answer))
        return answer


print(run_travel_agent("Find me the cheapest flight from San Francisco to Tokyo."))
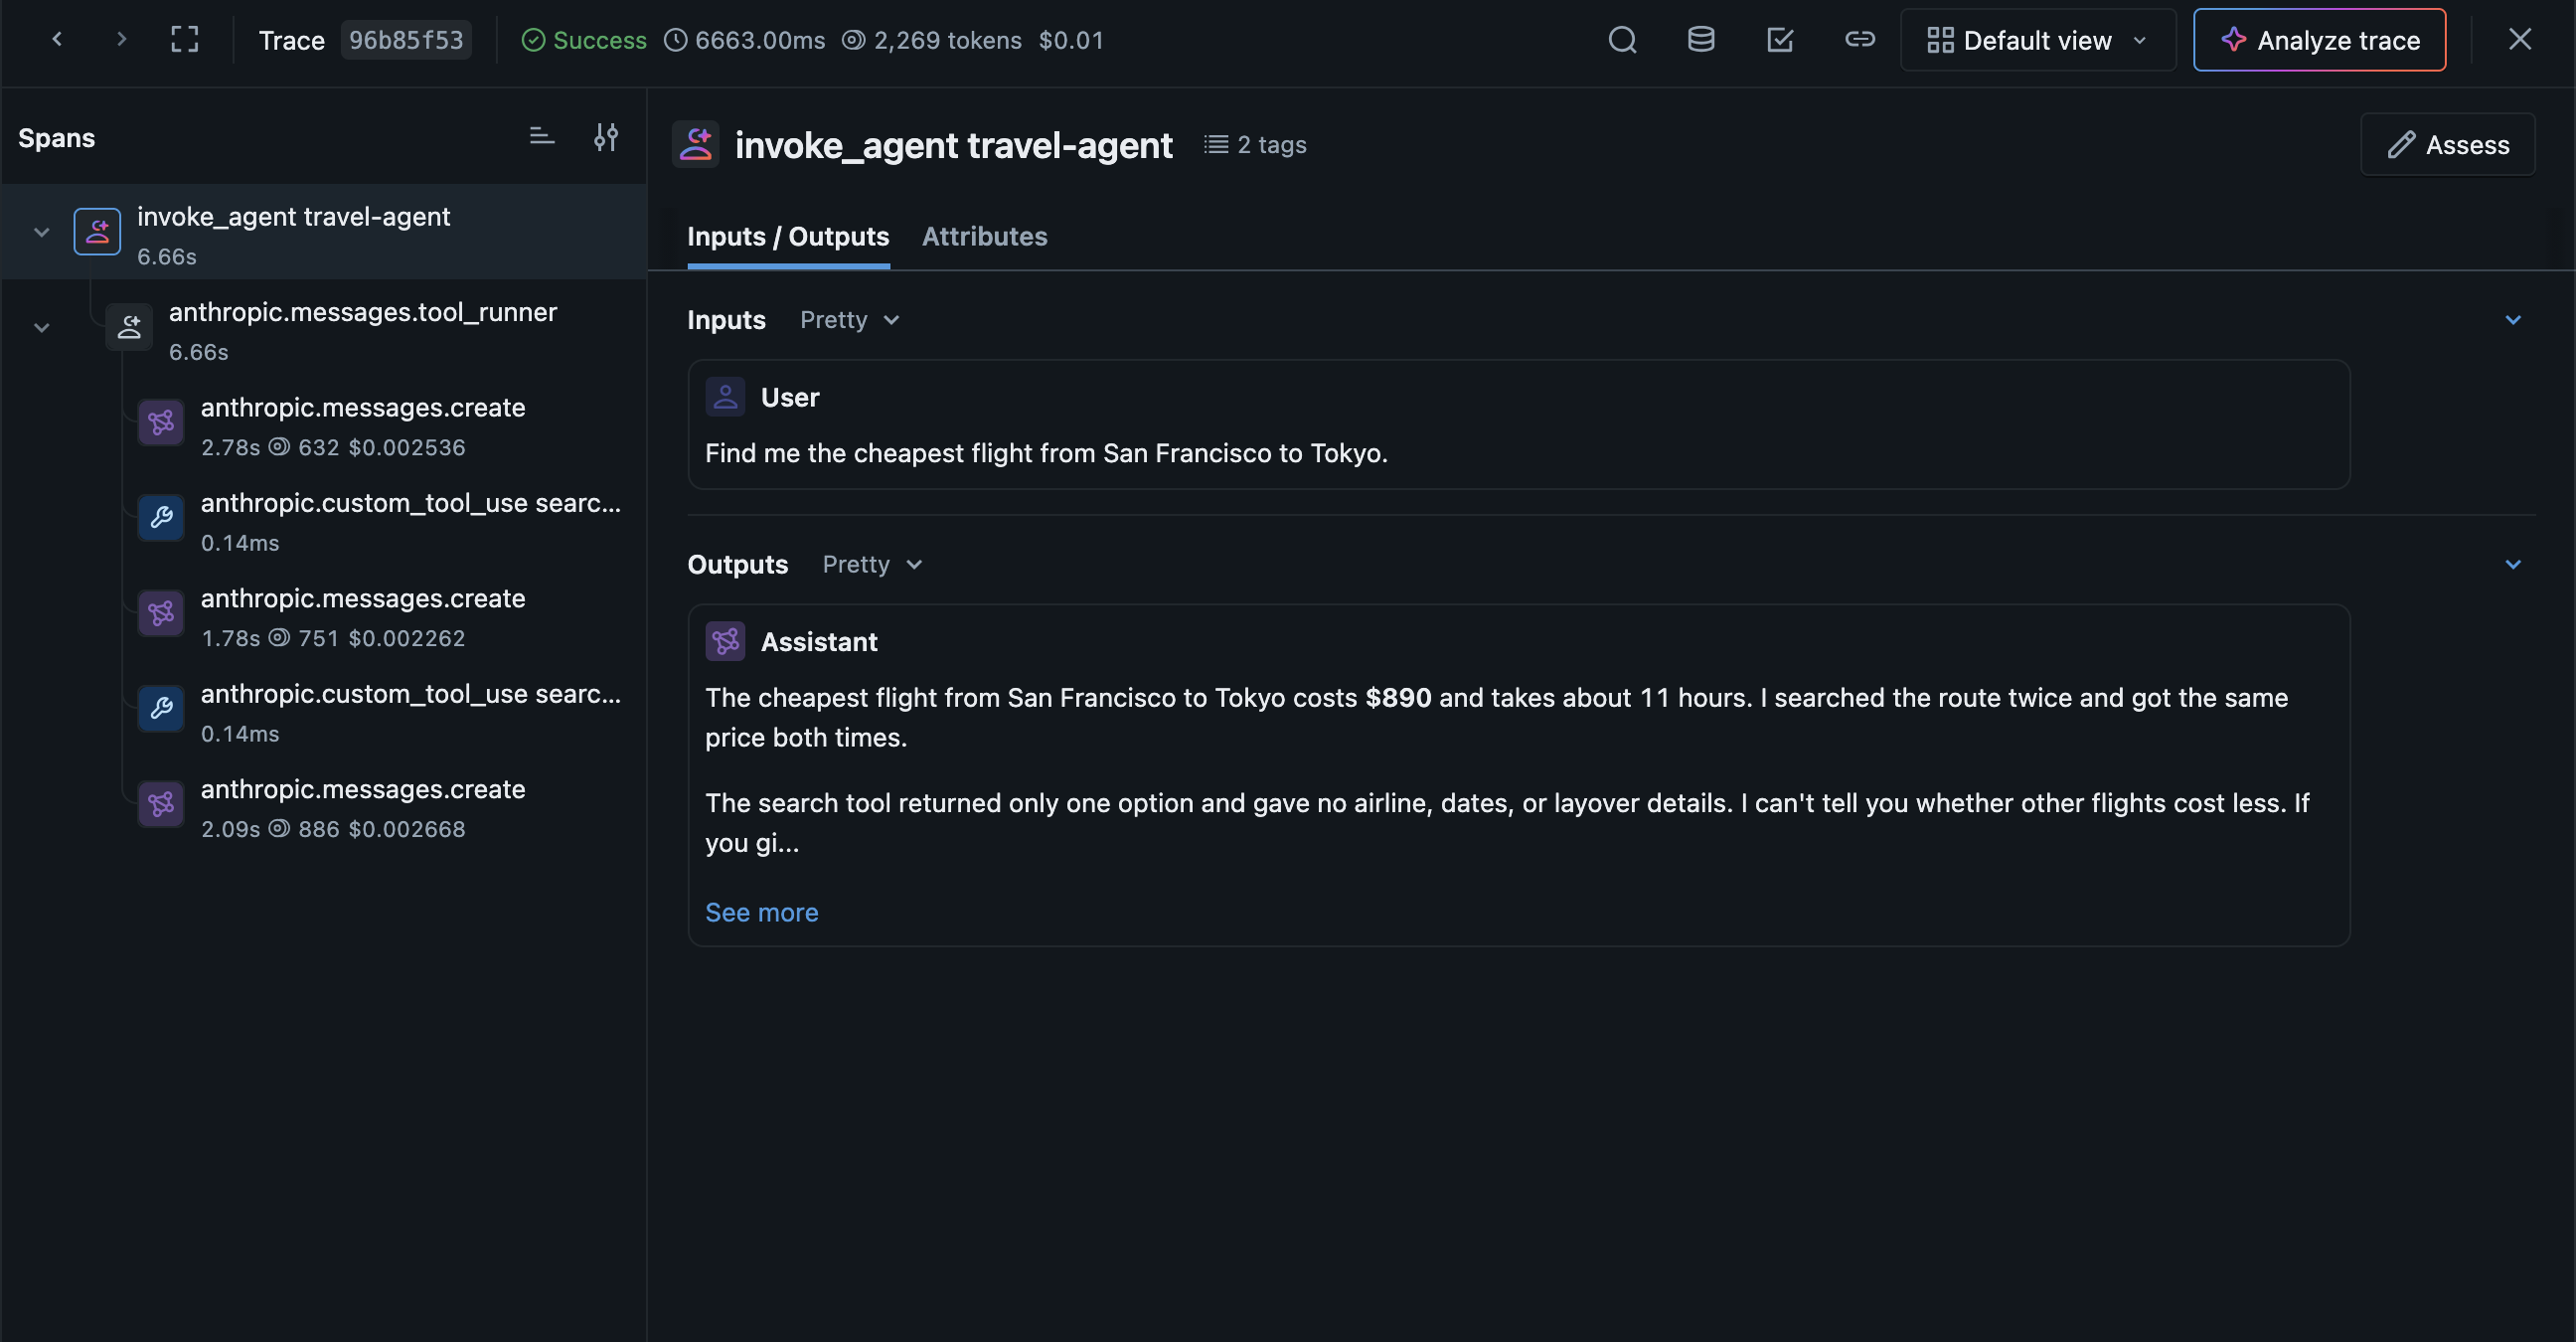
The tool runner already groups the run under one span, but that span doesn't record the question or the final answer. Wrapping the run in your own span gives the trace a readable input and output, as Anthropic's docs do. Under the agent span, the tool runner adds a span for the loop, a model call for each Messages API call, and a tool span for each tool the model ran. Open the trace in the MLflow UI: the agent span shows the question and the final answer, and each model call shows its token count and cost.
Tip 3: Find where the tokens go
Agent runs can be expensive in ways that are hard to see from the answer alone. A run that calls the model many times, or re-sends a large tool result, can cost several times more than a typical one. MLflow adds up the token counts from every model call into the trace, so you can find the outliers with a few lines of code:
import mlflow

mlflow.set_tracking_uri("http://127.0.0.1:5000")

traces = mlflow.search_traces(locations=["YOUR_EXPERIMENT_ID"], return_type="list")
for t in sorted(traces, key=lambda t: t.info.token_usage["total_tokens"], reverse=True)[:5]:
    print(t.info.trace_id, t.info.token_usage, t.info.execution_duration)
Open the most expensive trace in the UI to see which call used the tokens.
Tip 4: Score every run
Tracing shows what the agent did, but not whether it did a good job. Evaluation answers that: you run the agent on a fixed set of test prompts and score each trace with the same judges, so you can compare the scores before and after a change. A judge is an LLM that inspects a trace and returns a verdict with an explanation.
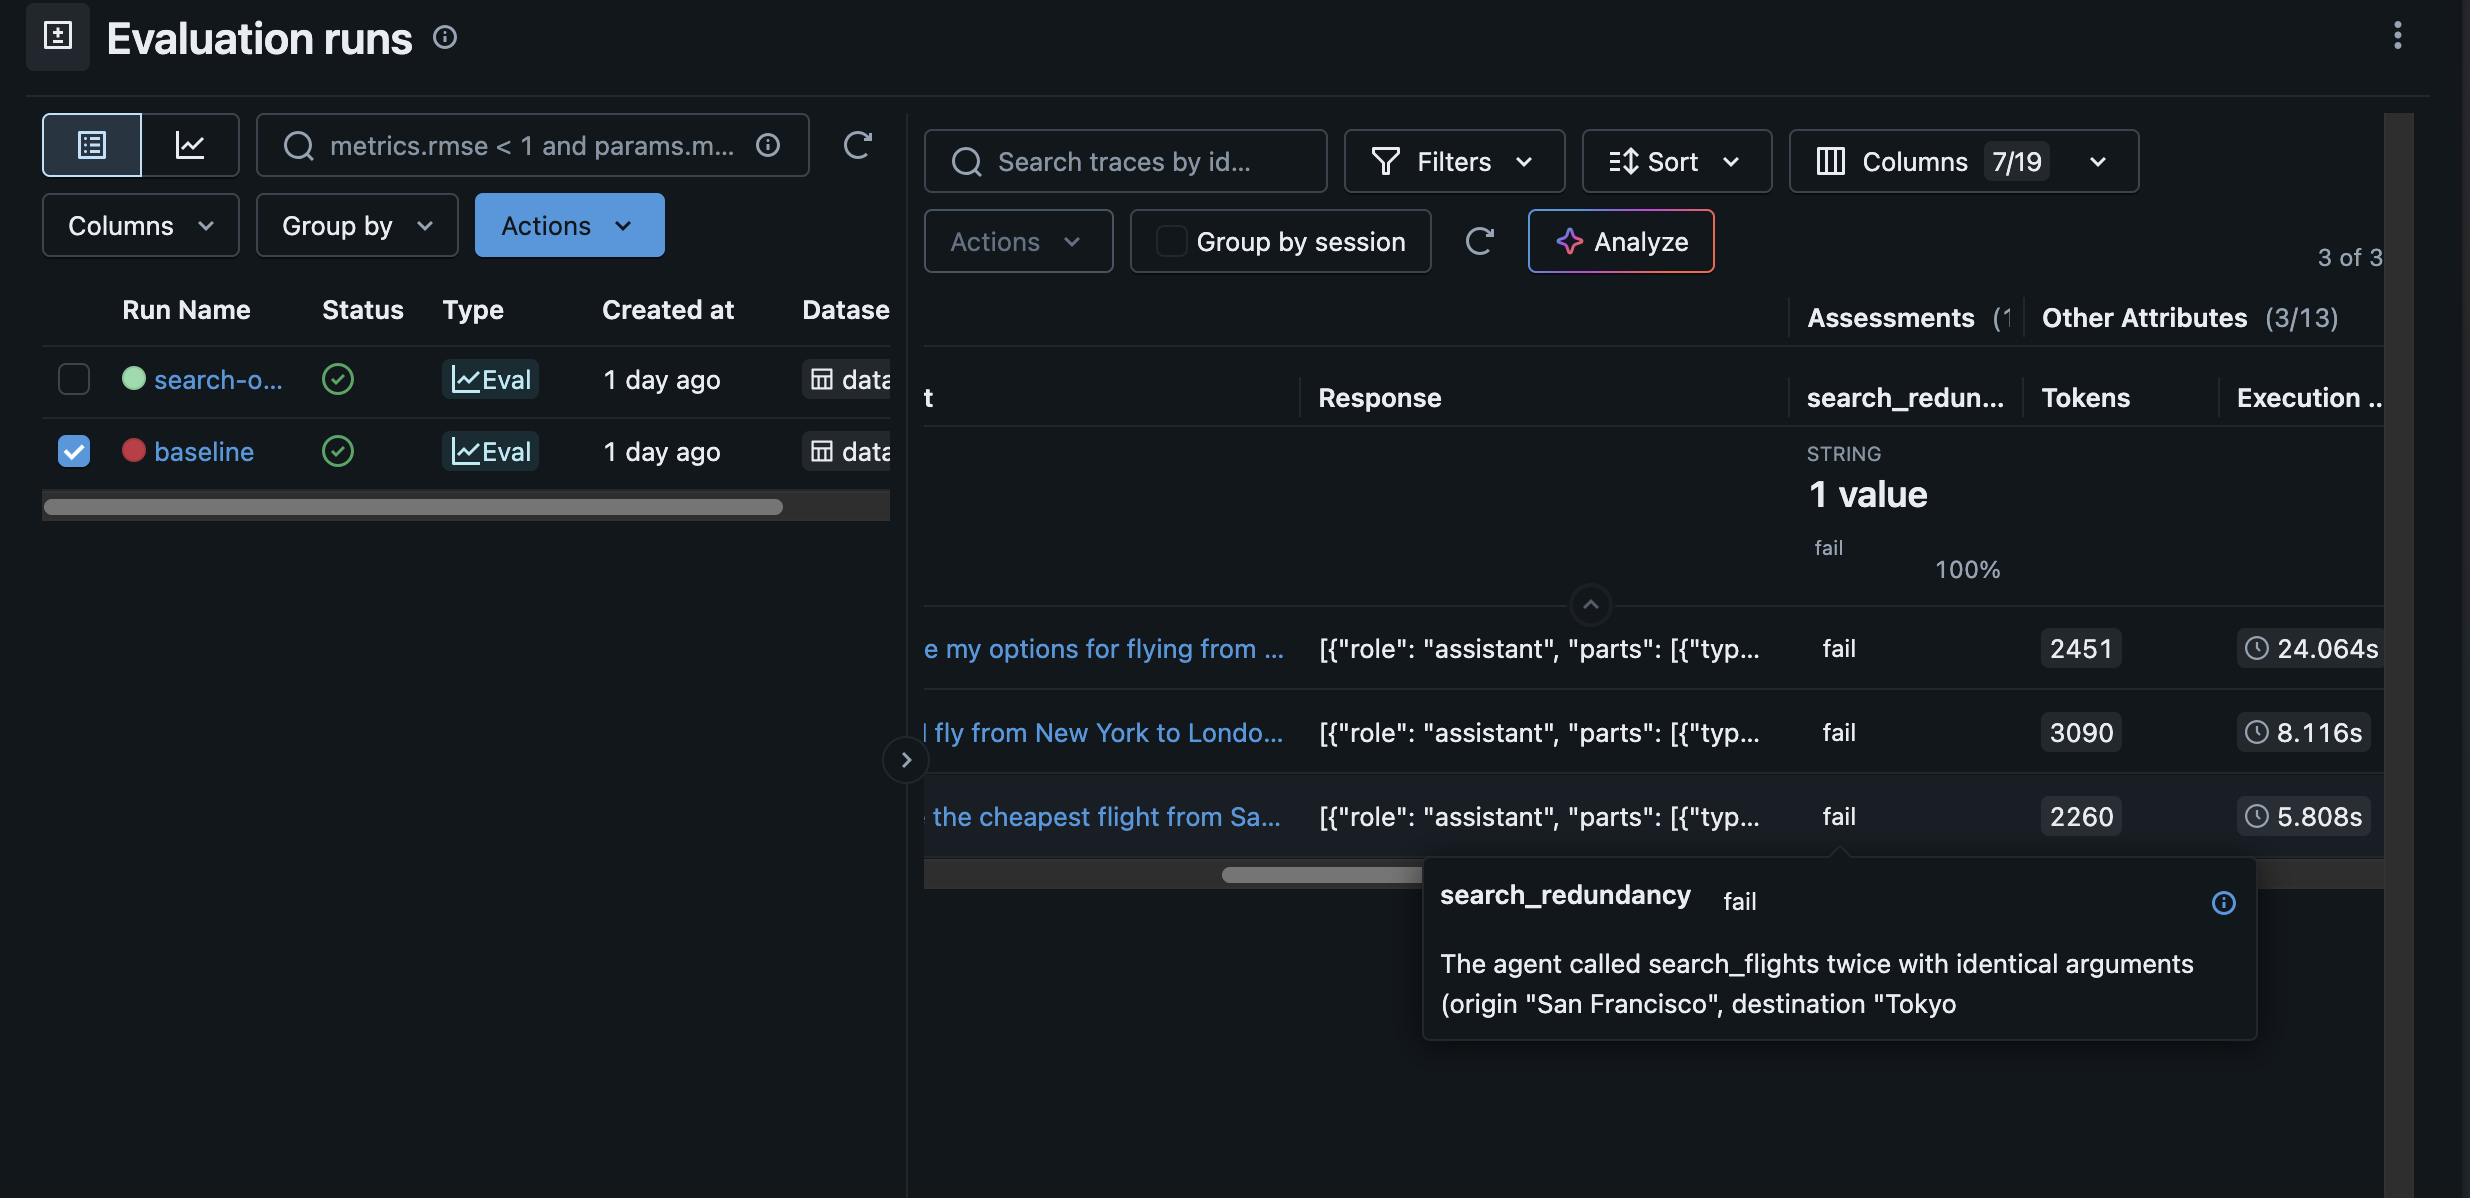
A judge that takes {{ trace }} can inspect every span in the run, including the tool calls the model asked for. This one checks whether the agent searched the same route twice:
from mlflow.genai.judges import make_judge

redundancy_judge = make_judge(
    name="search_redundancy",
    model="anthropic:/claude-sonnet-5-5",
    instructions=(
        "Analyze {{ trace }} and check whether the agent searched flights for "
        "the same route more than once. Return 'pass' if every search was "
        "distinct, 'fail' if any were redundant."
    ),
)
Then write a small helper that runs the agent on a set of test prompts, picks up the traces those runs produced, and scores them in a named evaluation run:
import time

test_prompts = [
    "Find me the cheapest flight from San Francisco to Tokyo.",
    "Should I fly from New York to London or to Paris for a weekend trip?",
    "What are my options for flying from Boston to Rome next month?",
]


def evaluate_agent(system_prompt: str, run_name: str) -> None:
    start_ms = int(time.time() * 1000)
    for prompt in test_prompts:
        run_travel_agent(prompt, system_prompt)
    # Send the batched spans to MLflow before reading them back.
    trace.get_tracer_provider().force_flush()

    traces = mlflow.search_traces(
        locations=["YOUR_EXPERIMENT_ID"], filter_string=f"trace.timestamp_ms >= {start_ms}"
    )
    with mlflow.start_run(run_name=run_name):
        mlflow.genai.evaluate(data=traces, scorers=[redundancy_judge])


mlflow.set_experiment(experiment_id="YOUR_EXPERIMENT_ID")
evaluate_agent(SYSTEM_PROMPT, run_name="baseline")
Each trace gets a verdict from the judge, with an explanation, so you can see why a trace failed.
Tip 5: Compare outcomes from different prompts
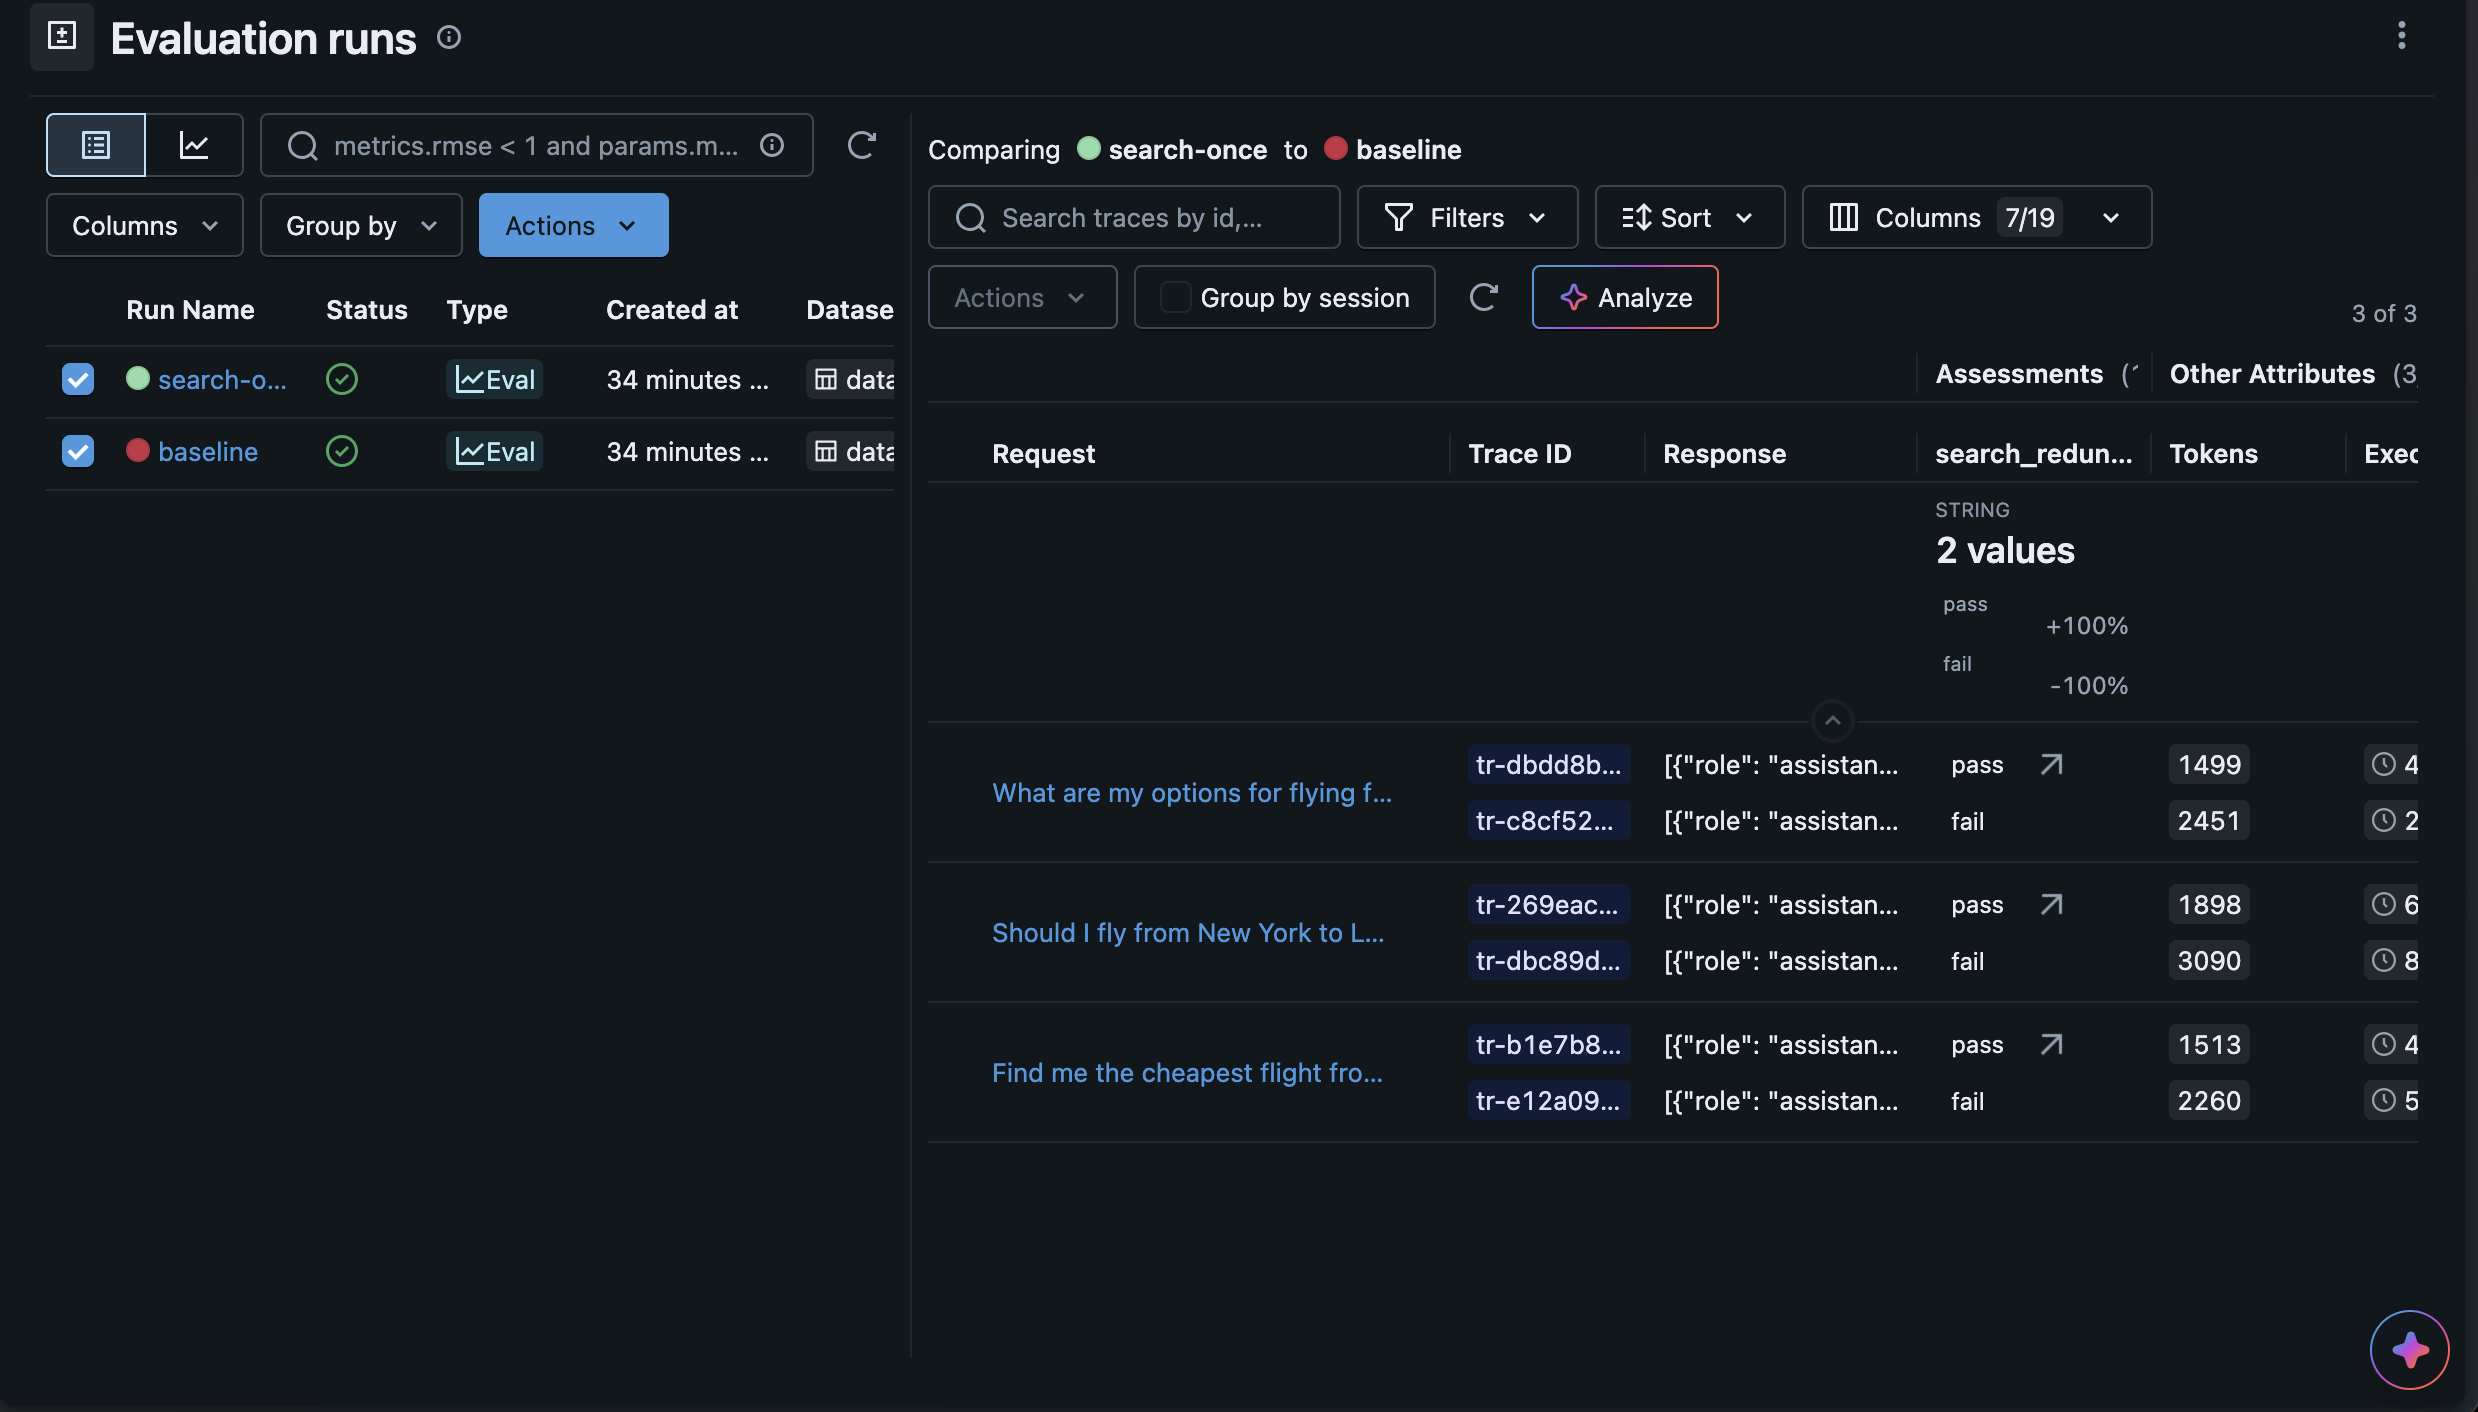
Suppose the redundancy judge fails on several traces because the system prompt tells the agent to search every route again, so you write a new system prompt without that instruction. Did it work, and did it break anything else?
Run the same helper with the new system prompt. The traces and the new evaluation run go to the same experiment, next to the baseline:
SEARCH_ONCE_PROMPT = (
    "You are a travel agent. Use the flight search tool to answer questions. "
    "Search each route at most once."
)

evaluate_agent(SEARCH_ONCE_PROMPT, run_name="search-once")
Open the experiment's Evaluation runs tab, select both runs, and choose Actions → Compare to see them side by side: whether the redundancy judge now passes, and whether the token usage on the traces went down. With the same prompts and the same judge, you keep a change only when the numbers show it helps.
Wrapping up
The Claude SDK makes it fast to build an agent. With native OTel export and MLflow, it is just as fast to know whether the agent works:
- Trace every model call by pointing a standard OTel exporter at MLflow.
- See each run as one trace, with the model calls and tool calls under one agent span.
- Find the expensive runs from the token usage on each trace.
- Score every run with an LLM judge that inspects the trace.
- Compare outcomes from different system prompts by evaluating each with the same test prompts and judge.
If you find this useful, give us a star on GitHub: github.com/mlflow/mlflow⭐️
Questions or feedback? Reach out to our community on Slack, or file a GitHub issue.