Tracking and Debugging AI Safety Evaluations with Inspect AI and MLflow

We're excited to announce the inspect-mlflow integration, which brings MLflow tracking and tracing to Inspect AI evaluations.
AI safety evaluation frameworks produce log files. When a sample fails or a model scores differently across versions, debugging means opening JSON and reading through message histories, tool calls, and scoring events by hand. There's no experiment tracking across runs, no visual span tree showing what the model did at each step, and no way to compare two evaluations side by side.
inspect-mlflow fixes this. Install the package, set two environment variables, and every evaluation automatically logs hierarchical runs with metrics, execution traces with span-level visibility, and artifacts. No code changes needed.
What Gets Tracked
The tracking hook creates a parent MLflow run for each evaluation, with a nested child run for each task. Every task run captures the model name, dataset, solver configuration, and generation parameters as MLflow parameters. Per-sample scores log as step metrics so you can see accuracy trends across the dataset. Token usage is aggregated per model, and event counts capture total model calls and tool invocations.
At the end of each task, the hook writes structured artifact tables under inspect/, per-sample results, and the full evaluation log. The screenshot below shows a task run with 17 logged metrics including accuracy, token usage, and event counts:
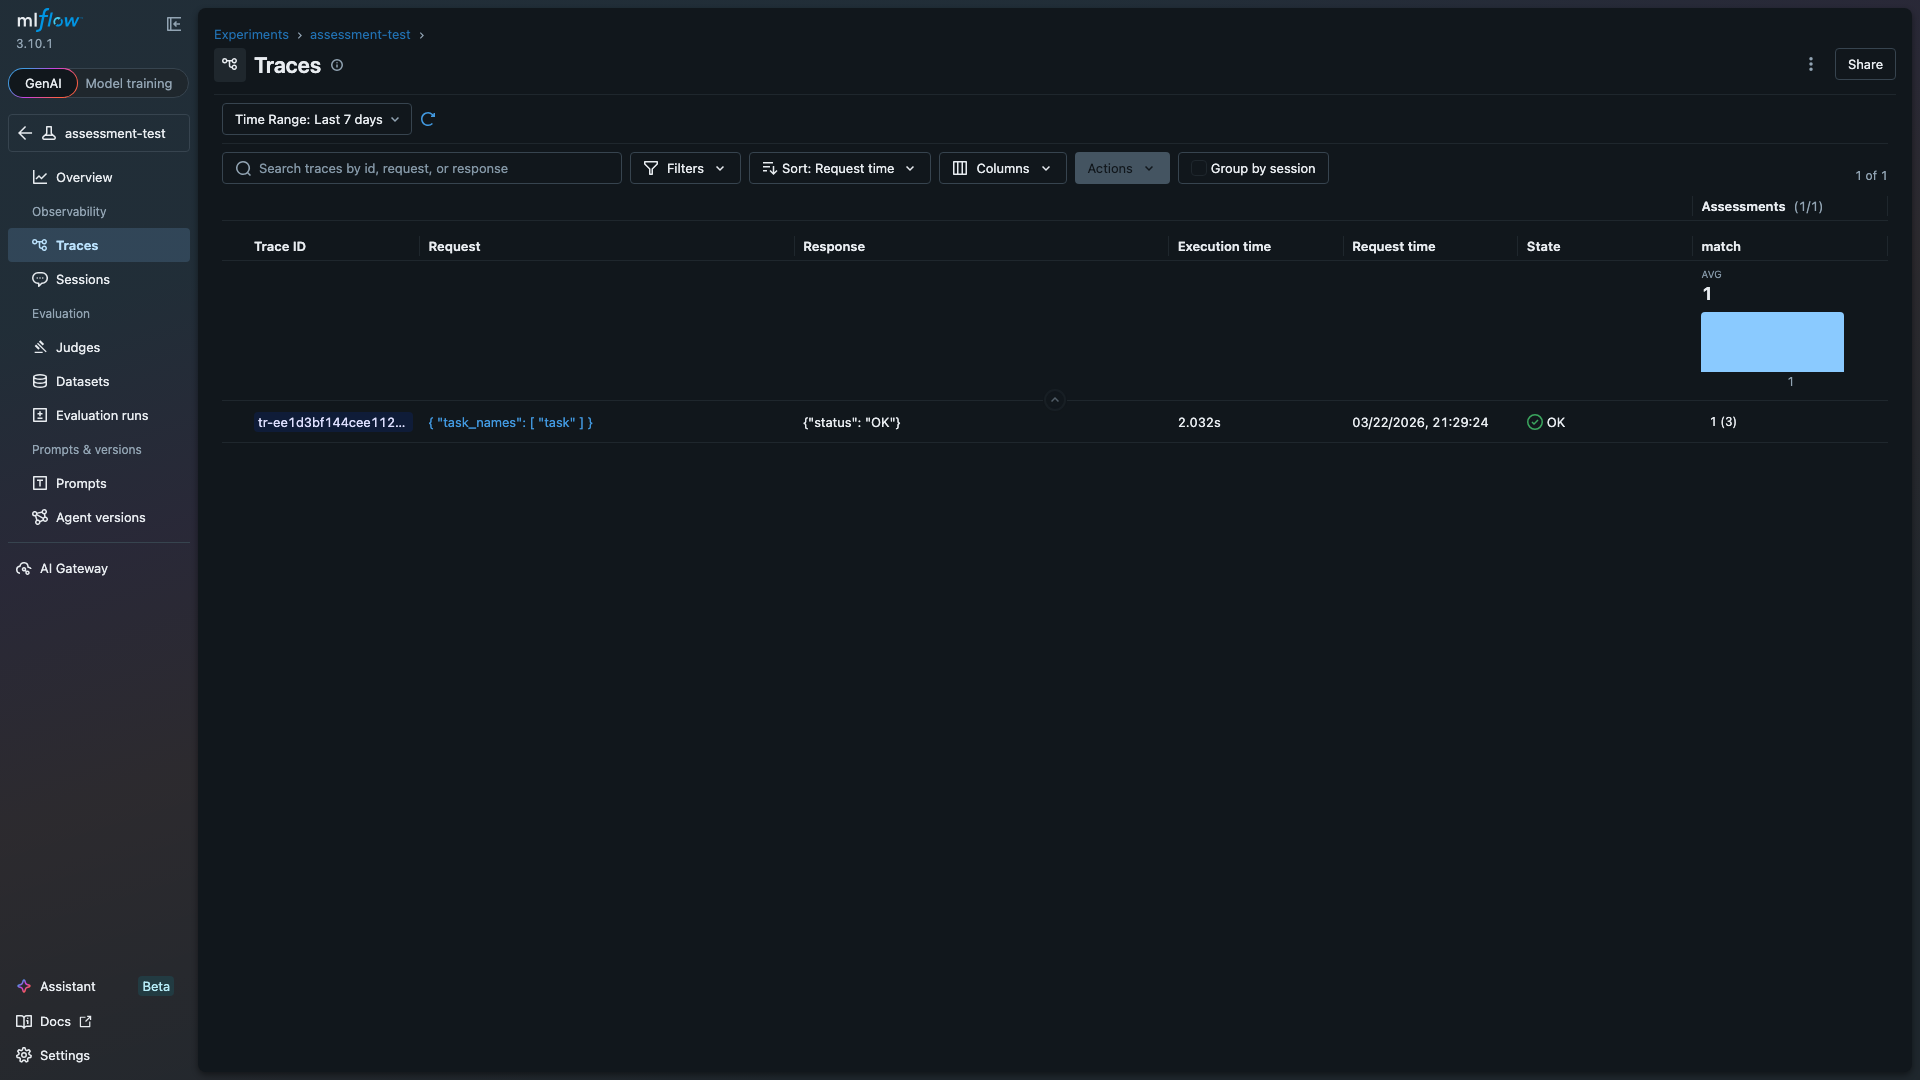
Eval scores also log as MLflow trace assessments, so they appear directly in the Traces table alongside execution time and status. This makes it possible to sort and filter traces by evaluation outcome. The "match" column below shows the average score (1.0) and per-trace assessment count (3 samples):
Debugging with Execution Traces
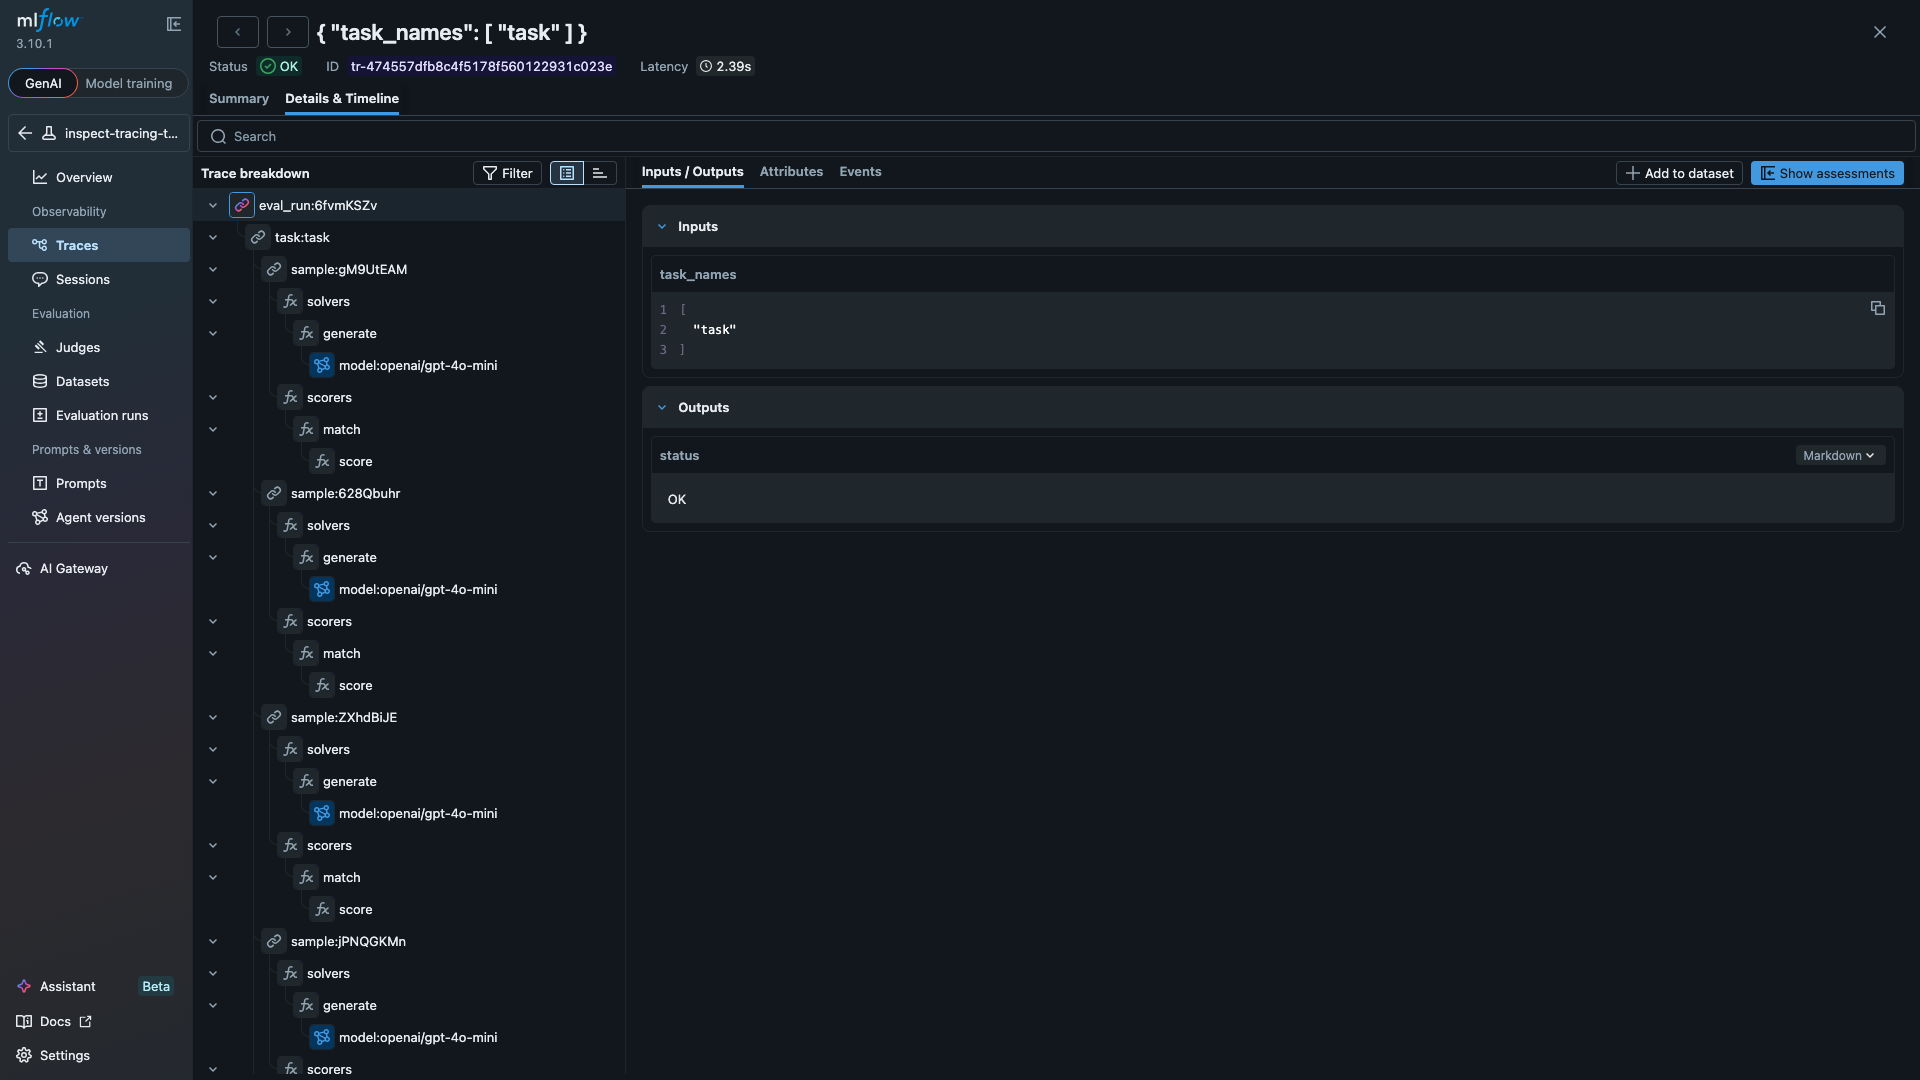
Setting MLFLOW_INSPECT_TRACING=true activates the tracing hook, which maps every evaluation event to an MLflow trace span. The span tree mirrors the eval hierarchy, so you can drill into any sample and see exactly what the model did at each step. The span tree below shows a full evaluation with three samples, each containing solver and scorer spans:
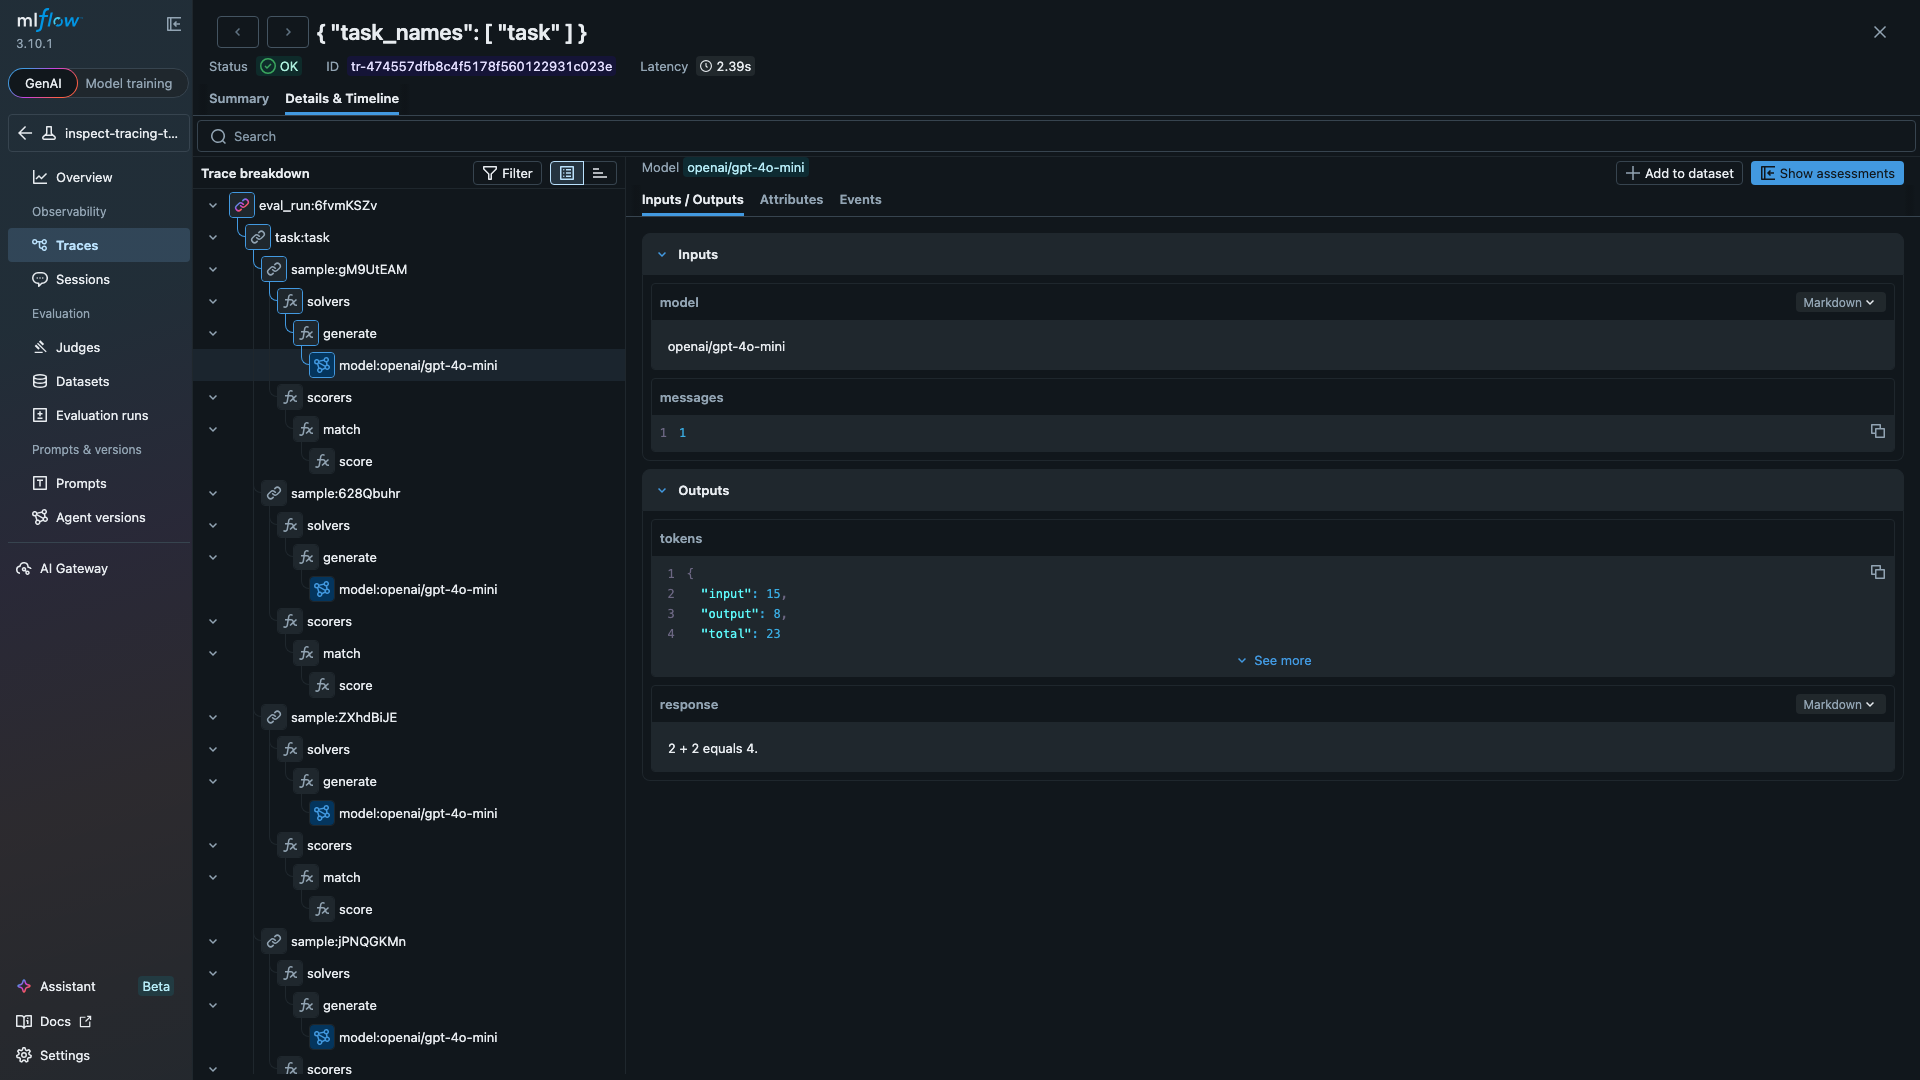
Clicking any span opens its inputs and outputs. The LLM span below shows a model call that consumed 23 tokens and returned "2 + 2 equals 4.":
The tracing hook handles tool-using agents the same way. Define a tool, add it to your solver, and each tool invocation appears as a TOOL span with the function name, arguments, and returned result. The code below is a standard Inspect AI evaluation. With MLFLOW_TRACKING_URI and MLFLOW_INSPECT_TRACING set, all runs and traces log to MLflow automatically:
from inspect_ai import Task, eval
from inspect_ai.dataset import Sample
from inspect_ai.scorer import match
from inspect_ai.solver import generate, use_tools
from inspect_ai.tool import tool

@tool
def calculator():
    """Perform arithmetic calculations."""
    async def run(expression: str) -> str:
        """Evaluate a math expression.

        Args:
            expression: e.g. "47 * 89"
        """
        return str(eval(expression, {"__builtins__": {}}))
    return run

task = Task(
    dataset=[
        Sample(input="Use the calculator to compute 47 * 89.", target="4183"),
        Sample(input="Use the calculator to compute 1024 / 16.", target="64"),
    ],
    solver=[use_tools([calculator()]), generate()],
    scorer=match(),
)

logs = eval(task, model="openai/gpt-4o-mini")
Beyond Tracking
The package also includes a Scout import for analyzing agent transcripts with Inspect Scout, and a compare_evals() function that aligns samples across two evaluation logs and runs significance tests. See the documentation for details on both.
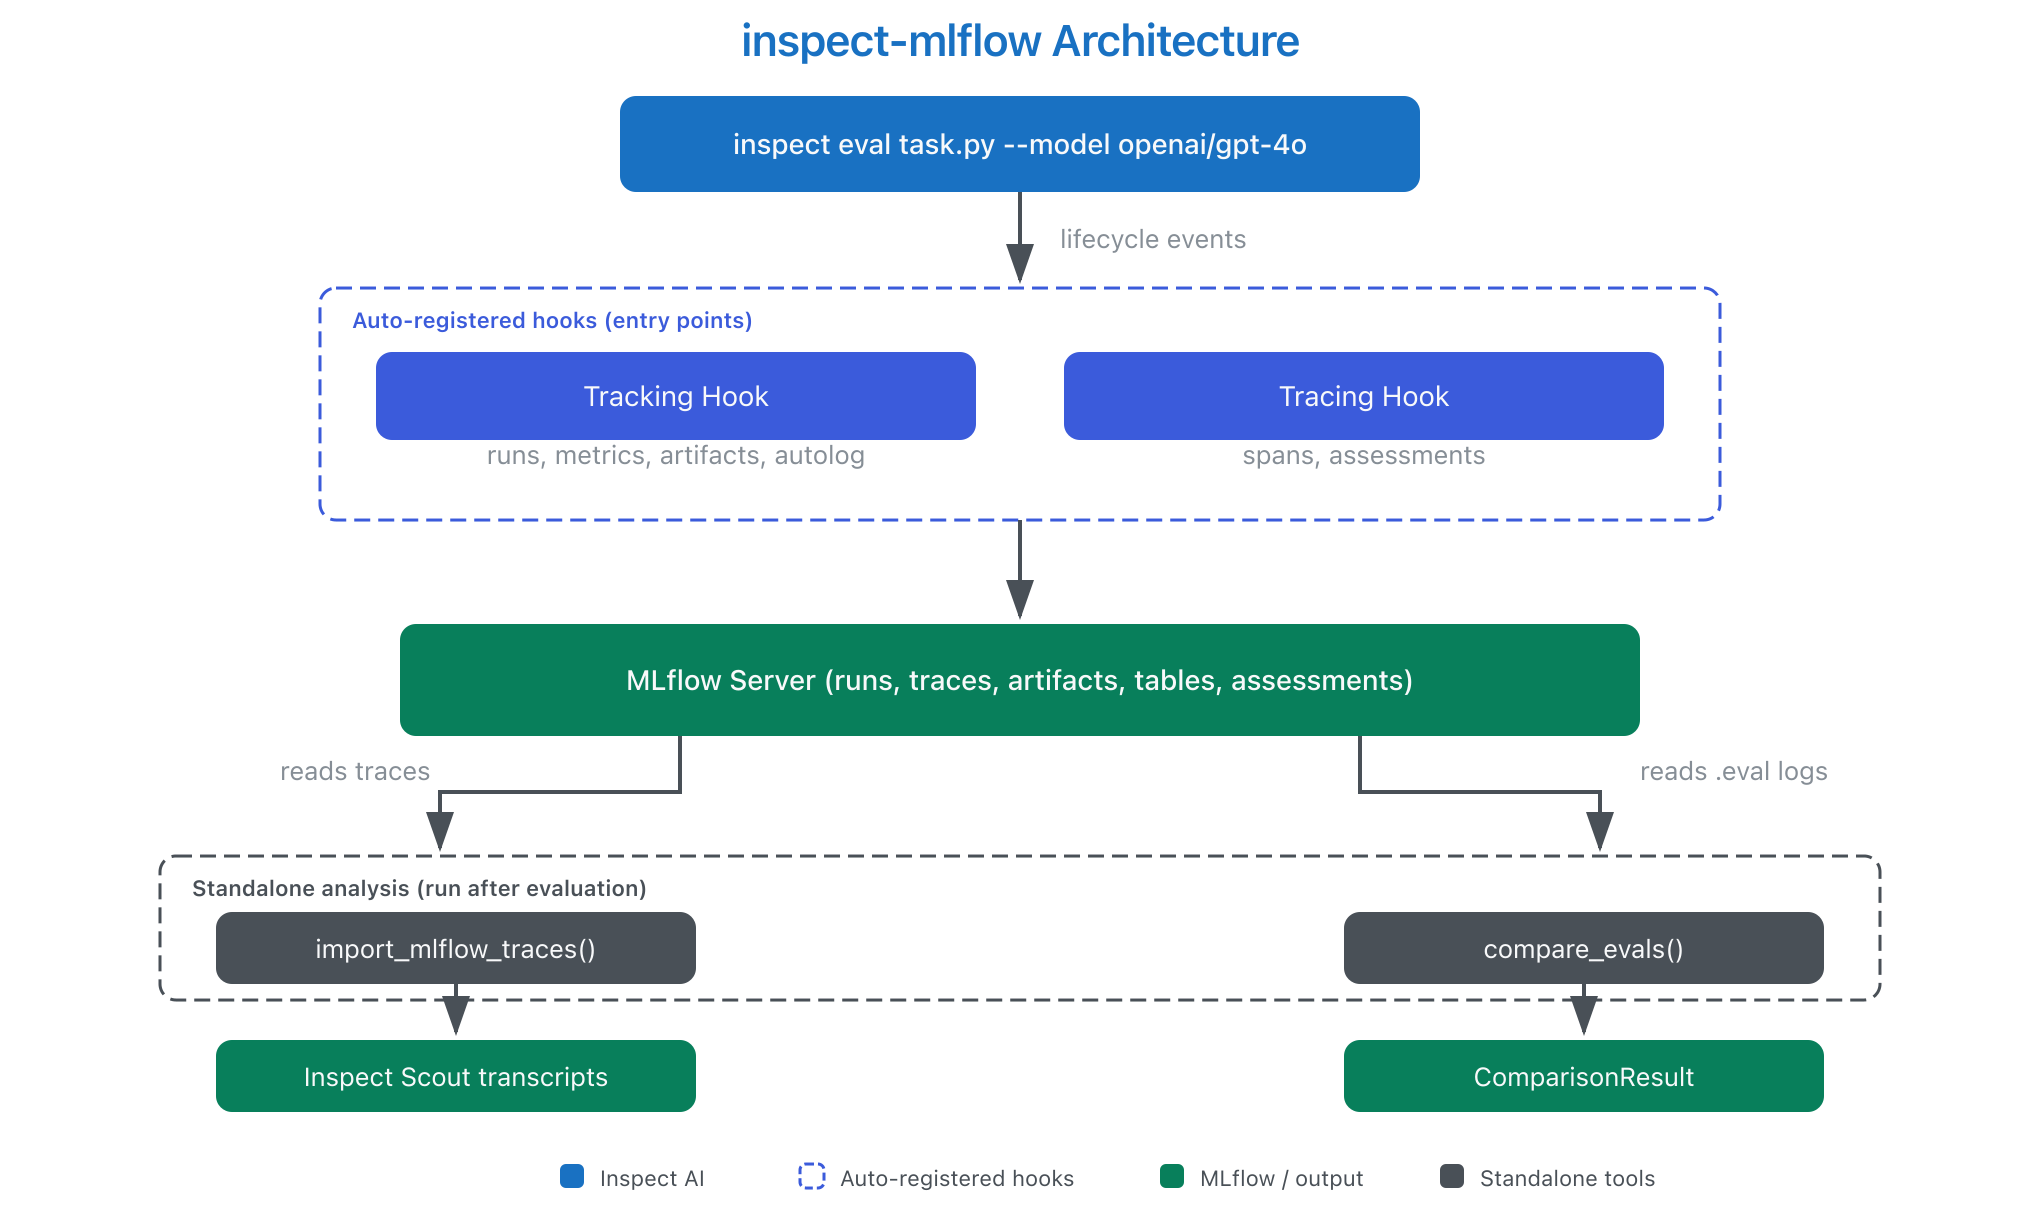
How It Works
Inspect AI fires lifecycle hooks during evaluation. The tracking and tracing hooks capture those events and write them to MLflow:
Getting Started
Install the package and point it at an MLflow server:
pip install 'inspect-mlflow' 'mlflow>=3.0'
export MLFLOW_TRACKING_URI="http://localhost:5000"
export MLFLOW_INSPECT_TRACING="true"
inspect eval my_task.py --model openai/gpt-4o
See the package documentation for configuration options and examples.
Resources
- MLflow Tracing Documentation
- MLflow Evaluation & Monitoring
- inspect-mlflow on PyPI
- inspect-mlflow documentation
- Inspect AI Extensions page
Provenance
I (Debu Sinha) built the inspect-mlflow package. The underlying hooks were developed across four PRs to the Inspect AI repository, reviewed and merged by JJ Allaire. Farnaz Kohankhaki (Vector Institute and National Research Council of Canada) contributed autolog support and structured artifact tables. The package is listed on the Inspect AI Extensions page.