5 Tips to Get More Out of Your Claude Code with MLflow

Claude Code is a powerful coding agent that helps you write code, automate workflows, design features, and so much more. Engineers are using it to ship features in hours instead of days, and it's quickly becoming an indispensable tool for developers. In this blog, we will show you five tips on how to enhance your Claude Code experience and level up your workflow as an AI engineer, using MLflow, the open-source platform for adding observability and control into AI/ML workflows.
Part 1: See What Coding Agents Actually Do
The first step to getting more out of Claude Code is understanding what it's doing. These tips give you full visibility into your sessions: what tokens were spent, which tools fired, and whether the output actually meets your bar.
Tip 1: Monitoring Claude Code Usage Patterns
Claude Code is powerful, but it can also be a black box. You give it a task, it gives you a result, but you have no visibility into how it got there. But what did it actually do under the hood? How many tokens did it burn? Which tools did it call, and in what order? If you're using customization knobs like skills, sub-agents, batch operations, how can you prove they are actually used and improve the output?
You could scroll through the conversation history and compare between the previous and current results, but it is very inefficient.
Here is where MLflow comes in. MLflow's Tracing capability gives you full transparency into Claude Code sessions, tools, and errors, helping you monitor usage patterns and diagnose issues.
To start tracing your Claude Code sessions, run a single command in your project. Alternatively, you can set up the hook at the user level by following the guide here.
mlflow autolog claude
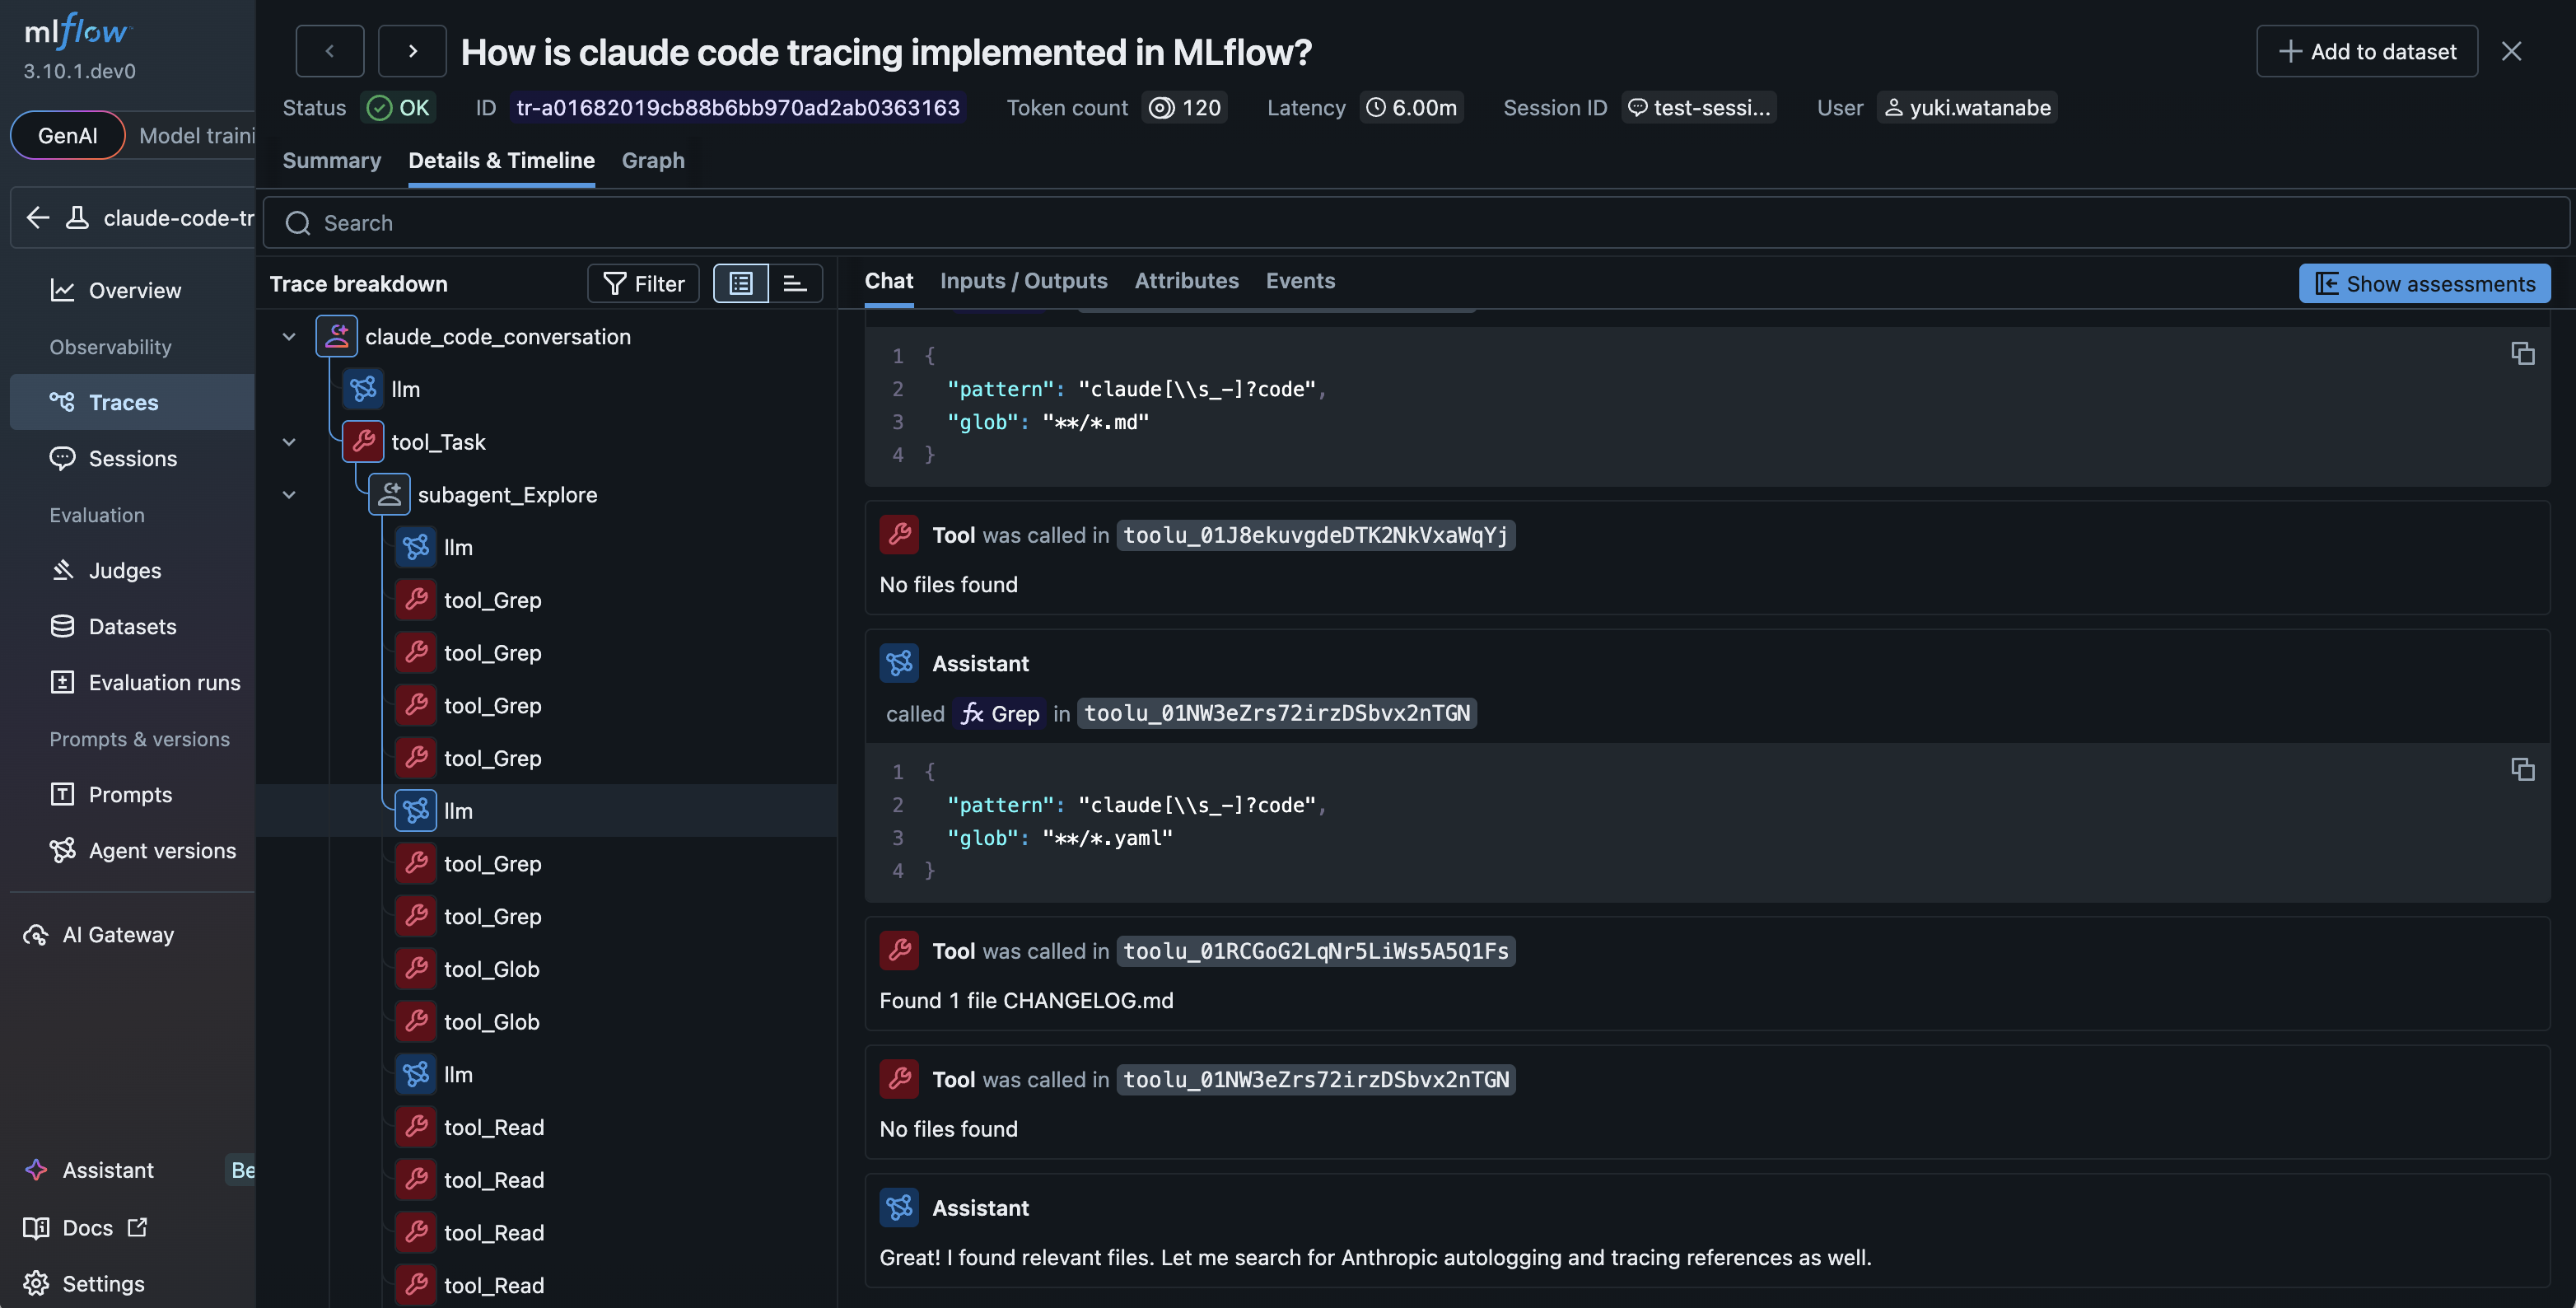
That's it. Run this and use Claude Code as you normally would, and MLflow captures things like input text passed to Claude Code, context changes during the session, tool usage, token counts, latency, and more. Every interaction becomes a structured trace you can search, filter, and analyze. This works for both CLI sessions and the SDK (programmatic usage).
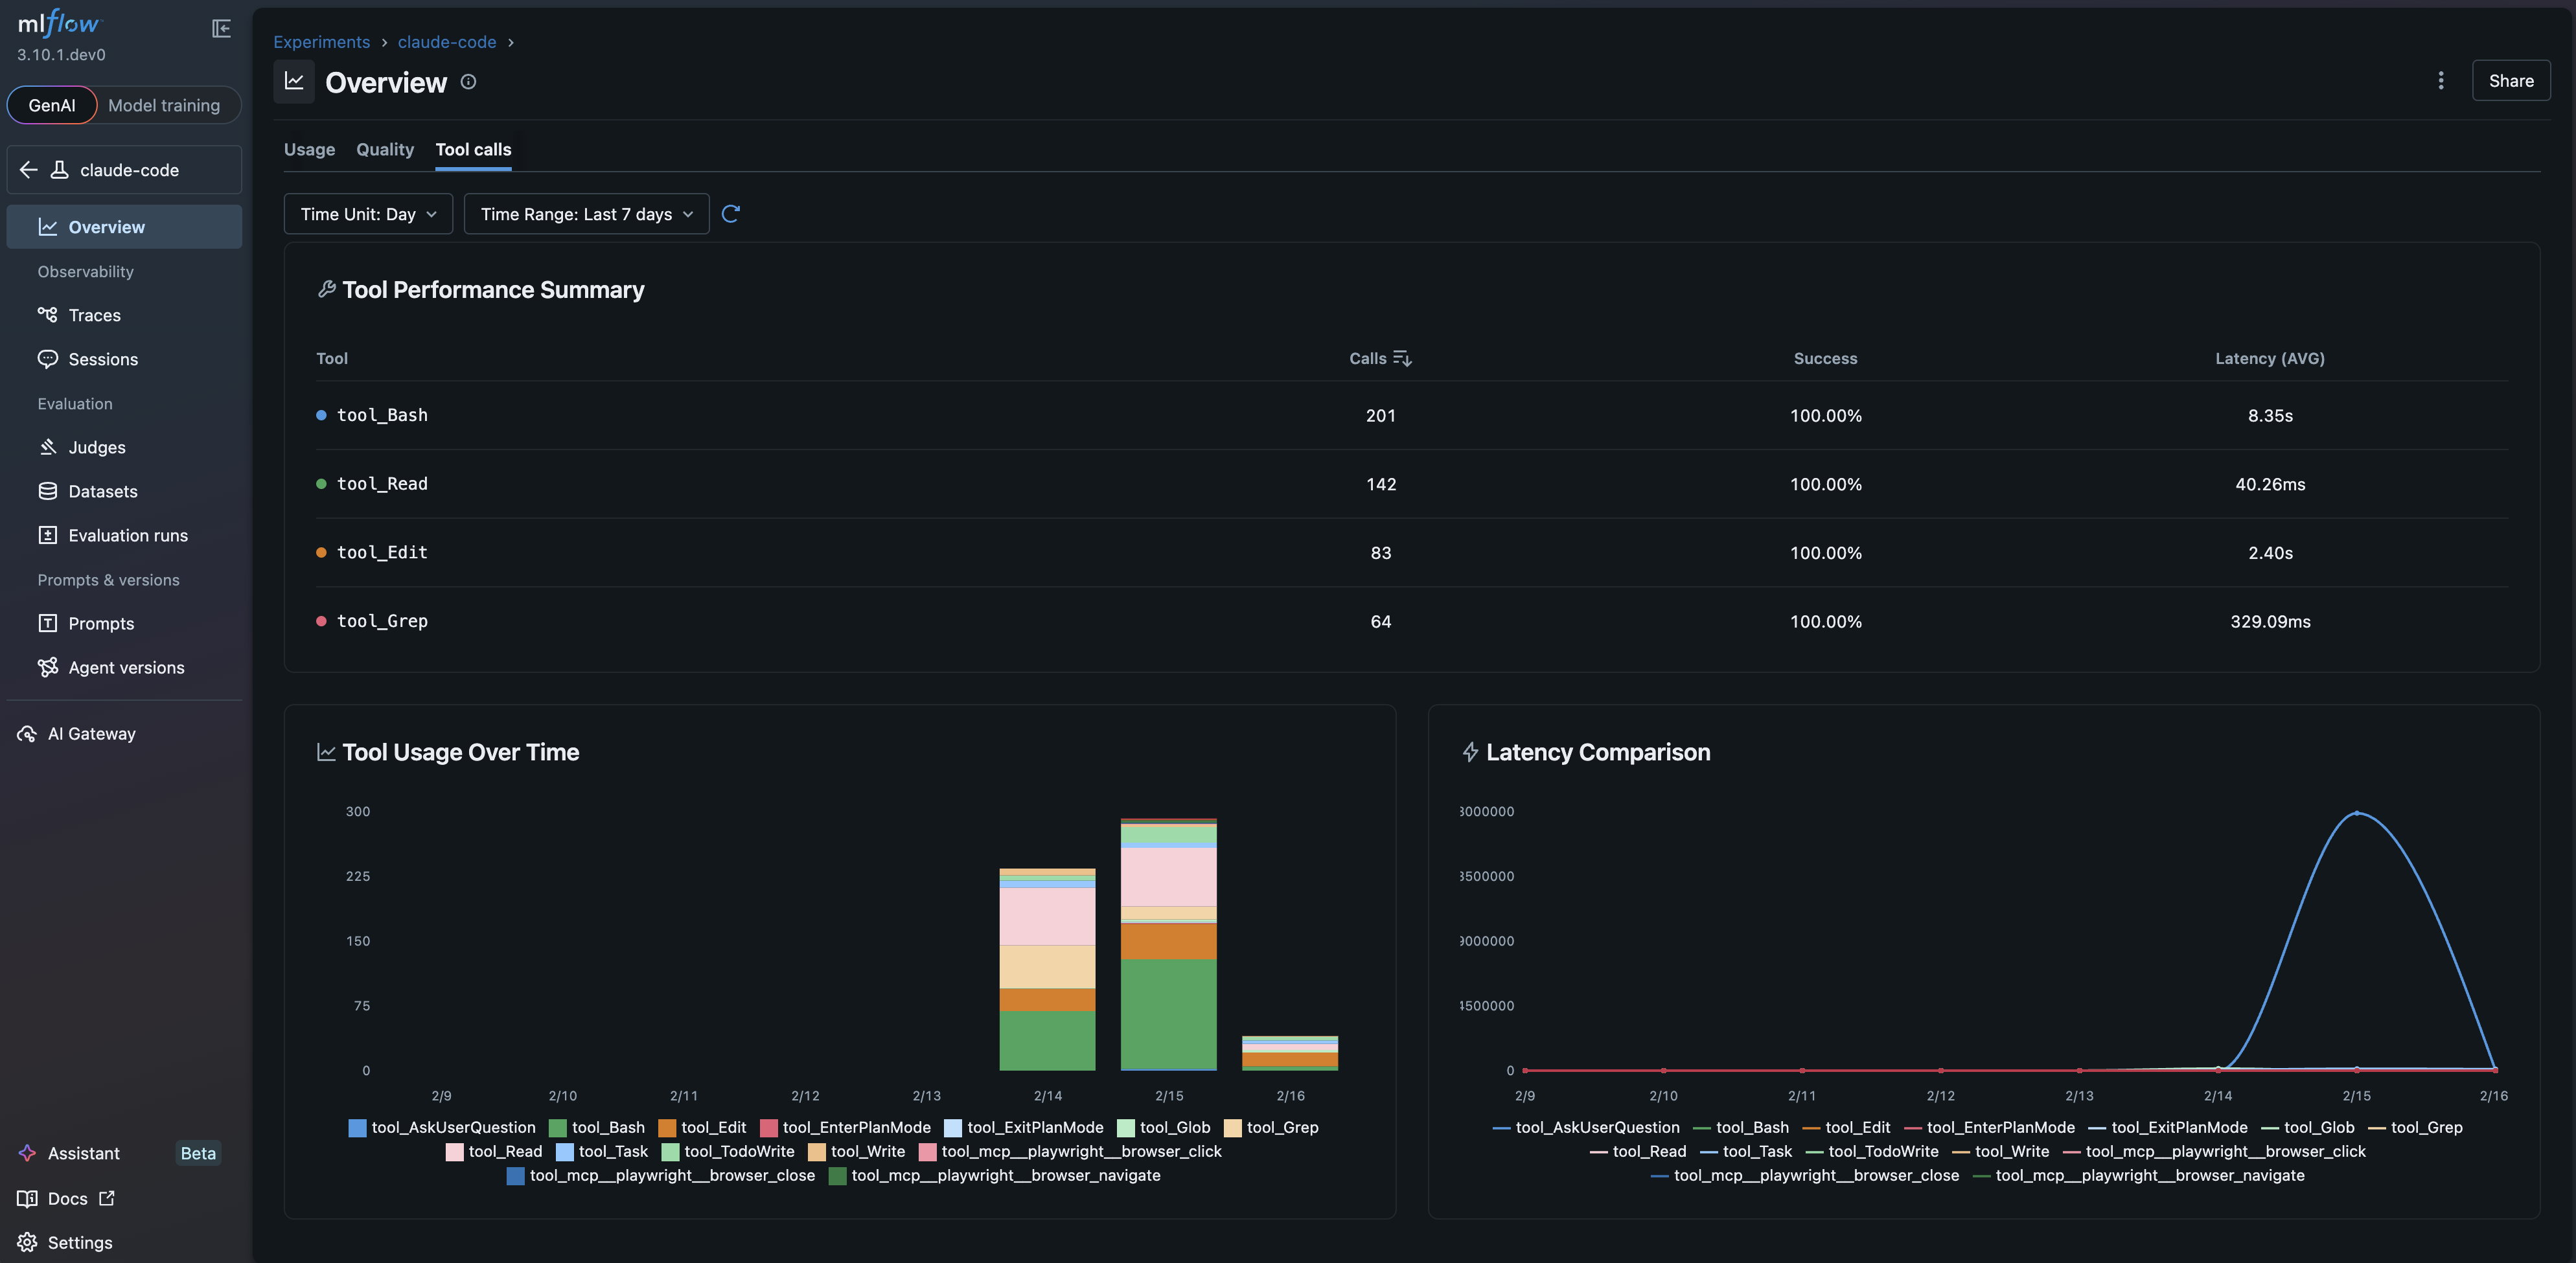
The individual trace captured by MLflow includes rich information about the session. Important statistics and metadata are automatically extracted and logged as trace attributes, making it easy to monitor key metrics like token usage, latency, and tool calls across all your sessions. You can even set up custom dashboards to track these metrics over time.
Tip 2: Measuring How Claude Code Performs
Tracing Claude Code unlocks another powerful capability: testing and evaluation. Claude Code is highly customizable, so you can define your own skills and sub-agents to fit your needs. However, oftentimes we just add more and more tools, skills, commands, without actually testing whether they are useful or not. They can take up the context window and silently degrade the performance of the coding agent, without us noticing.
With MLflow, you can run arbitrary testing criteria against Claude Code by using its Trace Evaluation capability. Once traces are recorded into MLflow by the mlflow autolog claude command, you can run various built-in scorers, LLM judges, and custom code scorers.
@scorer
def tool_recall(trace, expectations) -> Feedback:
    """
    Check if expected tools were used in the trace.
    Returns recall: (tools used that were expected) / (total expected tools)
    """
    expected_tools = set(expectations.get("expected_tools", []))

    # Get actual tools from trace spans
    tool_spans = trace.search_spans(span_type="TOOL")
    actual_tools = {span.name.replace("tool_", "") for span in tool_spans}

    # Calculate recall
    matched = expected_tools & actual_tools
    recall = len(matched) / len(expected_tools)
    return Feedback(value=recall, rationale=f"Expected: {expected_tools}, Found: {actual_tools}")

@scorer
def num_permission_block(trace) -> int:
    """
    Check how many times the agent encountered a permission block.
    """
    permission_block = 0
    for span in trace.search_spans(span_type="TOOL"):
        if span.outputs and isinstance(span.outputs, dict) and "result" in span.outputs:
            result = span.outputs["result"]
            if "requires approval" in result.lower() or "was blocked." in result.lower():
                permission_block += 1
    return permission_block
import mlflow
from mlflow.genai.scorers import ConversationCompleteness, RelevanceToQuery

# Load generated Claude Code traces from MLflow
traces = mlflow.search_traces(experiment_ids=["<experiment-id>"], max_results=20)

# Run evaluation against the traces
results = mlflow.genai.evaluate(
    data=traces,
    scorers=[
        tool_recall,
        num_permission_block,
        ConversationCompleteness(),
        RelevanceToQuery(),
    ],
)
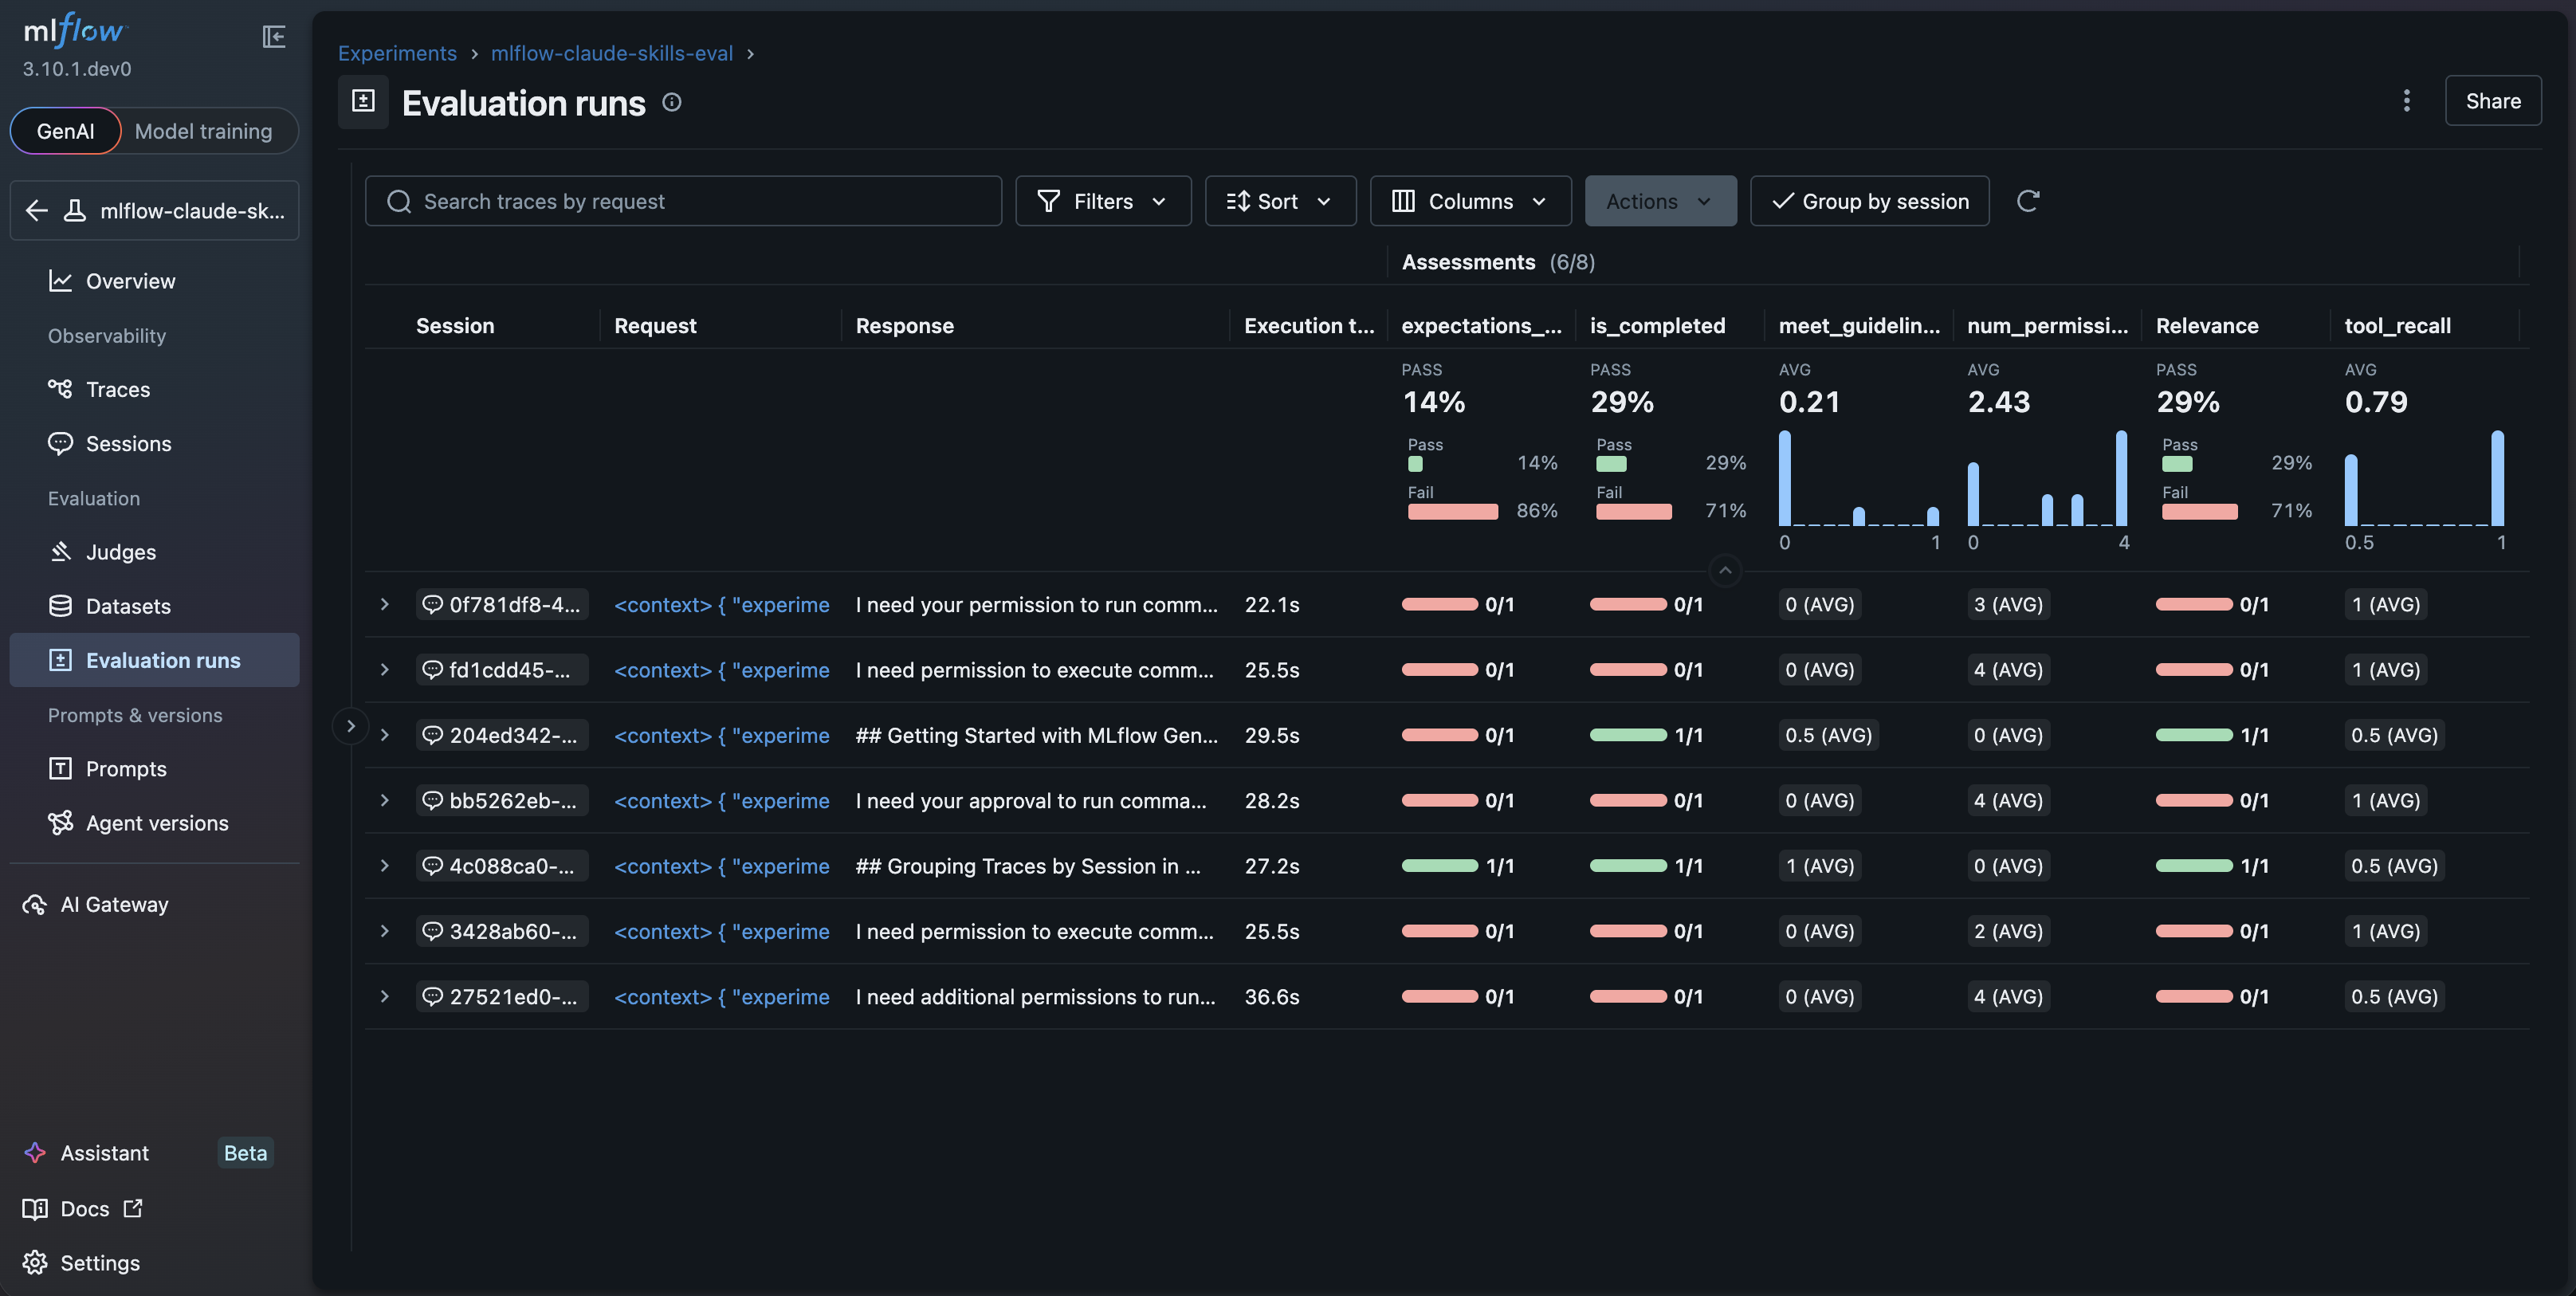
Each Claude Code execution session is assessed across multiple criteria, with clear indicators and detailed rationale from the judge. This is especially powerful for skills and sub-agents that run unattended. You build the automation, define evaluation criteria, and MLflow tells you whether it's working reliably across every dimension you care about.
Part 2: Enhance Your Development Workflow
Observability is the foundation, but MLflow can do more than watch. It can actively participate in your Claude Code workflow, turning your coding agent into a first-class citizen of your AI development stack. If you're building AI agents or LLM applications, this is where things get interesting.
Tip 3: Using MLflow as a Tool
So far we have seen how to use MLflow to monitor and evaluate Claude Code. However, MLflow can also be used as a tool to enhance your Claude Code workflow.
MLflow MCP Server
MLflow supports Model Context Protocol (MCP) for connecting Claude Code or various other coding agents and LLM frameworks directly to MLflow.
To use it, start the MLflow Tracking Server as usual and then add this to your .claude/settings.json:
{
  "mcpServers": {
    "mlflow-mcp": {
      "command": "uv",
      "args": ["run", "--with", "mlflow[mcp]>=3.5.1", "mlflow", "mcp", "run"],
      "env": {
        "MLFLOW_TRACKING_URI": "<MLFLOW_TRACKING_URI>"
      }
    }
  }
}
Now Claude Code can search traces, log feedback, query metrics, and manage experiments. For more details about available tools and setup instructions for other frameworks, see MLflow MCP Server docs.
MLflow CLI
Another way for Claude Code to interact with services is to use the Command Line Interface (CLI). While MCP provides a narrower scope of tools and their interfaces, CLI gives Claude Code more freedom to chain multiple commands into custom workflows.
MLflow has been built as a CLI-friendly tool for years. Almost every action you can take in the MLflow UI can be done via CLI. This gives you a powerful way for Claude Code to interact with MLflow.
Here are some examples of how it can use CLI to interact with MLflow:
- Use
mlflow traces searchto search traces from MLflow Tracking Server and analyze them. - Use
mlflow runs describeto get detailed information about a specific run. - Use
mlflow deployments list-endpointsto list all the deployed endpoints and further inspect the details.
Choose MCP for structured tool access and CLI for ad-hoc or scripted workflows.
Tip 4: Automating Workflows with MLflow Skills
In the day-to-day work of AI engineers, there are many manual repetitive tasks such as debugging errors in traces, generating a report from evaluation results, monitoring metric trends, etc. Claude Code can help you with these tasks, but it needs to be trained to do so.
While the MCP server and CLI give Claude Code essential building blocks to interact with MLflow, they do not tell it how to combine them to form a workflow. Skills are a way to package a set of instructions to teach an agent how to perform specific tasks or workflows.
MLflow provides an official skills package mlflow/skills that covers a wide range of tasks such as trace analysis, agent evaluation, metrics querying, and debugging. Just by installing these skills, your coding agent becomes a full-fledged MLflow expert and helps you with your daily work.
npx skills add mlflow/skills
This adds official MLflow skills to your Claude Code, enabling it to handle trace analysis, agent evaluation, metrics querying, and debugging out of the box.
Tip 5: MLflow Assistant, Powered by Claude Code
We have been talking about how to use Claude Code CLI with MLflow to boost your productivity. However, what if you could run Claude Code directly inside MLflow?
MLflow Assistant makes this possible. It is a Claude Code-powered assistant that is embedded directly in the MLflow UI and helps you with your MLflow-related tasks.
MLflow Assistant eliminates that context-switching entirely. You no longer need to copy and paste IDs, error stack traces, or evaluation results back and forth between the UI and the terminal. Claude Code now shares the same context of what you are seeing in the UI, such as which traces, runs, and evaluations you are looking at, and works like another AI engineer sitting next to your desk.
Moreover, it doesn't just understand MLflow data. It also understands your project's codebase. It can connect a failing trace back to the actual code that produced it, suggest fixes, and set up tracing or evaluation pipelines tailored to your stack. The combination of MLflow's UI context and Claude Code's deep codebase awareness is where it gets truly powerful.
Since it uses your existing Claude Code subscription, no extra API keys and no additional cost. Everything runs locally with full transparency. Get started by configuring the Assistant in the MLflow UI and follow the docs to customize it to your needs.
Summary
Coding agents are powerful, but without observability, they are a black box. MLflow bridges that gap so you can see what your agent does, prove it works, and automate with confidence:
- Trace every session with a single command to understand token usage, tool calls, and latency.
- Evaluate recorded traces with LLM judges and custom scorers to catch regressions before they ship.
- Connect Claude Code to MLflow via MCP or CLI so the agent can query your data directly.
- Automate repetitive MLflow workflows by installing official skills.
- Assist from inside the MLflow UI itself, with no more copy-pasting between terminal and dashboard.
Coding agents are reshaping how software gets built, and we believe the infrastructure around them should be open. MLflow is committed to becoming a coding-agent native platform, built in the open, for the community, with first-class support for the agentic workflows that are quickly becoming the norm. These integrations are just the beginning. Expect deeper agent integrations, richer evaluation frameworks, and more automation, all open source.
If this is useful, give us a star on GitHub: github.com/mlflow/mlflow
Have questions or feedback? Open an issue or join the conversation in the MLflow community.