Evaluating (Production) Traces
Traces are the core data of MLflow. They capture the complete execution flow of your LLM applications. Evaluating traces is a powerful way to understand the performance of your LLM applications and get insights for quality improvement.
Evaluating traces is also a useful trick for offline evaluation. Instead of running prediction on every evaluation run, you can generate traces at once and re-use them for multiple evaluation runs, to reduce the computation and LLM costs.
Workflow
Annotate traces with ground truth (Optional)
Add expected outputs and ground truth labels to traces to establish evaluation baselines and correct answers.
Search and retrieve traces
Find and collect traces from your MLflow tracking server using filters for time range, experiment, or trace status.
Define scorers
Create built-in and custom scorers to measure quality, accuracy, latency, and trace-specific metrics.
Run evaluation
Execute the evaluation on your trace collection and analyze results in MLflow UI for insights.
Example: Evaluating Production Traces
Prerequisites
First, install the required packages by running the following command:
pip install --upgrade mlflow>=3.3 openai
MLflow stores evaluation results in a tracking server. Connect your local environment to the tracking server by one of the following methods.
- Local (pip)
- Local (docker)
- Remote MLflow Server
- Databricks
For the fastest setup, you can install the mlflow Python package and run MLflow locally:
mlflow ui --backend-store-uri sqlite:///mlflow.db --port 5000
This will start the server at port 5000 on your local machine. Connect your notebook/IDE to the server by setting the tracking URI. You can also access to the MLflow UI at http://localhost:5000.
import mlflow

mlflow.set_tracking_uri("http://localhost:5000")
You can also brows the MLflow UI at http://localhost:5000.
MLflow provides a Docker Compose file to start a local MLflow server with a postgres database and a minio server.
git clone https://github.com/mlflow/mlflow.git
cd docker-compose
cp .env.dev.example .env
docker compose up -d
This will start the server at port 5000 on your local machine. Connect your notebook/IDE to the server by setting the tracking URI. You can also access to the MLflow UI at http://localhost:5000.
import mlflow

mlflow.set_tracking_uri("http://localhost:5000")
Refer to the instruction for more details, e.g., overriding the default environment variables.
If you have a remote MLflow tracking server, configure the connection:
import os
import mlflow

# Set your MLflow tracking URI
os.environ["MLFLOW_TRACKING_URI"] = "http://your-mlflow-server:5000"
# Or directly in code
mlflow.set_tracking_uri("http://your-mlflow-server:5000")
If you have a Databricks account, configure the connection:
import mlflow

mlflow.login()
This will prompt you for your configuration details (Databricks Host url and a PAT).
If you are unsure about how to set up an MLflow tracking server, you can start with the cloud-based MLflow powered by Databricks: Sign up for free →
Step 0: Simulate Production Traces
First, let's simulate some production traces to use for evaluation. Here we define a simple email automation app that uses a CRM database to generate emails. If you already have traces, you can skip this step.
import mlflow
from mlflow.entities import Document
import openai

client = openai.OpenAI()
mlflow.openai.autolog()  # Enable automatic tracing for OpenAI calls

# Simulated CRM database
CRM_DATA = {
    "Acme Corp": {
        "contact_name": "Alice Chen",
        "recent_meeting": "Product demo on Monday, very interested in enterprise features. They asked about: advanced analytics, real-time dashboards, API integrations, custom reporting, multi-user support, SSO authentication, data export capabilities, and pricing for 500+ users",
        "support_tickets": [
            "Ticket #123: API latency issue (resolved last week)",
            "Ticket #124: Feature request for bulk import",
            "Ticket #125: Question about GDPR compliance",
        ],
    },
    "TechStart": {
        "contact_name": "Bob Martinez",
        "recent_meeting": "Initial sales call last Thursday, requested pricing",
        "support_tickets": [
            "Ticket #456: Login issues (open - critical)",
            "Ticket #457: Performance degradation reported",
            "Ticket #458: Integration failing with their CRM",
        ],
    },
    "Global Retail": {
        "contact_name": "Carol Wang",
        "recent_meeting": "Quarterly review yesterday, happy with platform performance",
        "support_tickets": [],
    },
}


@mlflow.trace(span_type="RETRIEVER")
def retrieve_customer_info(customer_name: str) -> list[Document]:
    """Retrieve customer information from CRM database"""
    if data := CRM_DATA.get(customer_name):
        return [
            Document(
                id=f"{customer_name}_meeting",
                page_content=f"Recent meeting: {data['recent_meeting']}",
            ),
            Document(
                id=f"{customer_name}_tickets",
                page_content=f"Support tickets: {', '.join(data['support_tickets']) if data['support_tickets'] else 'No open tickets'}",
            ),
            Document(
                id=f"{customer_name}_contact",
                page_content=f"Contact: {data['contact_name']}",
            ),
        ]
    return []


@mlflow.trace(span_type="AGENT")
def generate_sales_email(customer_name: str, objective: str) -> dict[str, str]:
    """Generate personalized sales email based on customer data & given objective."""
    # Retrieve customer information
    customer_docs = retrieve_customer_info(customer_name)
    context = "\n".join([doc.page_content for doc in customer_docs])

    # Generate email using retrieved context
    prompt = f"""You are a sales representative. Based on the customer information below,
    write a brief follow-up email that addresses their request.

    Customer Information: {context}

    User instructions: {objective}"""

    response = client.chat.completions.create(
        model="gpt-4o-mini",
        messages=[{"role": "user", "content": prompt}],
        max_tokens=2000,
    )
    return {"email": response.choices[0].message.content}
Let's run the app and generate some traces.
test_requests = [
    {"customer_name": "Acme Corp", "user_instructions": "Follow up after product demo"},
    {
        "customer_name": "TechStart",
        "user_instructions": "Check on support ticket status",
    },
    {
        "customer_name": "Global Retail",
        "user_instructions": "Send quarterly review summary",
    },
    {
        "customer_name": "Acme Corp",
        "user_instructions": "Write a very detailed email explaining all our product features, pricing tiers, implementation timeline, and support options",
    },
    {
        "customer_name": "TechStart",
        "user_instructions": "Send an enthusiastic thank you for their business!",
    },
    {"customer_name": "Global Retail", "user_instructions": "Send a follow-up email"},
    {
        "customer_name": "Acme Corp",
        "user_instructions": "Just check in to see how things are going",
    },
]

# Run requests and capture traces
print("Simulating production traffic...")
for req in test_requests:
    try:
        result = generate_sales_email(**req)
        print(f"✓ Generated email for {req['customer_name']}")
    except Exception as e:
        print(f"✗ Error for {req['customer_name']}: {e}")
This generates a list of traces as follows:
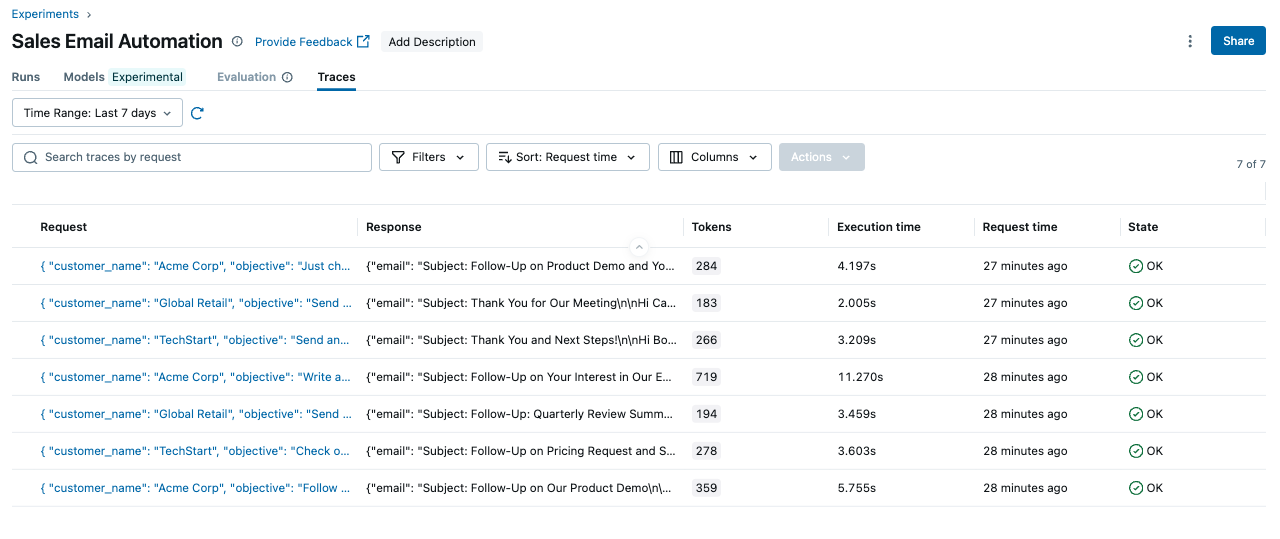
Step 1: Search and retrieve traces
Traces stored in the MLflow backend can be retrieved using the mlflow.search_traces() API.
The following code retrieves all traces from the last 24 hours. See Query Traces via SDK for the full supported syntax.
import mlflow
from datetime import datetime, timedelta

# Get traces from the last 24 hours
yesterday = datetime.now() - timedelta(days=1)
traces = mlflow.search_traces(
    filter_string=f"timestamp > {int(yesterday.timestamp() * 1000)}"
)
The API returns a set of traces as a pandas DataFrame, where various data in the trace is expanded into columns. The dataframe can be directly passed into the mlflow.genai.evaluate() function for evaluation.
Step 2: Define application-specific scorers
Scorer is the core component of evaluation, which defines the criteria for evaluating the quality of the traces. MLflow provides a set of built-in scorers for common evaluation criteria, and you can also define your own custom scorers for application-specific criteria.
In this example, we use three different types of scorers:
- RetrievalGroundedness: Built-in scorer checks if the output is grounded in the retrieved data.
- RelevanceToQuery: Built-in scorer checks if the output is relevant to the user's request.
- Guidelines: Built-in scorer that allows you to judge the output against custom guidelines using LLMs.
These scorers uses LLM for judging the criteria. The default model is openai:/gpt-4.1-mini. You can also specify a different model by passing the model parameter to the scorer constructor.
email_scorers = [
    RetrievalGroundedness(),
    RelevanceToQuery(),  # Checks if email addresses the user's request
    Guidelines(
        name="follows_objective",
        guidelines="The generated email must follow the objective in the request.",
    ),
    Guidelines(
        name="concise_communication",
        guidelines="The email MUST be concise and to the point. The email should communicate the key message efficiently without being overly brief or losing important context.",
    ),
    Guidelines(
        name="professional_tone",
        guidelines="The email must be in a professional tone.",
    ),
]
Scorers have access to the complete MLflow traces, including spans, attributes, and outputs. This allows you to evaluate the agent's behavior precisely, not only the final output, such as the tool call trajectory, the sub-agents routing, the retrieved document recall, etc. See Parsing Traces for Scoring for more details.
Step 3: Evaluate trace quality
Now we are ready to run the evaluation. One notable difference from other examples is that we don't need to specify a predict_fn function. The mlflow.genai.evaluate() function will automatically extract the inputs, outputs, and other intermediate information from the trace object and use them for scoring.
results = mlflow.genai.evaluate(
    data=traces,
    scorers=email_scorers,
)
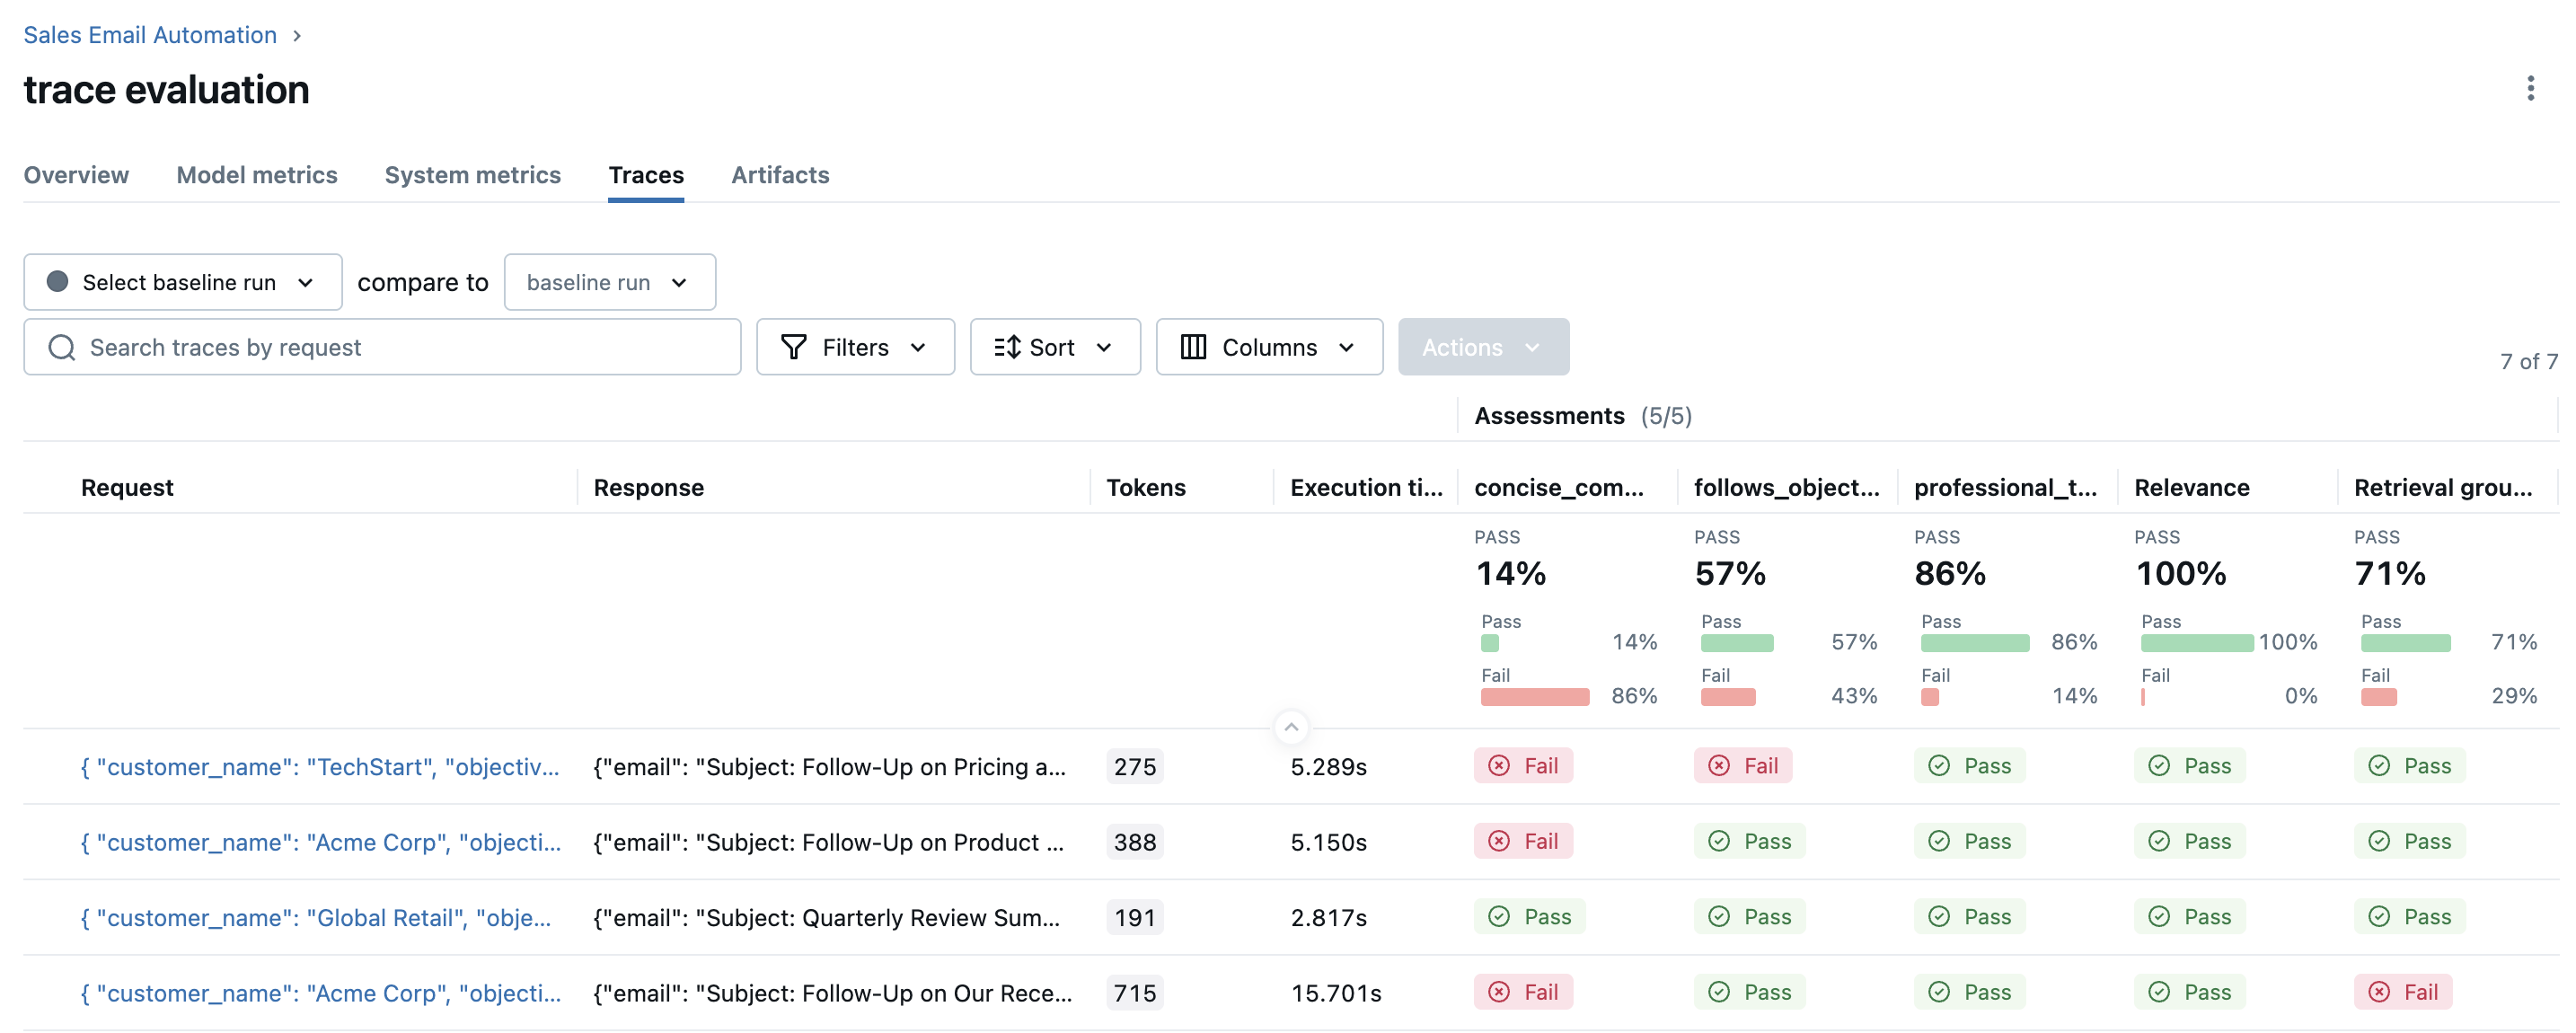
Once the evaluation is done, open the MLflow UI in your browser and navigate to the experiment page. You should see MLflow creates a new Run and logs the evaluation results.
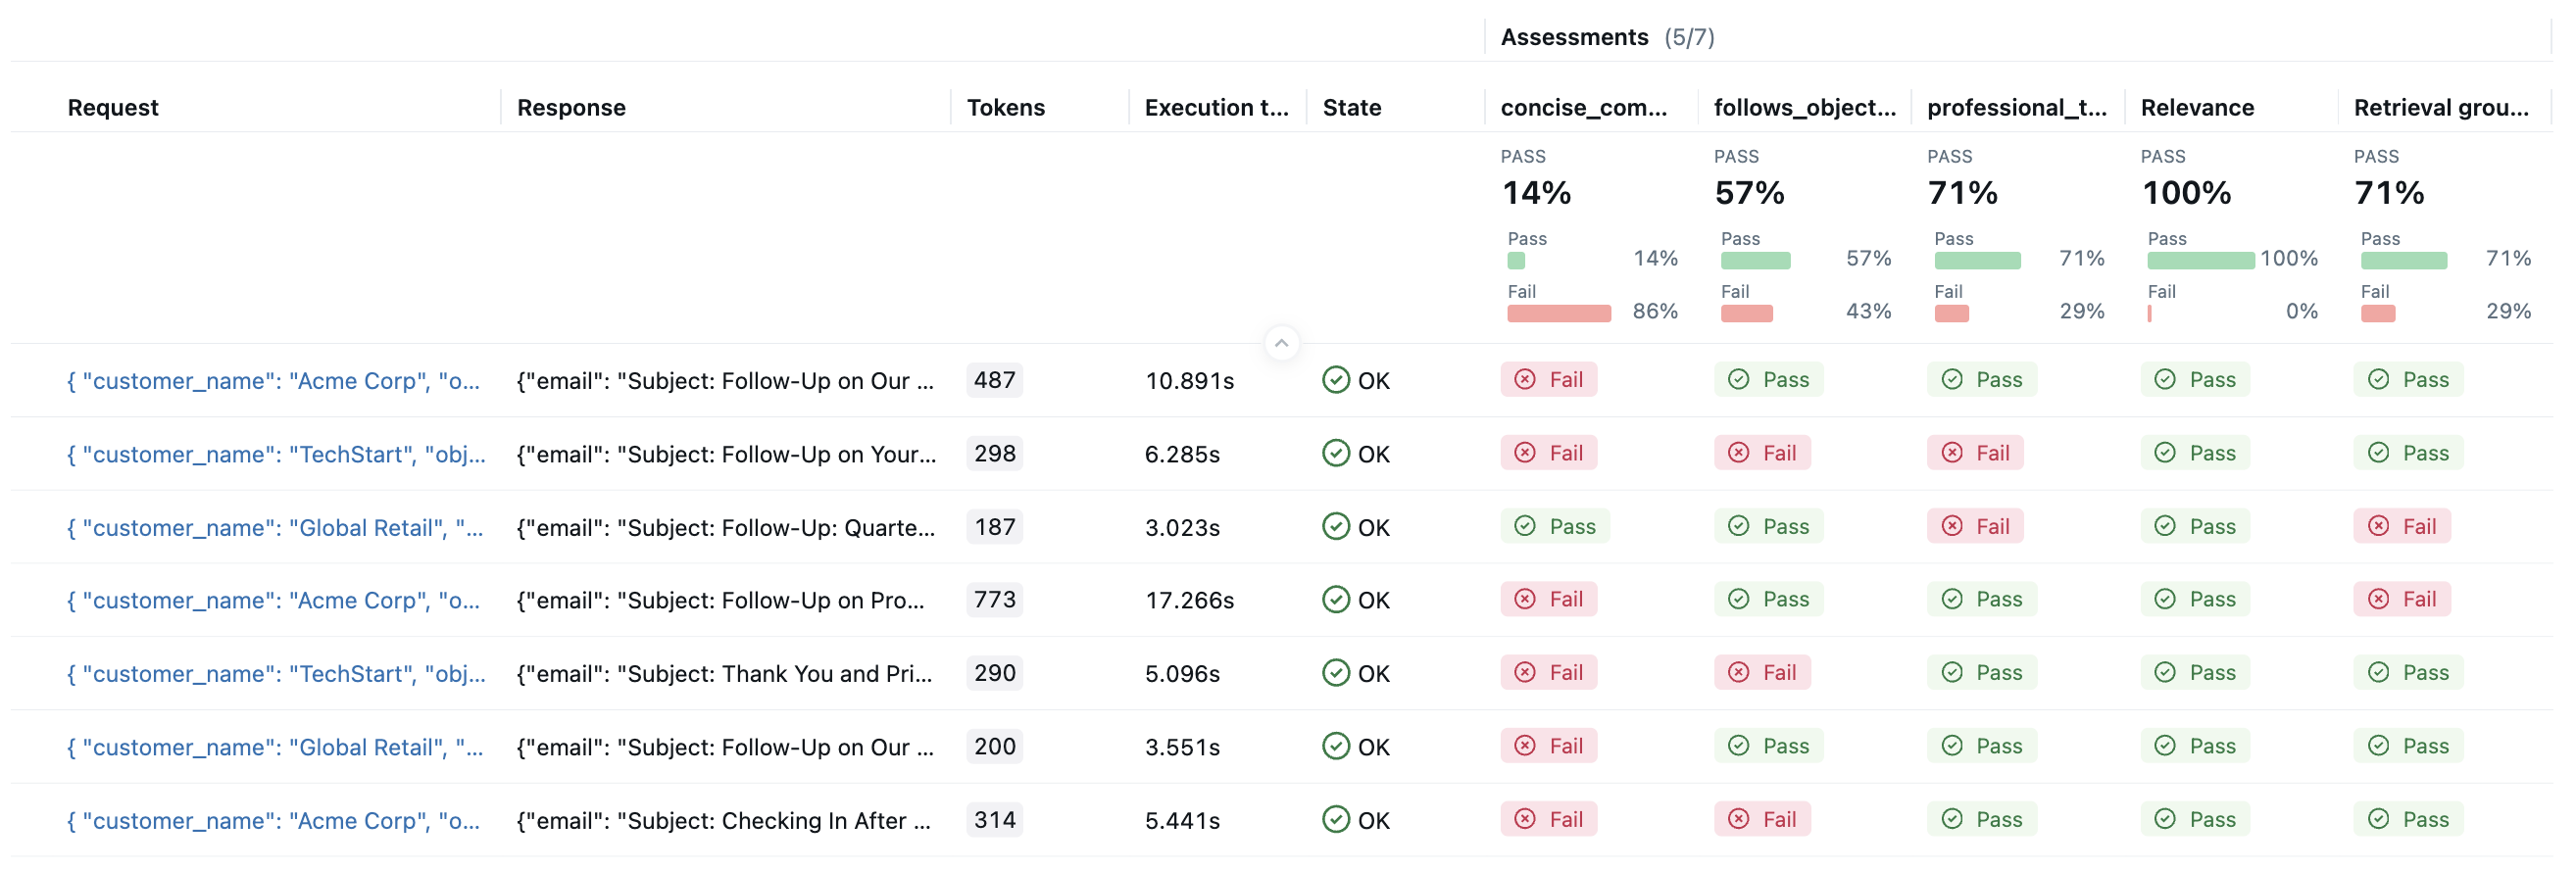
By clicking on the each row in the result, you can open the trace and see the detailed score and rationale.
Annotate Traces with Ground Truth and Manual Feedbacks
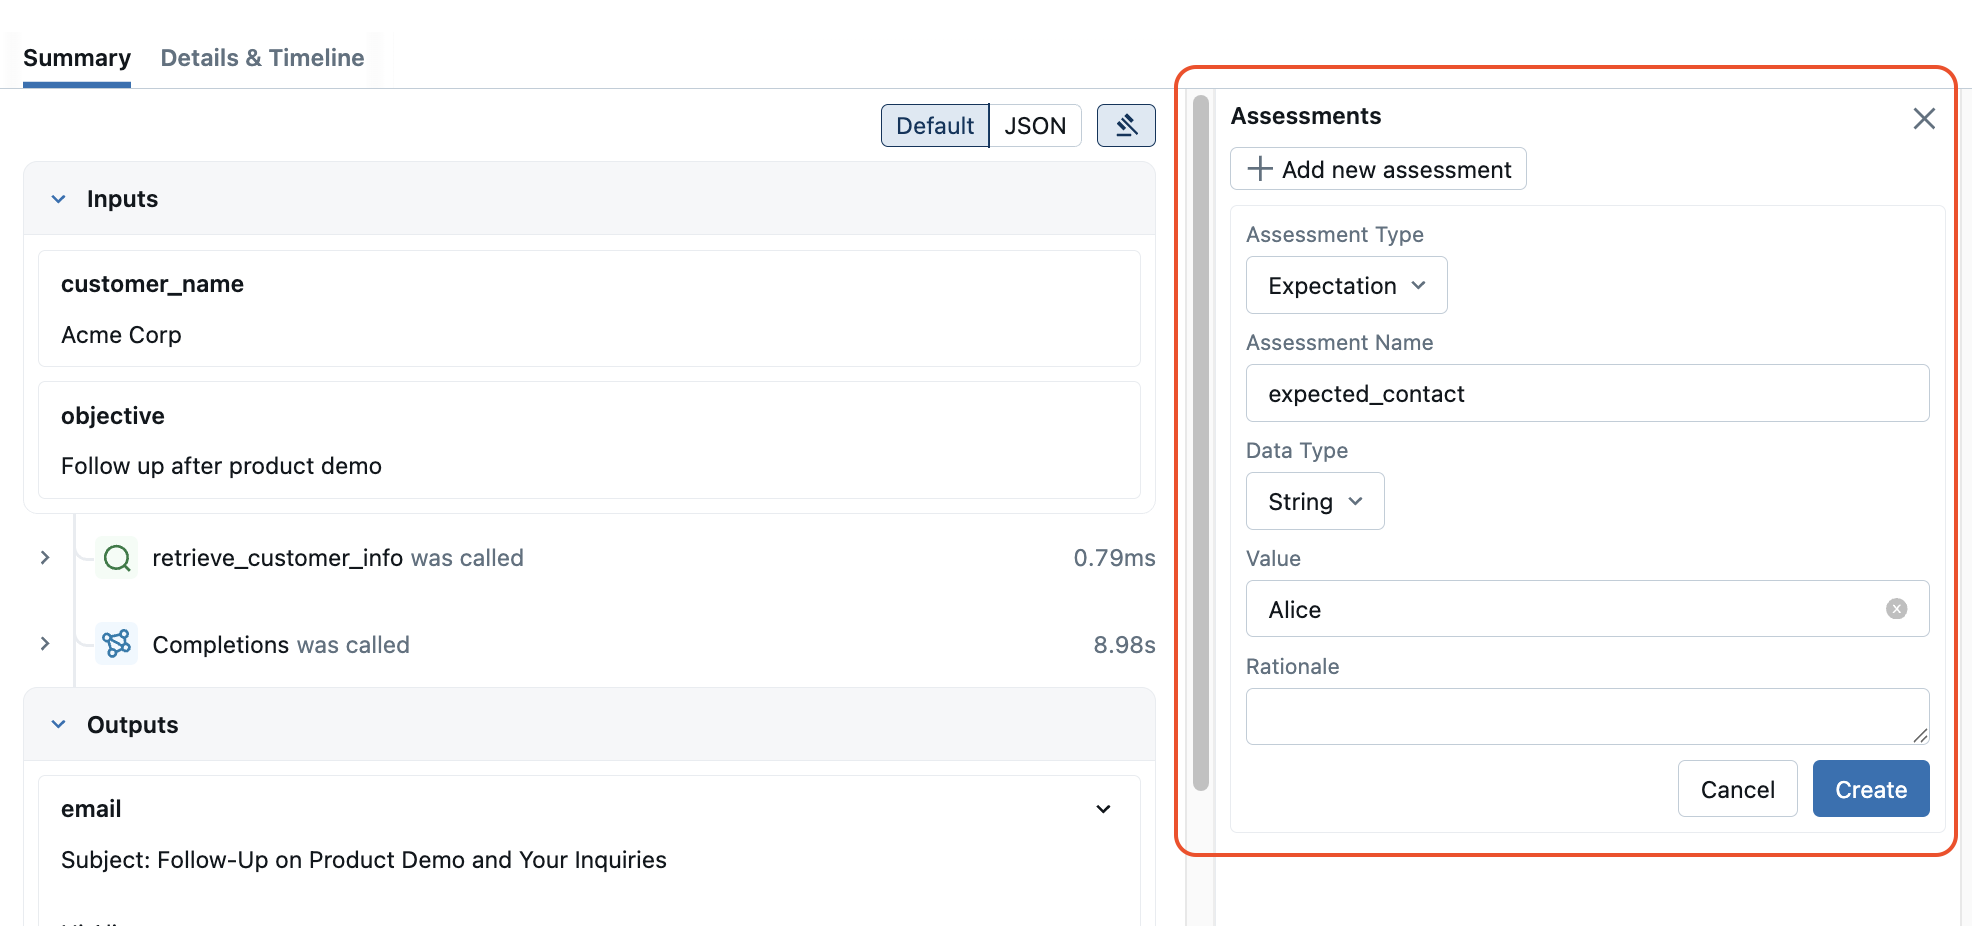
Some evaluation criteria require ground truths to be defined. MLflow allows you to directly annotate traces with ground truths and any other human feedbacks.
To annotate a trace with ground truth or manual feedback, open the trace in the MLflow UI and click the Assessments button to add expectations or feedback directly through the web interface.
Alternatively, you can also annotate traces with ground truth or manual feedbacks using the mlflow.log_expectation() and the mlflow.log_feedback() APIs respectively.
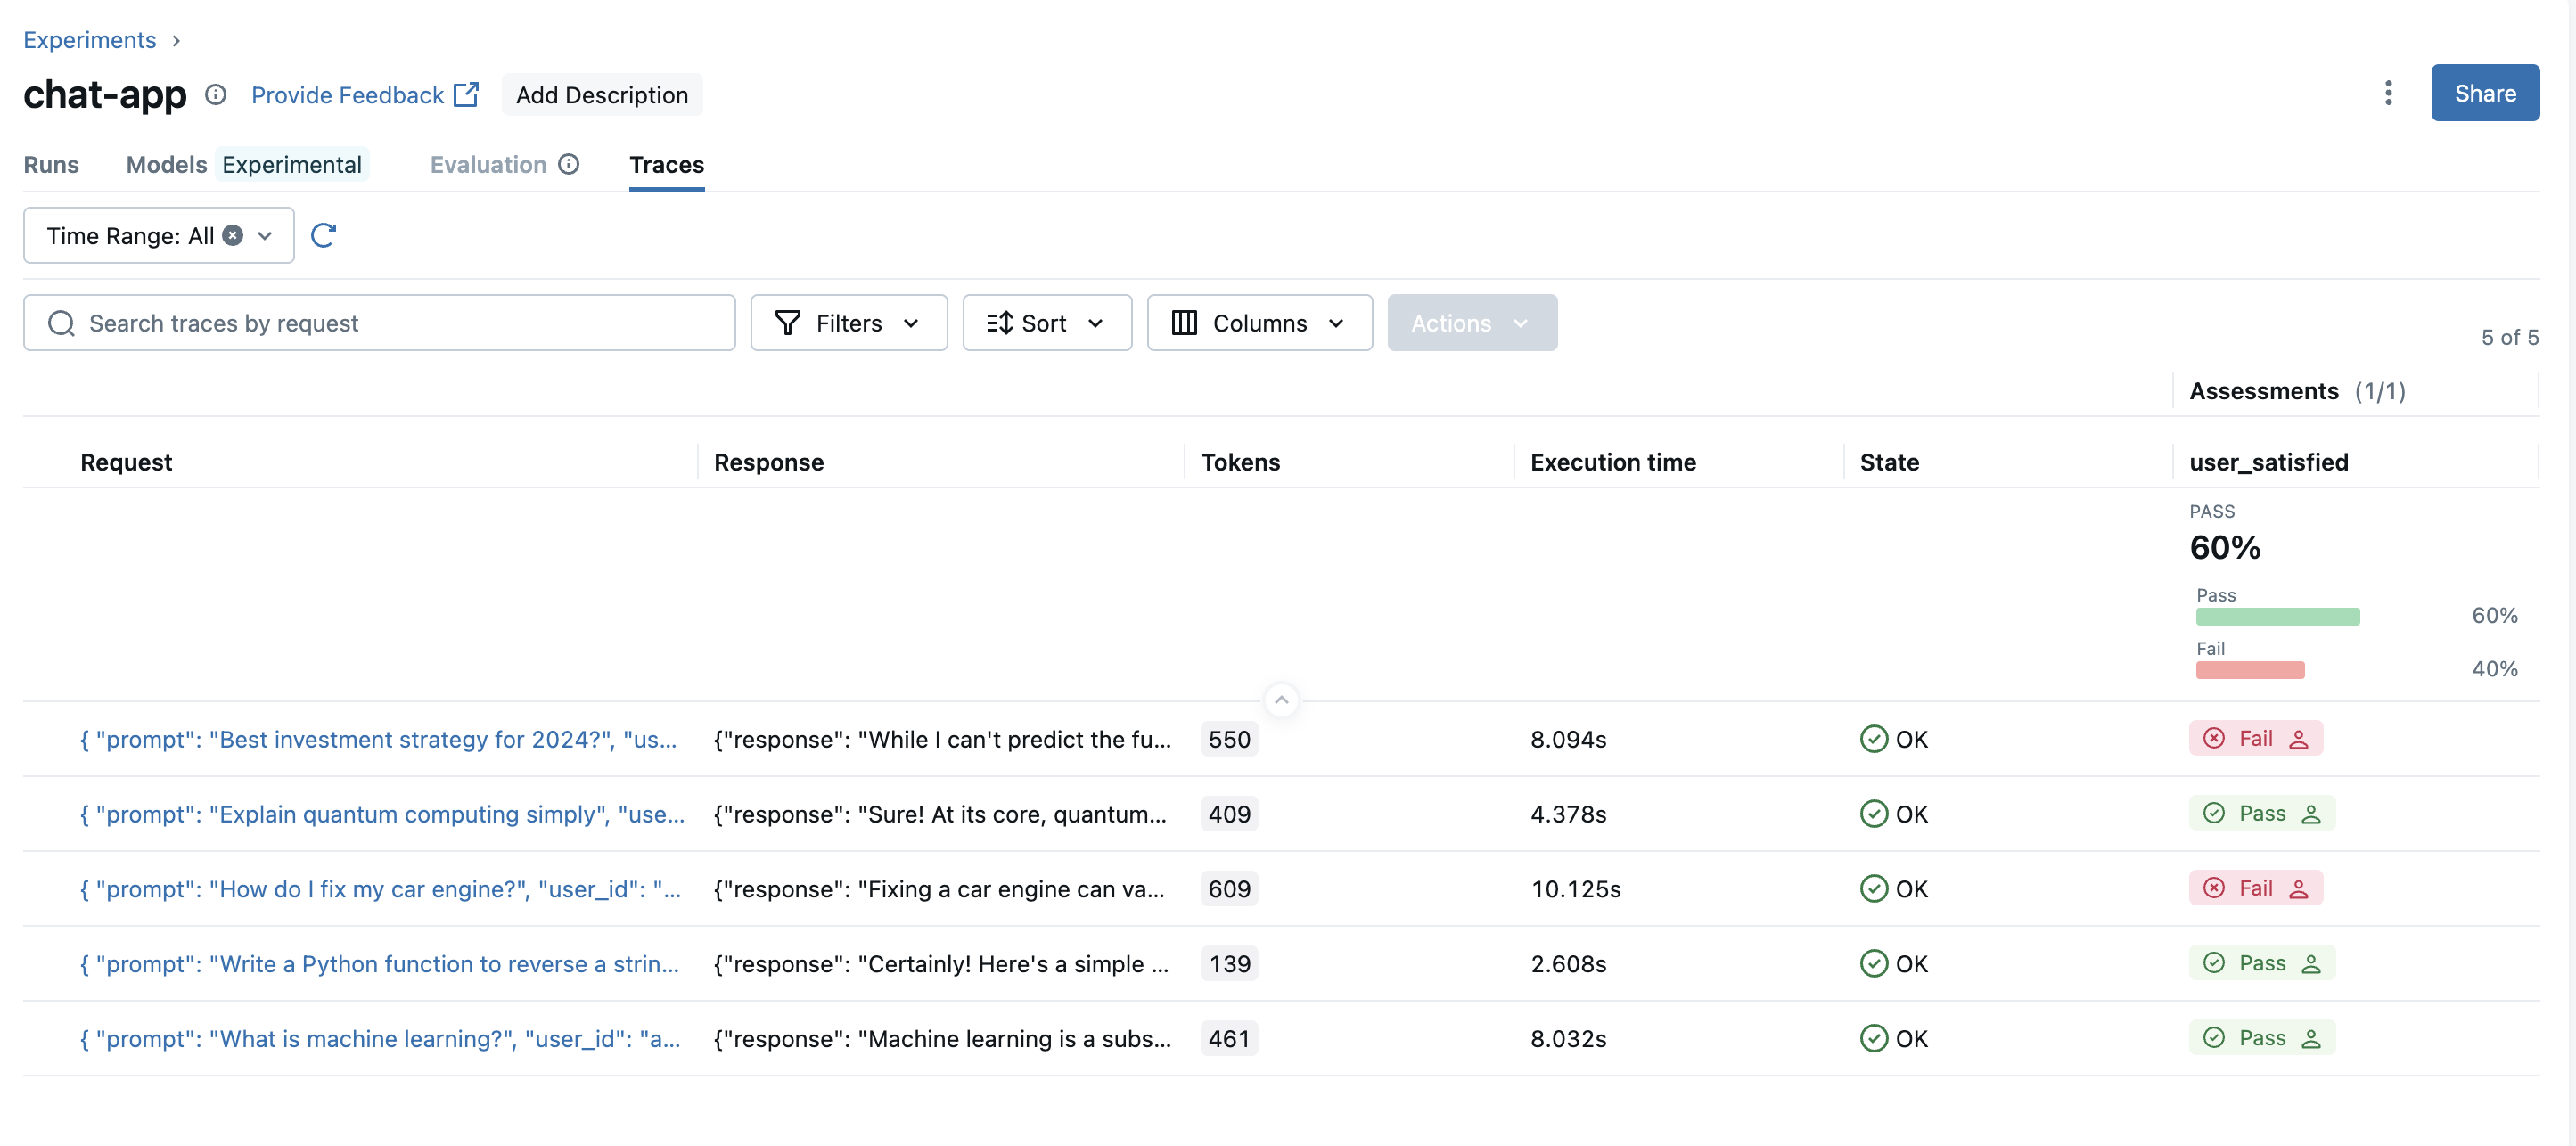
Recording End-user Feedbacks from Production
Using the mlflow.log_feedback() API, you can record end-user feedbacks from your production application directly and monitor them in MLflow.
# Decorate the endpoint with MLflow tracing
@mlflow.trace(span_type="LLM")
@app.post("/chat", response_model=ChatResponse)
async def chat(request: ChatRequest):
    """
    Chat endpoint that answers user questions and returns response with MLflow trace ID.
    """
    try:
        response = await openai.AsyncOpenAI().chat.completions.create(
            model="gpt-4o-mini",
            messages=[{"role": "user", "content": request.prompt}],
        )

        # Get the active trace ID for the request
        trace_id = mlflow.get_current_active_span().trace_id

        return ChatResponse(
            response=response.choices[0].message.content,
            trace_id=trace_id,
            timestamp=time.time(),
        )
    except Exception as e:
        raise HTTPException(
            status_code=500, detail=f"Error processing chat request: {str(e)}"
        )


@app.post("/feedback", response_model=FeedbackResponse)
async def feedback(request: FeedbackRequest):
    """
    Feedback endpoint that annotates MLflow traces with user feedback.
    """
    try:
        # Record the given user feedback to the Trace
        mlflow.log_feedback(
            trace_id=request.trace_id,
            name="user_satisfaction",
            value=request.thumbs_up,
            source=AssessmentSource(
                source_type=AssessmentSourceType.HUMAN, source_id=request.user_id
            ),
            rationale=request.rationale,
        )
        return FeedbackResponse(
            message="Feedback recorded successfully", trace_id=request.trace_id
        )
    except HTTPException:
        raise
    except Exception as e:
        raise HTTPException(
            status_code=500, detail=f"Error processing feedback: {str(e)}"
        )
Next steps
Custom Scorers
Build advanced evaluation criteria and metrics tailored to your specific trace analysis needs.
Production Monitoring
Optimize trace collection in production environments for efficient monitoring and analysis.
Tracing Integrations
Use MLflow Tracing with other LLM providers and frameworks, such as LangGraph, Pydantic AI.