Manual Tracing
In addition to the Auto Tracing integrations, you can instrument your Python code using MLflow's manual tracing APIs. This is especially useful when you need to instrument your custom Python code.
Looking for the Typescript guide? Checkout the Typescript SDK documentation.
Decorator
The mlflow.trace() decorator allows you to create a span for any function. This approach provides a simple yet effective way to add tracing to your code with minimal effort:
- 🔗 MLflow detects the parent-child relationships between functions, making it compatible with auto-tracing integrations.
- 🛡️ Captures exceptions during function execution and records them as span events.
- 📊 Automatically logs the function's name, inputs, outputs, and execution time.
- 🤝 Can be used alongside auto-tracing features, such as
mlflow.openai.autolog.
The @mlflow.trace decorator currently supports the following types of functions:
| Function Type | Supported |
|---|---|
| Sync | Yes |
| Async | Yes (>= 2.16.0) |
| Generator | Yes (>= 2.20.2) |
| Async Generator | Yes (>= 2.20.2) |
Example�
The following code is a minimum example of using the decorator for tracing Python functions.
To ensure complete observability, the @mlflow.trace decorator should generally be the outermost one if using multiple decorators. See Using @mlflow.trace with Other Decorators for a detailed explanation and examples.
import mlflow


@mlflow.trace(span_type="func", attributes={"key": "value"})
def add_1(x):
    return x + 1


@mlflow.trace(span_type="func", attributes={"key1": "value1"})
def minus_1(x):
    return x - 1


@mlflow.trace(name="Trace Test")
def trace_test(x):
    step1 = add_1(x)
    return minus_1(step1)


trace_test(4)
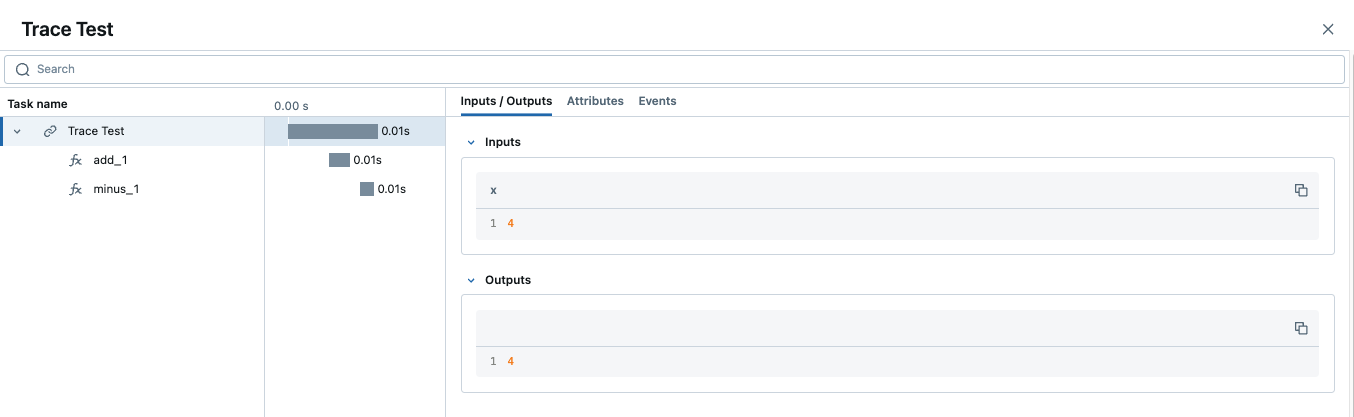
When a trace contains multiple spans with same name, MLflow appends an auto-incrementing suffix to them, such as _1, _2.
Customizing Spans
The mlflow.trace() decorator accepts following arguments to customize the span to be created:
- 🏷️
nameparameter to override the span name from the default (the name of decorated function) - 🎯
span_typeparameter to set the type of span. Set either one of built-in Span Types or a string. - 🏗️
attributesparameter to add custom attributes to the span.
When combining @mlflow.trace with other decorators (e.g., from web frameworks), it's crucial for it to be the outermost. For a clear example of correct vs. incorrect ordering, please refer to Using @mlflow.trace with Other Decorators.
from mlflow.entities import SpanType


@mlflow.trace(
    name="call-local-llm", span_type=SpanType.LLM, attributes={"model": "gpt-4o-mini"}
)
def invoke(prompt: str):
    return client.invoke(
        messages=[{"role": "user", "content": prompt}], model="gpt-4o-mini"
    )
Alternatively, you can update the span dynamically inside the function by using mlflow.get_current_active_span() API.
from mlflow.entities import SpanType


@mlflow.trace(span_type=SpanType.LLM)
def invoke(prompt: str):
    model_id = "gpt-4o-mini"
    # Get the current span (created by the @mlflow.trace decorator)
    span = mlflow.get_current_active_span()
    # Set the attribute to the span
    span.set_attributes({"model": model_id})
    return client.invoke(messages=[{"role": "user", "content": prompt}], model=model_id)
Using @mlflow.trace with Other Decorators
When applying multiple decorators to a single function, it's crucial to place @mlflow.trace as the outermost decorator (the one at the very top). This ensures that MLflow can capture the entire execution of the function, including the behavior of any inner decorators.
If @mlflow.trace is not the outermost decorator, its visibility into the function's execution may be limited or incorrect, potentially leading to incomplete traces or misrepresentation of the function's inputs, outputs, and execution time.
Consider the following conceptual example:
import mlflow
import functools
import time


# A hypothetical additional decorator
def simple_timing_decorator(func):
    @functools.wraps(func)
    def wrapper(*args, **kwargs):
        start_time = time.time()
        result = func(*args, **kwargs)
        end_time = time.time()
        print(
            f"{func.__name__} executed in {end_time - start_time:.4f} seconds by simple_timing_decorator."
        )
        return result

    return wrapper


# Correct order: @mlflow.trace is outermost
@mlflow.trace(name="my_decorated_function_correct_order")
@simple_timing_decorator
# @another_framework_decorator # e.g., @app.route("/mypath") from Flask
def my_complex_function(x, y):
    # Function logic here
    time.sleep(0.1)  # Simulate work
    return x + y


# Incorrect order: @mlflow.trace is NOT outermost
@simple_timing_decorator
@mlflow.trace(name="my_decorated_function_incorrect_order")
# @another_framework_decorator
def my_other_complex_function(x, y):
    time.sleep(0.1)
    return x * y


# Example calls
if __name__ == "__main__":
    print("Calling function with correct decorator order:")
    my_complex_function(5, 3)

    print("\nCalling function with incorrect decorator order:")
    my_other_complex_function(5, 3)
In the my_complex_function example (correct order), @mlflow.trace will capture the full execution, including the time added by simple_timing_decorator. In my_other_complex_function (incorrect order), the trace captured by MLflow might not accurately reflect the total execution time or could miss modifications to inputs/outputs made by simple_timing_decorator before @mlflow.trace sees them.
Adding Trace Tags
Tags can be added to traces to provide additional metadata at the trace level. There are a few different ways to set tags on a trace. Please refer to the how-to guide for the other methods.
@mlflow.trace
def my_func(x):
    mlflow.update_current_trace(tags={"fruit": "apple"})
    return x + 1
Customizing Request and Response Previews in the UI
The Traces tab in the MLflow UI displays a list of traces, and the Request and Response columns show a preview of the end-to-end input and output of each trace. This allows you to quickly understand what each trace represents.
By default, these previews are truncated to a fixed number of characters. However, you can customize what's shown in these columns by using the request_preview and response_preview parameters within the mlflow.update_current_trace() function. This is particularly useful for complex inputs or outputs where the default truncation might not show the most relevant information.
Below is an example of setting a custom request preview for a trace that processes a long document and user instructions, aiming to render the most relevant information in the UI's Request column:
import mlflow


@mlflow.trace(name="Summarization Pipeline")
def summarize_document(document_content: str, user_instructions: str):
    # Construct a custom preview for the request column
    # For example, show beginning of document and user instructions
    request_p = f"Doc: {document_content[:30]}... Instr: {user_instructions[:30]}..."
    mlflow.update_current_trace(request_preview=request_p)

    # Simulate LLM call
    # messages = [
    #     {"role": "system", "content": "Summarize the following document based on user instructions."},
    #     {"role": "user", "content": f"Document: {document_content}\nInstructions: {user_instructions}"}
    # ]
    # completion = client.chat.completions.create(model="gpt-4o-mini", messages=messages)
    # summary = completion.choices[0].message.content
    summary = f"Summary of document starting with '{document_content[:20]}...' based on '{user_instructions}'"

    # Customize the response preview
    response_p = f"Summary: {summary[:50]}..."
    mlflow.update_current_trace(response_preview=response_p)

    return summary


# Example Call
long_document = (
    "This is a very long document that contains many details about various topics..."
    * 10
)
instructions = "Focus on the key takeaways regarding topic X."
summary_result = summarize_document(long_document, instructions)
By setting request_preview and response_preview on the trace (typically the root span), you control how the overall interaction is summarized in the main trace list view, making it easier to identify and understand traces at a glance.
Automatic Exception Handling
If an Exception is raised during processing of a trace-instrumented operation, an indication will be shown within the UI that the invocation was not successful and a partial capture of data will be available to aid in debugging. Additionally, details about the Exception that was raised will be included within Events of the partially completed span, further aiding the identification of where issues are occurring within your code.
Combining with Auto-Tracing
The @mlflow.trace decorator can be used in conjunction with auto tracing to combine auto-tracing with manually defined spans in a single cohesive and integrated trace. Learn more here.
Streaming
The @mlflow.trace decorator can be used to trace functions that return a generator or an iterator, since MLflow 2.20.2.
@mlflow.trace
def stream_data():
    for i in range(5):
        yield i
The above example will generate a trace with a single span for the stream_data function. By default, MLflow will capture all elements yielded by the generator as a list in the span's output. In the example above, the output of the span will be [0, 1, 2, 3, 4].
A span for a stream function will start when the returned iterator starts to be consumed, and will end when the iterator is exhausted, or an exception is raised during the iteration.
If you want to aggregate the elements to be a single span output, you can use the output_reducer parameter to specify a custom function to aggregate the elements. The custom function should take a list of yielded elements as inputs.
@mlflow.trace(output_reducer=lambda x: ",".join(x))
def stream_data():
    for c in "hello":
        yield c
In the example above, the output of the span will be "h,e,l,l,o". The raw chunks can still be found in the Events tab of the span.
The following is an advanced example that uses the output_reducer to consolidate ChatCompletionChunk output from an OpenAI LLM into a single message object.
Of course, we recommend using the auto-tracing for OpenAI for examples like this, which does the same job but with one-liner code. The example below is for demonstration purposes.
import mlflow
import openai
from openai.types.chat import *
from typing import Optional


def aggregate_chunks(outputs: list[ChatCompletionChunk]) -> Optional[ChatCompletion]:
    """Consolidate ChatCompletionChunks to a single ChatCompletion"""
    if not outputs:
        return None

    first_chunk = outputs[0]
    delta = first_chunk.choices[0].delta
    message = ChatCompletionMessage(
        role=delta.role, content=delta.content, tool_calls=delta.tool_calls or []
    )
    finish_reason = first_chunk.choices[0].finish_reason
    for chunk in outputs[1:]:
        delta = chunk.choices[0].delta
        message.content += delta.content or ""
        message.tool_calls += delta.tool_calls or []
        finish_reason = finish_reason or chunk.choices[0].finish_reason

    base = ChatCompletion(
        id=first_chunk.id,
        choices=[Choice(index=0, message=message, finish_reason=finish_reason)],
        created=first_chunk.created,
        model=first_chunk.model,
        object="chat.completion",
    )
    return base


@mlflow.trace(output_reducer=aggregate_chunks)
def predict(messages: list[dict]):
    stream = openai.OpenAI().chat.completions.create(
        model="gpt-4o-mini",
        messages=messages,
        stream=True,
    )
    for chunk in stream:
        yield chunk


for chunk in predict([{"role": "user", "content": "Hello"}]):
    print(chunk)
In the example above, the generated predict span will have a single chat completion message as the output, which is aggregated by the custom reducer function.
Function Wrapping
Function wrapping provides a flexible way to add tracing to existing functions without modifying their definitions. This is particularly useful when you want to add tracing to third-party functions or functions defined outside of your control. By wrapping an external function with mlflow.trace(), you can capture its inputs, outputs, and execution context.
When wrapping functions dynamically, the concept of "outermost" still applies. The tracing wrapper should be applied at the point where you want to capture the entire call to the wrapped function.
import math
import mlflow


def invocation(x, y, exp=2):
    # Wrap an external function from the math library
    traced_pow = mlflow.trace(math.pow)
    raised = traced_pow(x, exp)

    traced_factorial = mlflow.trace(math.factorial)
    factorial = traced_factorial(int(raised))
    return factorial


invocation(4, 2)
Context Manager
In addition to the decorator, MLflow allows for creating a span that can then be accessed within any encapsulated arbitrary code block using the mlflow.start_span() context manager. It can be useful for capturing complex interactions within your code in finer detail than what is possible by capturing the boundaries of a single function.
Similarly to the decorator, the context manager automatically captures parent-child relationship, exceptions, execution time, and works with auto-tracing. However, the name, inputs, and outputs of the span must be provided manually. You can set them via the mlflow.entities.Span() object that is returned from the context manager.
import mlflow

with mlflow.start_span(name="my_span") as span:
    span.set_inputs({"x": 1, "y": 2})
    z = x + y
    span.set_outputs(z)
Below is a slightly more complex example that uses the mlflow.start_span() context manager in conjunction with both the decorator and auto-tracing for OpenAI.
import mlflow
import openai
from mlflow.entities import SpanType

# Enable auto-tracing for OpenAI
mlflow.openai.autolog()


@mlflow.trace(span_type=SpanType.CHAIN)
def start_session():
    messages = [{"role": "system", "content": "You are a friendly chat bot"}]
    while True:
        with mlflow.start_span(name="User") as span:
            span.set_inputs(messages)
            user_input = input(">> ")
            span.set_outputs(user_input)

        if user_input == "BYE":
            break

        messages.append({"role": "user", "content": user_input})

        response = openai.OpenAI().chat.completions.create(
            model="gpt-4o-mini",
            max_tokens=100,
            messages=messages,
        )
        answer = response.choices[0].message.content
        print(f"🤖: {answer}")

        messages.append({"role": "assistant", "content": answer})


start_session()
Advanced Features
Multi Threading
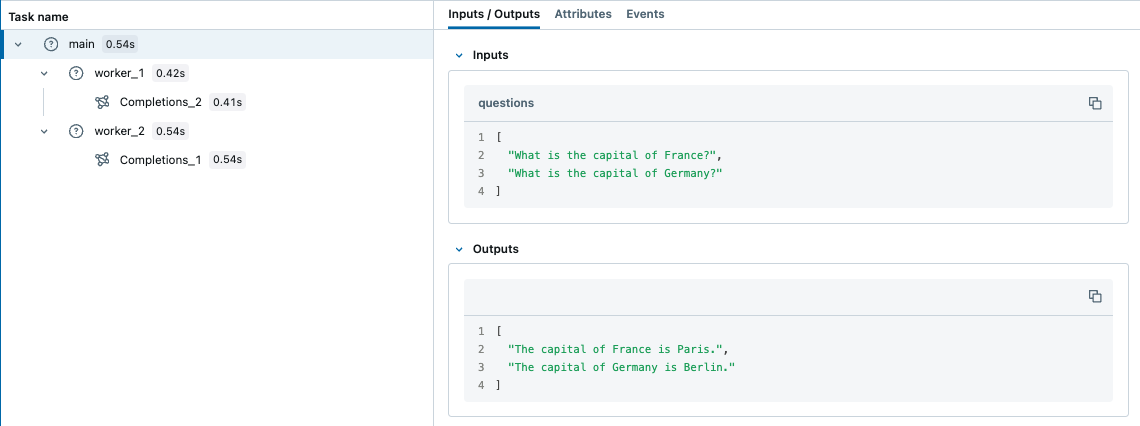
MLflow Tracing is thread-safe, traces are isolated by default per thread. But you can also create a trace that spans multiple threads with a few additional steps.
MLflow uses Python's built-in ContextVar mechanism to ensure thread safety, which is not propagated across threads by default. Therefore, you need to manually copy the context from the main thread to the worker thread, as shown in the example below.
import contextvars
from concurrent.futures import ThreadPoolExecutor, as_completed
import mlflow
from mlflow.entities import SpanType
import openai

client = openai.OpenAI()

# Enable MLflow Tracing for OpenAI
mlflow.openai.autolog()


@mlflow.trace
def worker(question: str) -> str:
    messages = [
        {"role": "system", "content": "You are a helpful assistant."},
        {"role": "user", "content": question},
    ]
    response = client.chat.completions.create(
        model="gpt-4o-mini",
        messages=messages,
        temperature=0.1,
        max_tokens=100,
    )
    return response.choices[0].message.content


@mlflow.trace
def main(questions: list[str]) -> list[str]:
    results = []
    # Almost same as how you would use ThreadPoolExecutor, but two additional steps
    #  1. Copy the context in the main thread using copy_context()
    #  2. Use ctx.run() to run the worker in the copied context
    with ThreadPoolExecutor(max_workers=2) as executor:
        futures = []
        for question in questions:
            ctx = contextvars.copy_context()
            futures.append(executor.submit(ctx.run, worker, question))
        for future in as_completed(futures):
            results.append(future.result())
    return results


questions = [
    "What is the capital of France?",
    "What is the capital of Germany?",
]

main(questions)
In contrast, ContextVar is copied to async tasks by default. Therefore, you don't need to manually copy the context when using asyncio, which might be an easier way to handle concurrent I/O-bound tasks in Python with MLflow Tracing.
Async Support
The @mlflow.trace decorator works seamlessly with async functions:
import asyncio
import mlflow


@mlflow.trace
async def async_operation(data: str) -> str:
    # Simulate async work
    await asyncio.sleep(0.1)
    return f"Processed: {data}"


@mlflow.trace
async def async_pipeline(items: list[str]) -> list[str]:
    results = []
    for item in items:
        result = await async_operation(item)
        results.append(result)
    return results


# Run the async pipeline
asyncio.run(async_pipeline(["item1", "item2", "item3"]))
Next Steps
Combining with Auto-Tracing: Mix automatic and manual tracing for optimal observability
Trace Concepts: Understand the structure and components of MLflow traces
Querying Traces: Programmatically search and analyze your traces