Live Demo
demo.mlflow.org is a publicly hosted MLflow instance pre-loaded with sample data. It's the fastest way to explore the MLflow UI without any local setup.
What's in the demo?
The demo environment includes sample data across four areas:
Explore dashboard, traces and sessions from a sample LLM application. Inspect spans, inputs/outputs, latency, token usage, and nested call hierarchies.
Browse pre-configured judges, datasets, and evaluation runs with judge-scored quality metrics across sample traces.
See automatically detected issues surfaced from trace data and an issue detection run, showing how MLflow flags quality and reliability problems in production.
Browse versioned prompts used by the demo application, with full edit history and linked traces.
Run the demo locally
Want to explore the same demo data on your own MLflow instance with write access? You can launch it in seconds using the mlflow demo command:
uvx mlflow demo
This starts a local MLflow server pre-loaded with the same sample data, giving you full read-write access to experiment and customize.
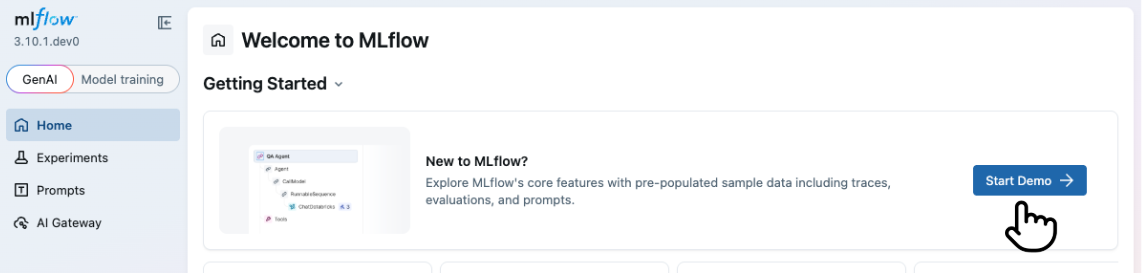
Alternatively, if you already have a local MLflow instance running, click the Explore Demo button in the banner at the top of the home page to load sample data directly into your instance.
Next steps
Once you've explored the demo, get started with your own MLflow environment:
- Set Up MLflow Server — connect to a local or hosted MLflow instance
- Start Tracing — instrument your LLM app and capture your first traces
- Evaluate LLMs and Agents — run systematic evaluations with LLM judges