AI Issue Discovery
Automatically analyze traces in your MLflow experiments to find operational issues, quality problems, and performance patterns. The Analyze Experiment tool uses hypothesis-driven analysis to systematically examine your LLM application or AI agent's behavior, identify the most important problems, and create a plan for addressing them in the form of a comprehensive markdown report.
Overview
The Analyze Experiment command examines traces logged in an MLflow experiment to automatically discover:
Operational Issues
Detect errors, timeouts, rate limiting, authentication failures, and performance bottlenecks
Quality Issues
Identify overly verbose responses, inconsistent outputs, repetitive content, and inappropriate response formats
Success Patterns
Discover what's working well, effective tool usage, and high-quality interactions
Performance Metrics
Analyze latency distributions, success rates, and error patterns
The tool generates a detailed markdown report with specific trace examples, quantitative evidence, and actionable recommendations for improvement.
Usage
The Analyze Experiment functionality is available through two methods:
- MCP
- CLI
Using MCP
If you have MLflow's MCP server configured, you can simply run:
/analyze-experiment
Prerequisites
- MLflow MCP server (see MCP setup guide)
- A coding agent with MCP support (e.g., Claude Code, Cursor, Windsurf, etc.) configured to connect to MLflow MCP server
- MLflow experiment with logged traces
Using CLI
Run the analyze experiment command directly:
mlflow ai-commands run genai/analyze_experiment
Note: This command must be run inside a coding agent with MCP support. The agent will interactively guide you through the analysis process.
Prerequisites
- A coding agent with MCP support (e.g., Claude Code, Cursor, Windsurf, etc.)
- MLflow 3.4 or later:
pip install 'mlflow[genai]>=3.4' - Access to MLflow tracking server with logged traces
Analysis Workflow
Analyze Experiment Workflow
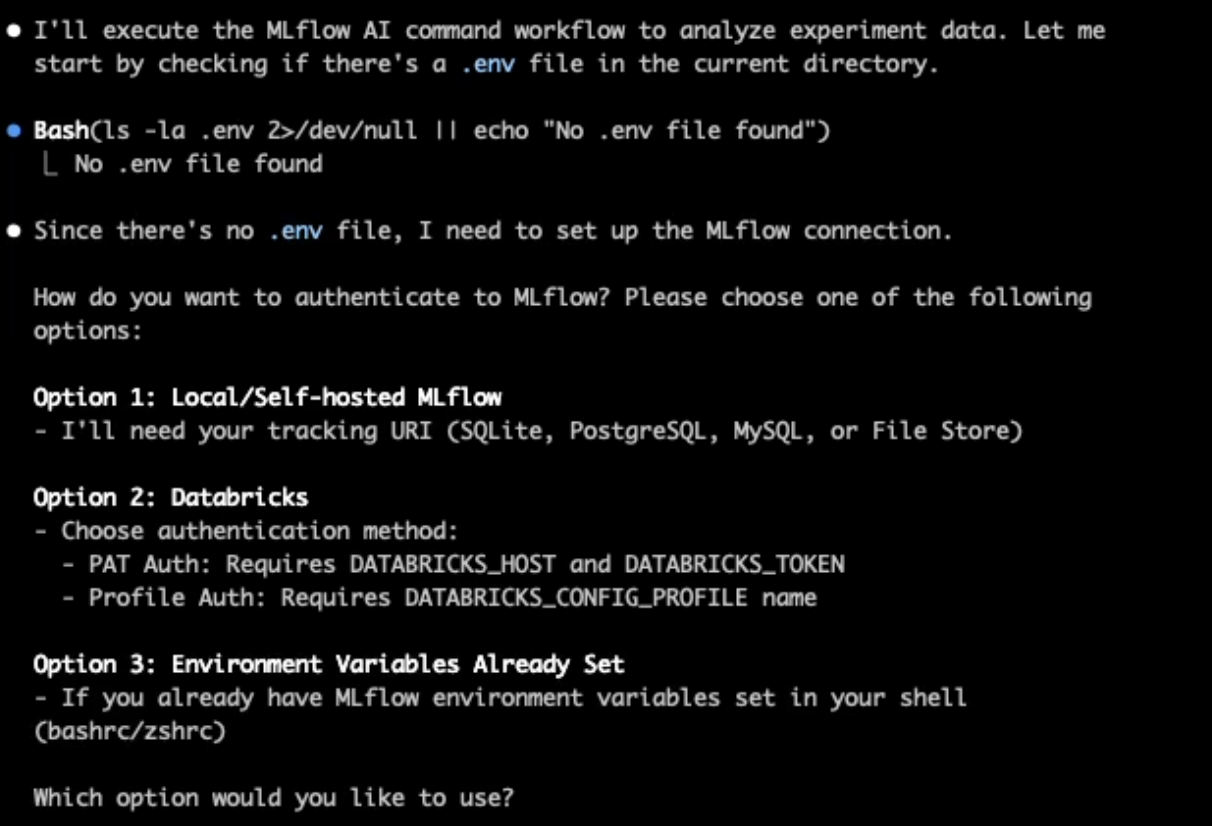
1. Setup and Authentication
The tool will ask you to configure authentication:
- Databricks: Provide workspace URL and personal access token, or use a Databricks CLI profile
- Local MLflow: Specify tracking URI (SQLite, PostgreSQL, MySQL, or file store)
- Environment Variables: Use pre-configured MLflow environment variables like
MLFLOW_TRACKING_URI(see environment setup guide)
2. Experiment Selection
- Browse available experiments or search by name
- Select the experiment containing traces to analyze
- Verify trace availability and data structure
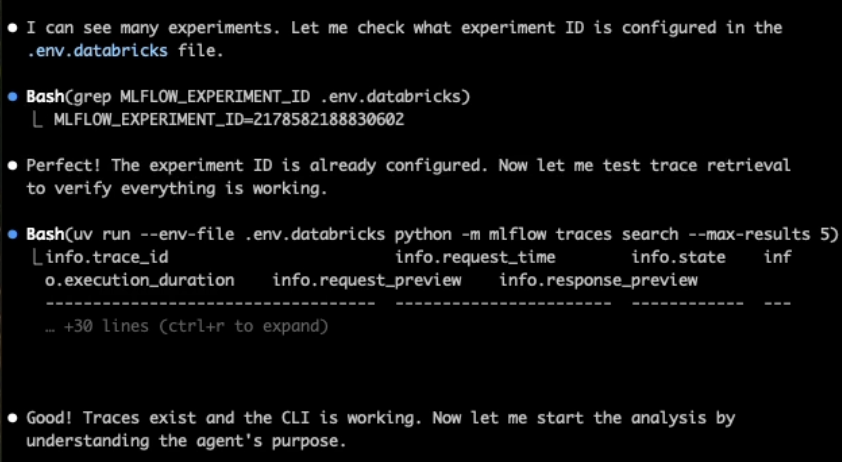
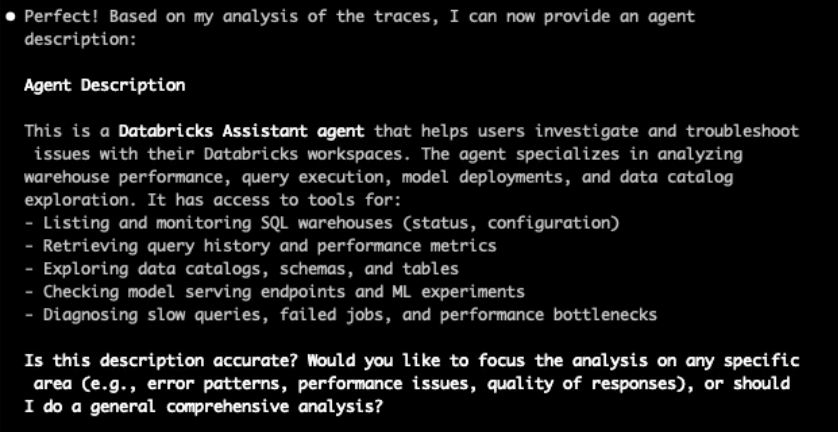
3. Agent Purpose Identification
The tool examines trace inputs and outputs to understand:
- What your agent's job is (e.g., "a customer service agent that helps users with billing questions")
- What data sources and tools the agent has access to
- Common patterns in user interactions
You'll be asked to confirm or correct this understanding before analysis continues.
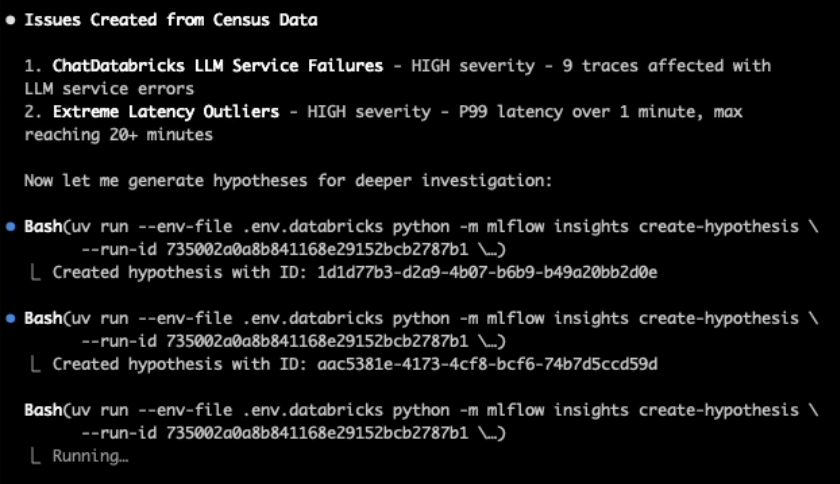
4. Hypothesis-Driven Analysis
The tool systematically tests hypotheses about potential issues:
Operational Issues:
- Error patterns (authentication failures, timeouts, API failures)
- Performance bottlenecks (slow tool calls, sequential vs parallel execution)
- Rate limiting and resource contention
Quality Issues:
- Content problems (verbosity, repetition, inconsistency)
- Response appropriateness for query types
- Context handling and conversation flow
5. Report Generation
The tool generates a comprehensive markdown report containing:
- Summary Statistics: Success rates, latency metrics, error distributions
- Confirmed Issues: Detailed analysis with specific trace examples and root causes
- Strengths: What's working well in your application
- Recommendations: Actionable improvements based on findings
Report Content
Each generated report provides comprehensive insights into your application's behavior:
Quantitative Metrics
Key performance indicators including total traces analyzed, success rates (OK vs ERROR), latency statistics (average, median, P95), and error rate distributions
Issue Analysis
Detailed breakdown of confirmed issues with problem statements, trace examples with inputs/outputs, root cause analysis, frequency assessment, and specific trace IDs for investigation
Actionable Recommendations
Prioritized improvement suggestions with implementation guidance and expected impact of changes to help you systematically address identified problems