Automatic Issue Detection
Automatically identify quality and operational issues in your LLM application using AI-powered analysis of traces directly within the MLflow UI.
Why Automatic Issue Detection?
As your LLM application scales in production, maintaining agent quality becomes increasingly challenging:
- Cumbersome to review traces one by one: Manually inspecting individual traces does not scale as traffic grows
- Unclear which quality metrics to use: The default scorer covers common cases automatically, so you can get started without defining metrics upfront
- Difficult to identify recurring patterns: Related failures are scattered across traces without automatic grouping
- Lack of structured issue tracking: Without structured tracking, identified problems get lost and regressions go unnoticed
How It Works
Issue detection uses a multi-stage AI analysis pipeline:
Identify issues from traces
Automatically identify issues from your selected traces, based on the chosen categories and model
Analyze triage results
Build per-session analyses from triage results, combining triage rationales, human feedback and agent execution logic
Cluster issues
Cluster analyses into identified issues via LLM-based labeling and grouping
Annotate issues
Annotate traces with corresponding issues, including the rationales
Summary
Generate a summary of identified issues and root causes
What Gets Analyzed
The system examines your trace data to understand:
- Inputs and outputs: User requests and agent responses
- Tool calls and results: Function calls, API interactions, and their outcomes
- Execution flow: Span sequences, timing, and control flow
- Errors and exceptions: Failures, timeouts, and error messages
- Metadata: User feedback, tags, session context
From this data, the AI identifies problems across six quality dimensions.
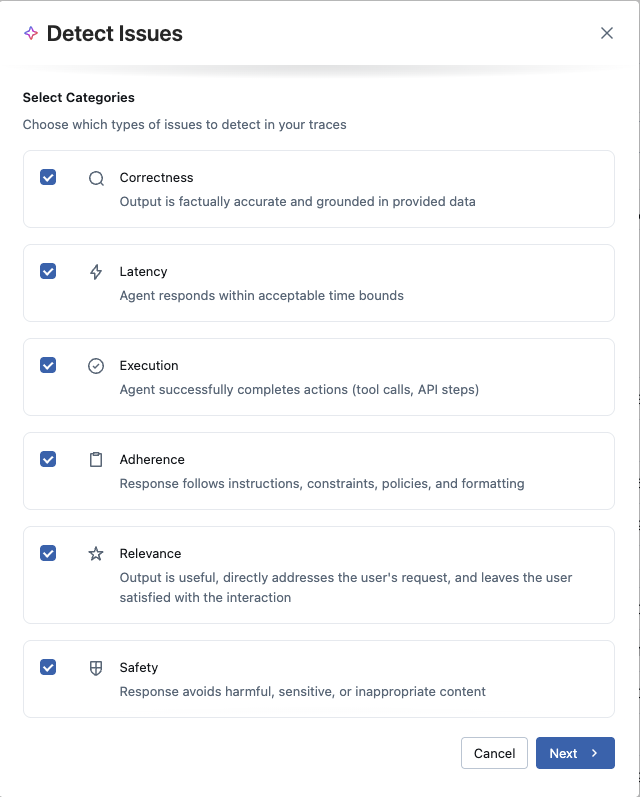
Issue Categories (CLEARS)
MLflow organizes issue detection across six quality dimensions, forming the CLEARS framework (Correctness, Latency, Execution, Adherence, Relevance, Safety). Choose which categories to focus on based on your application's requirements:
Correctness
Output is factually accurate and grounded in provided data. Detects hallucinations, factual errors, and ungrounded responses.
Latency
Agent responds within acceptable time bounds. Identifies slow responses, timeouts, and performance bottlenecks.
Execution
Agent successfully completes actions (tool calls, API steps). Finds tool call failures, API errors, and execution problems.
Adherence
Response follows instructions, constraints, policies, and formatting. Catches instruction-following failures and formatting issues.
Relevance
Output is useful, directly addresses the user's request, and leaves the user satisfied with the interaction.
Safety
Response avoids harmful, sensitive, or inappropriate content. Detects safety violations and policy breaches.
Choosing Categories
Different applications have different priorities:
- Customer support bots: Focus on relevance and adherence to ensure helpful, policy-compliant responses
- Data retrieval systems: Prioritize correctness and execution to catch hallucinations and API failures
- Real-time agents: Emphasize latency and execution for responsive, reliable performance
- Content generation: Consider safety, adherence, and relevance for appropriate, on-topic outputs
You can select any combination of categories for each analysis. Starting with all categories gives comprehensive coverage, then narrow focus as you learn your application's common failure modes.
The Detection Experience
Getting Started
Issue detection is available from anywhere you view traces: overview dashboard, traces table, or chat sessions. When you're ready to analyze a set of traces, initiate detection and configure two things:
- Which issue categories to look for: Select the CLEARS dimensions most relevant to your use case
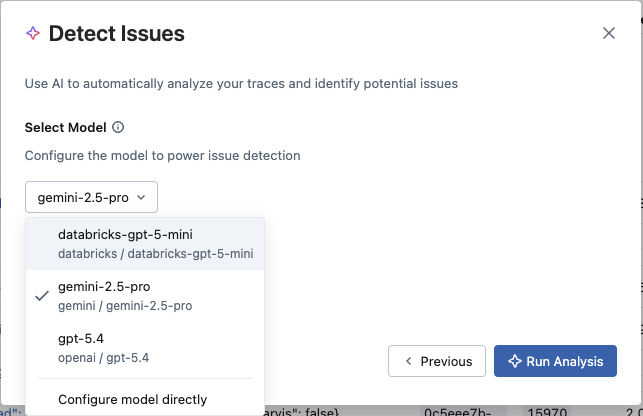
- Which LLM to use for analysis: Choose between an existing MLflow AI Gateway endpoint or connect directly to a provider (OpenAI, Anthropic, Gemini, etc.) using an API key. Cost tracking is supported across all options.
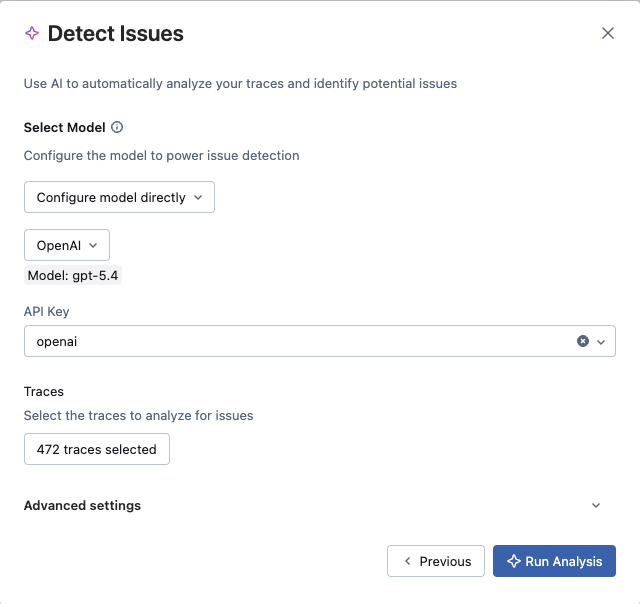
You can analyze all traces in your experiment or select a specific subset. For multi-turn conversations, you can group traces by session to get conversation-aware analysis.
Real-Time Analysis
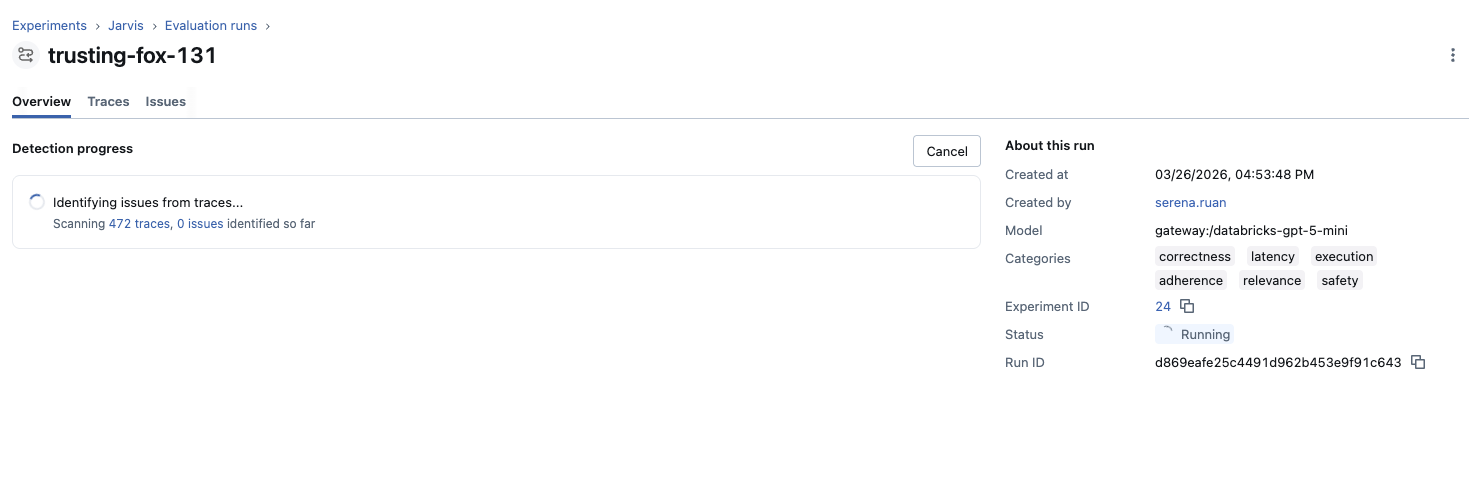
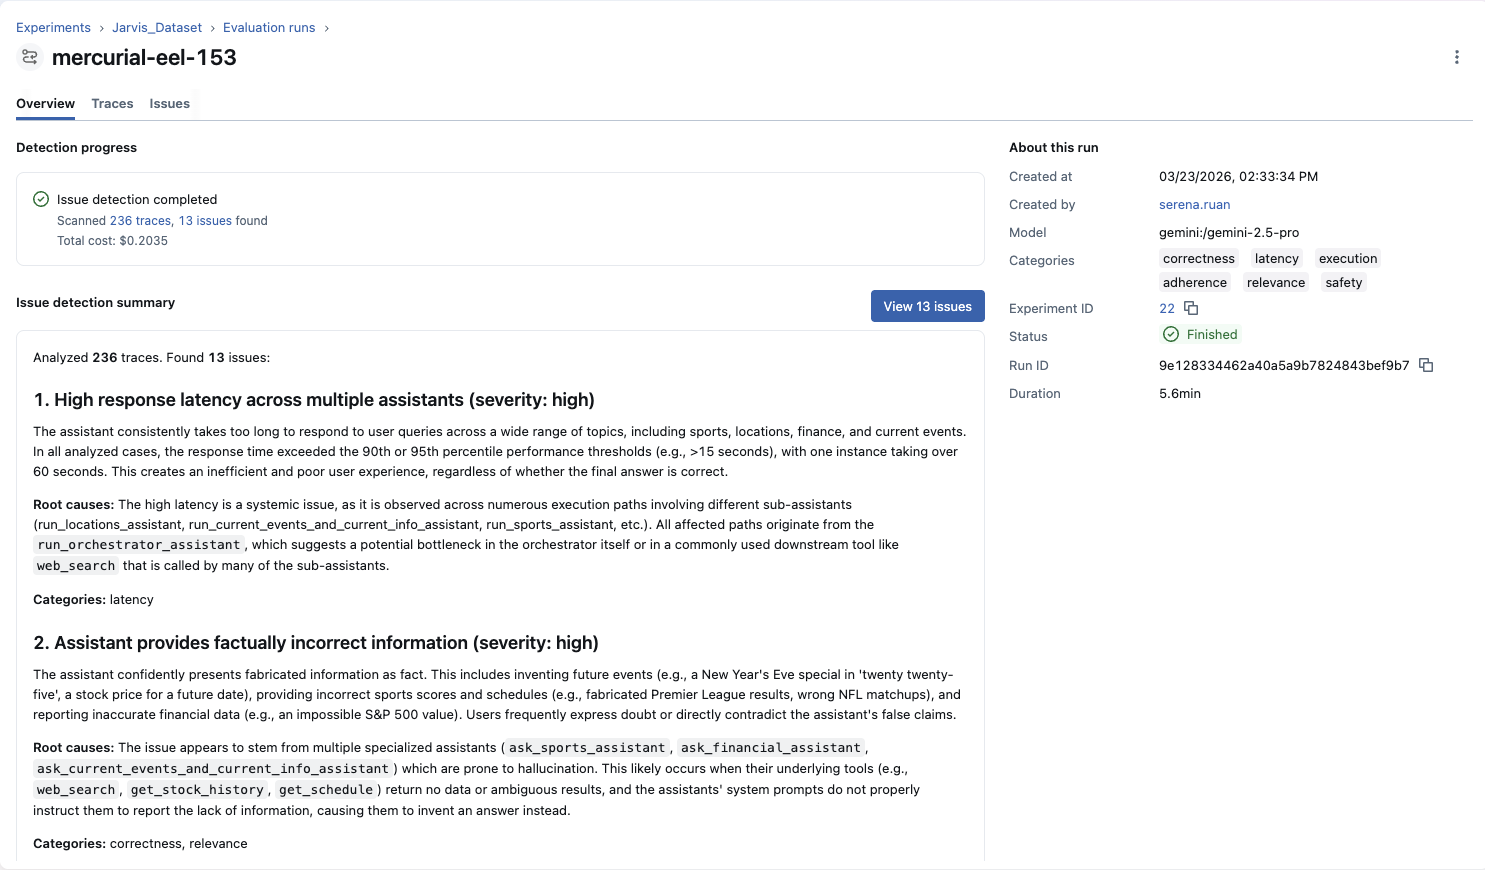
Once configured, analysis begins immediately and runs asynchronously. You can watch progress in real-time or navigate away—the job continues in the background. As the analysis runs, you'll see:
- Current status and progress
- Number of traces scanned
- Issues detected so far (updates live)
Once the job finishes, you'll also see the estimated LLM cost for the analysis.
Understanding Results
When analysis completes, you receive an AI-generated summary highlighting key findings, severity distribution, and recommended next steps. This summary gives you immediate context before diving into individual issues.
Working with Detected Issues
Issue Overview
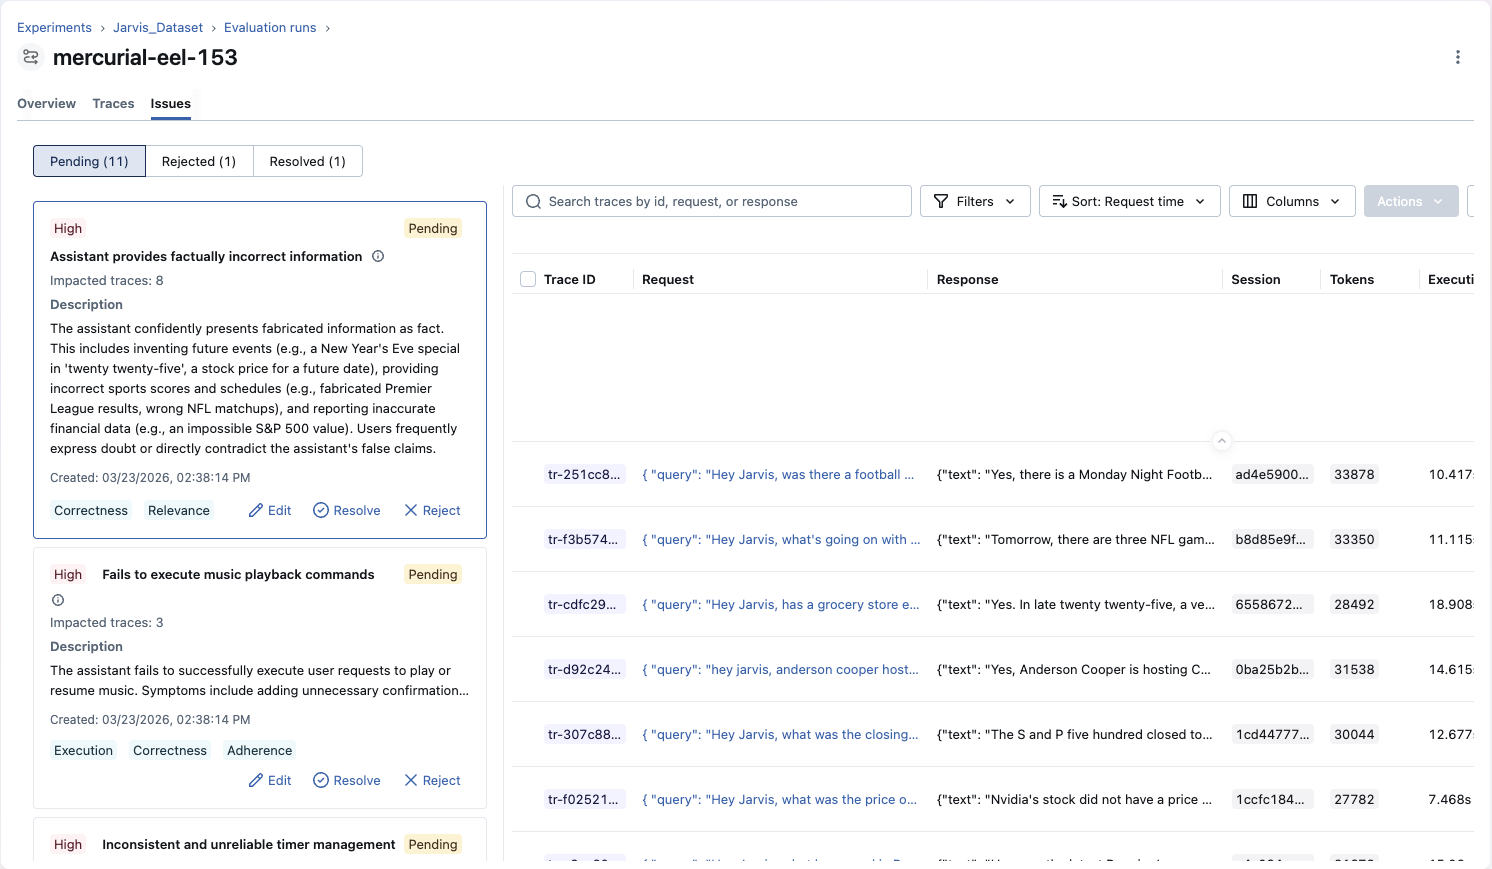
Each detected issue represents a cluster of related problems found across your traces. Issues provide:
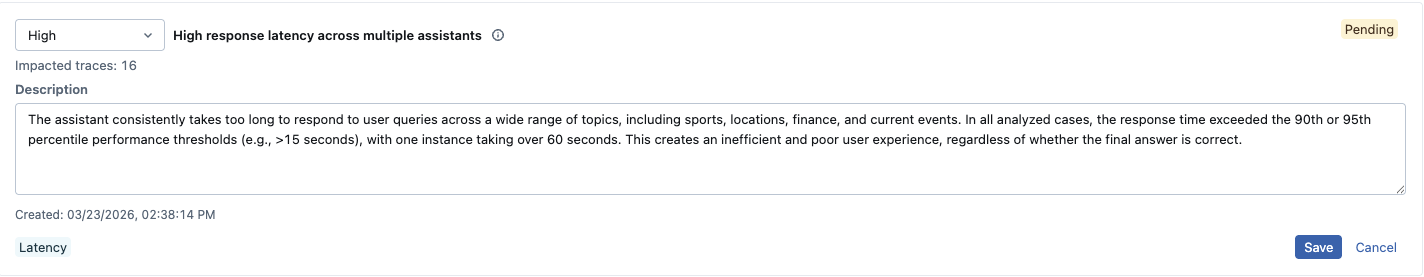
Description
What the problem is, why it occurs, and how it manifests in your application
Severity Rating
High, medium, or low priority based on impact and frequency
Affected Trace Count
Number of traces impacted, with direct links to each affected trace for investigation
Category Labels
Which CLEARS dimensions this issue relates to (correctness, latency, execution, etc.)
Issues maintain full lineage to the traces they were detected from, so you can always navigate from an issue back to the specific traces that surfaced it.
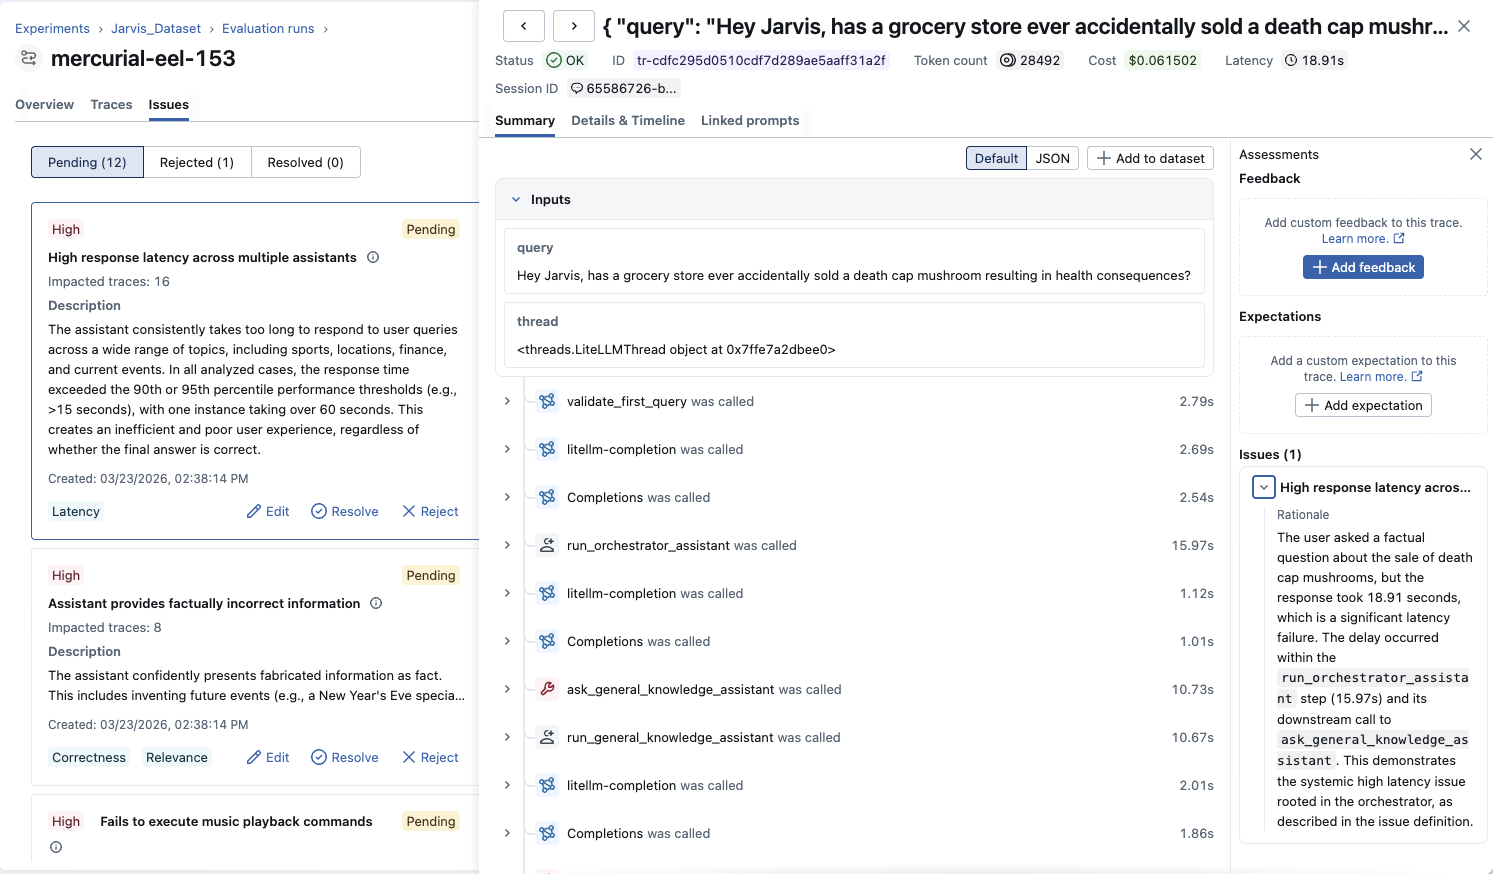
Investigating Issues
When you select an issue, you can explore all affected traces. Each trace shows why it was flagged with specific rationale explaining the problem in that particular example. This helps you:
- Verify the issue is real: Check if flagged traces genuinely demonstrate the problem
- Understand the pattern: See how the issue manifests across different contexts
- Identify root causes: Look for common factors in affected traces
- Gather examples: Collect representative cases for debugging or evaluation datasets, and use them to verify whether the issue is fixed after making changes
Managing and Triaging Issues
Issue Status
Issues are classified into three states:
- Pending: Newly discovered issues awaiting review
- Resolved: Issues you've fixed and verified
- Rejected: False positives or non-issues
You can filter by status to focus on what needs attention. Issues identified by the discovery job are initially marked as Pending, and can be triaged to Resolved or Rejected as you investigate.
Refining Issues
As you review issues, you can refine them to better reflect your domain knowledge and terminology:
- Edit descriptions: Clarify or expand issue descriptions with domain-specific details
- Adjust severity: Change priority levels based on business impact
These refinements help align discovered issues with your team's understanding and priorities.
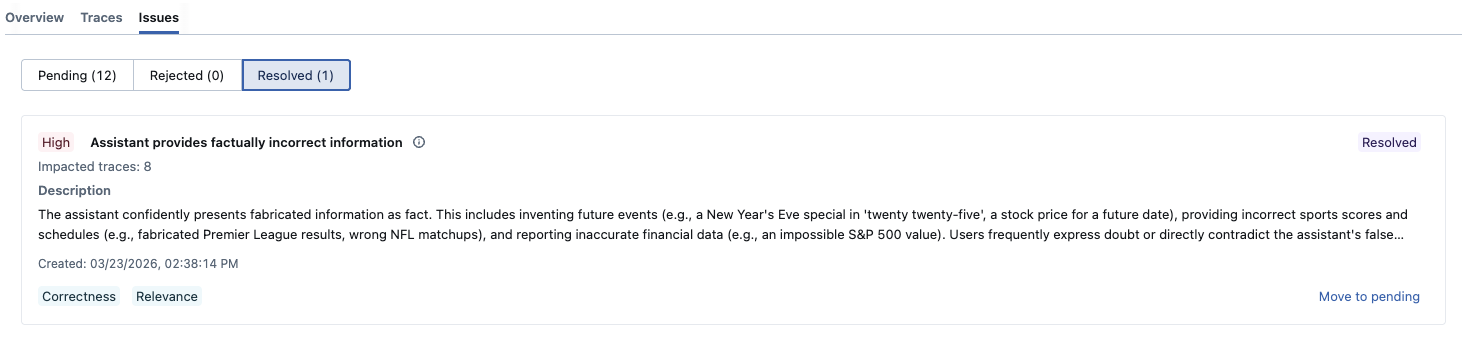
Tracking Progress
Mark issues as resolved when you've:
- Identified and fixed the root cause
- Deployed the fix to your application
- Verified the problem no longer occurs in new traces
Mark an issue as rejected when:
- It's a false positive: The flagged traces don't actually exhibit the described problem
- It's by design: The behavior is intentional, such as intentionally brief responses or domain-specific language
- It's out of scope: The issue is real but not something your team plans to address (e.g., an edge case with negligible user impact)
Rejecting false positives keeps your issue list focused and prevents noise from accumulating over time.
Best Practices
Effective Analysis
- Analyze representative data: Include traces from different user segments, time periods, and use cases
- Start comprehensive: Use all categories initially to discover your application's failure modes
- Focus iteratively: Narrow to specific categories as you learn common issues
- Verify findings: Always examine affected traces to confirm issues are real
- Regular cadence: Run detection periodically to catch new issues as your application evolves
Cost and Performance Trade-offs
Issue detection requires LLM calls to analyze each trace. Costs scale with:
- Number of traces analyzed
- Trace complexity and length
- Model size and pricing
- Number of categories selected
Cost benchmark
On April 16, 2026, we ran an internal benchmark sweep of issue detection across several chat models. The numbers below are indicative only—your tokens and dollar cost will differ with trace length, category selection, provider pricing, and product changes.
Setup: 402 verified traces in the evaluation pool; each run analyzed a deterministic subset of 50, 100, or 250 traces (seed 42)
Summary across all models by trace count:
| Traces | Typical cost | Issues found |
|---|---|---|
| 50 | $0.08–$0.42 | 5–9 |
| 100 | $0.11–$0.53 | 8–13 |
| 250 | $0.16–$0.93 | 10–22 |
Full model breakdown:
| Model | Traces | Input tokens | Output tokens | Cost (USD) | Issues found |
|---|---|---|---|---|---|
| gpt-5.4 | 50 | 38,004 | 6,549 | 0.19 | 9 |
| o3 | 50 | 25,253 | 10,866 | 0.14 | 6 |
| claude-opus-4-6 | 50 | 44,219 | 7,935 | 0.42 | 6 |
| claude-sonnet-4-6 | 50 | 45,139 | 7,837 | 0.25 | 8 |
| gemini-3.1-pro | 50 | 22,537 | 2,732 | 0.08 | 5 |
| gpt-5.4 | 100 | 59,085 | 9,976 | 0.30 | 13 |
| o3 | 100 | 51,508 | 25,789 | 0.31 | 8 |
| claude-opus-4-6 | 100 | 56,128 | 9,985 | 0.53 | 9 |
| claude-sonnet-4-6 | 100 | 80,965 | 15,062 | 0.47 | 11 |
| gemini-3.1-pro | 100 | 32,128 | 3,949 | 0.11 | 8 |
| gpt-5.4 | 250 | 114,285 | 20,578 | 0.59 | 22 |
| o3 | 250 | 61,733 | 30,173 | 0.36 | 12 |
| claude-opus-4-6 | 250 | 94,152 | 18,174 | 0.93 | 10 |
| claude-sonnet-4-6 | 250 | 97,299 | 18,062 | 0.56 | 14 |
| gemini-3.1-pro | 250 | 43,080 | 6,155 | 0.16 | 12 |
More capable models (for example gpt-5.4) generally improve issue detection quality in our testing; we still recommend starting with a strong default model, then tuning for cost or latency using Gateway budgets and smaller trace sets if needed.
To control costs at scale, connect via an MLflow AI Gateway endpoint and use its built-in budget controls to cap spending across detection runs.
When to Use Issue Detection
Issue detection complements other MLflow evaluation and monitoring capabilities:
| Use Issue Detection When... | Use Other Tools When... |
|---|---|
| You want to detect unknown problems | You know the specific quality dimensions or hypotheses to test: use MLflow Evaluation Judges |
| You need to analyze many traces at once | You're debugging a single trace: use MLflow Trace UI |
| You want to track, triage, and resolve identified issues over time | You need continuous production monitoring: use Automatic Evaluations to score every trace as it arrives |