Evaluate & Monitor FAQ
This page addresses frequently asked questions about MLflow's evaluation framework for LLM applications and AI agents.
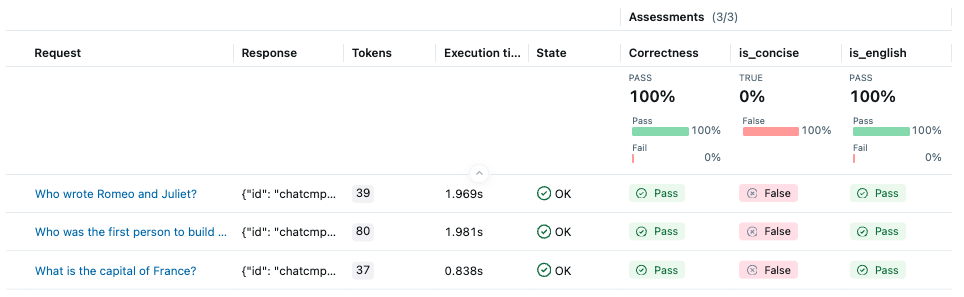
Where can I find the evaluation results in MLflow UI?
After an evaluation completes, you can find the resulting runs on the experiment page. Click the run name to view aggregated metrics and metadata in the overview pane.
To inspect per-row evaluation results, open the Traces tab on the run overview page.
How to change the concurrency of the evaluation?
MLflow uses thread pools to run the predict function and scorers in parallel. You can configure concurrency at two levels:
1. Data-level concurrency: Controls how many data items are evaluated in parallel.
# Limit concurrent data items being evaluated (default: 10)
export MLFLOW_GENAI_EVAL_MAX_WORKERS=5
2. Scorer-level concurrency: Controls how many scorers run in parallel for each data item. The actual number of scorer workers will not exceed the number of scorers being used.
# Limit concurrent scorer execution (default: 10)
export MLFLOW_GENAI_EVAL_MAX_SCORER_WORKERS=2

# For strict rate limiting, run scorers sequentially
export MLFLOW_GENAI_EVAL_MAX_SCORER_WORKERS=1
The total maximum concurrent API calls is approximately MLFLOW_GENAI_EVAL_MAX_WORKERS × min(MLFLOW_GENAI_EVAL_MAX_SCORER_WORKERS, num_scorers). Adjust these values based on your LLM provider's rate limits, especially when using free tiers.
Can I use async functions as predict_fn?
Yes! MLflow automatically detects and wraps async functions. The async function will be executed with a timeout to prevent indefinite hangs.
Configure the timeout (in seconds) using the MLFLOW_GENAI_EVAL_ASYNC_TIMEOUT environment variable (default: 300 seconds):
export MLFLOW_GENAI_EVAL_ASYNC_TIMEOUT=600 # 10 minutes
For Jupyter Notebooks: Install nest_asyncio to use async functions in notebook environments:
pip install nest_asyncio
Example with an async predict function:
import asyncio
from openai import AsyncOpenAI

client = AsyncOpenAI()


async def async_predict_fn(question: str) -> str:
    """Async prediction function using OpenAI"""
    response = await client.chat.completions.create(
        model="gpt-4o-mini",
        messages=[{"role": "user", "content": question}],
    )
    return response.choices[0].message.content


mlflow.genai.evaluate(
    data=eval_dataset,
    predict_fn=async_predict_fn,  # Async function automatically supported
    scorers=[Correctness()],
)
Why does MLflow make N+1 predictions during evaluation?
MLflow requires the predict function passed through the predict_fn parameter to emit a single trace per call. To ensure the function produces a trace, MLflow first runs one additional prediction on a single input.
If you are confident the predict function already generates traces, skip this validation by setting the MLFLOW_GENAI_EVAL_SKIP_TRACE_VALIDATION environment variable to true.
export MLFLOW_GENAI_EVAL_SKIP_TRACE_VALIDATION=true
How do I change the name of the evaluation run?
By default, mlflow.genai.evaluate generates a random run name. Set a custom name by wrapping the call with mlflow.start_run.
with mlflow.start_run(run_name="My Evaluation Run") as run:
    mlflow.genai.evaluate(...)
How do I use Databricks Model Serving endpoints as the predict function?
MLflow provides mlflow.genai.to_predict_fn(), which wraps a Databricks Model Serving endpoint so it behaves like a predict function compatible with the evaluation framework.
The wrapper:
- Translates each input sample into the request payload expected by the endpoint.
- Injects
{"databricks_options": {"return_trace": True}}so the endpoint returns a model-generated trace. - Copies the trace into the current experiment so it appears in the MLflow UI.
import mlflow
from mlflow.genai.scorers import Correctness

mlflow.genai.evaluate(
    # The {"messages": ...} part must be compatible with the request schema of the endpoint
    data=[{"inputs": {"messages": [{"role": "user", "content": "What is MLflow?"}]}}],
    # Your Databricks Model Serving endpoint URI
    predict_fn=mlflow.genai.to_predict_fn("endpoints:/chat"),
    scorers=[Correctness()],
)
How to migrate from MLflow 2 LLM Evaluation?
See the Migrating from MLflow 2 LLM Evaluation guide.
How do I track the cost of LLM judges?
MLflow visualizes the cost of LLM judges in the assessment pane of the trace details page. When you open an assessment logged by an LLM judge, you can see the cost incurred for running the judge model. This feature is available only when you have the LiteLLM library installed.
Managing the balance between cost and accuracy is important. To use a more cost-effective LLM model while maintaining accuracy, you can leverage the LLM Judge Alignment feature.
How do I pass additional inference parameters to judge LLMs?
LLM-as-a-Judge scorers like Correctness and Guidelines accept an inference_params argument to customize the judge model's behavior. This allows you to control parameters such as temperature, max_tokens, and other model-specific settings.
from mlflow.genai.scorers import Correctness, Guidelines

# Pass inference parameters to control judge behavior
correctness_scorer = Correctness(
    inference_params={
        "temperature": 0.0,  # More deterministic responses
        "max_tokens": 500,
    }
)

guidelines_scorer = Guidelines(
    name="tone_check",
    guidelines="The response should be professional and helpful.",
    inference_params={
        "temperature": 0.0,
    },
)

mlflow.genai.evaluate(
    data=eval_dataset,
    predict_fn=my_predict_fn,
    scorers=[correctness_scorer, guidelines_scorer],
)
The available inference parameters depend on the model provider being used. Common parameters include:
temperature: Controls randomness (0.0 = deterministic, higher = more random)max_tokens: Maximum tokens in the responsetop_p: Nucleus sampling parameter
How do I debug my scorers?
To debug your scorers, you can enable tracing for the scorer functions by setting the MLFLOW_GENAI_EVAL_ENABLE_SCORER_TRACING environment variable to true.
export MLFLOW_GENAI_EVAL_ENABLE_SCORER_TRACING=true
When this is set to true, MLflow will trace scorer executions during the evaluation and allow
you to inspect the input, output, and internal steps during the scorer execution.
To view the scorer trace, you can open the assessment pane of the trace details page and click the "View trace" link.
How do I programmatically access evaluation results?
The mlflow.genai.evaluate() function returns an mlflow.genai.evaluation.entities.EvaluationResult() object that contains all evaluation results. Here's how to access different parts of the results:
Accessing Aggregated Metrics
The metrics property returns a dictionary of aggregated metric values across all evaluated rows:
result = mlflow.genai.evaluate(
    data=eval_dataset,
    predict_fn=my_predict_fn,
    scorers=[Correctness(), Safety()],
)

# Access aggregated metrics
print(result.metrics)
# Output: {'correctness/mean': 0.85, 'safety/mean': 0.95}

# Access a specific metric
correctness_score = result.metrics.get("correctness/mean")
To get metrics for an existing evaluation run, you can use mlflow.get_run() API:
run = mlflow.get_run(run_id="<run_id>")
print(run.data.metrics)
# Output: {'correctness/mean': 0.85, 'safety/mean': 0.95}
Accessing the Results DataFrame
The result_df property returns a pandas DataFrame containing detailed per-row evaluation results:
# Export to CSV for further analysis
result.result_df.to_csv("evaluation_results.csv", index=False)
Accessing Traces from Results
You can get the traces for the evaluation run by using mlflow.search_traces() API:
traces = mlflow.search_traces(run_id=result.run_id, return_type="list")