Distributed Tracing
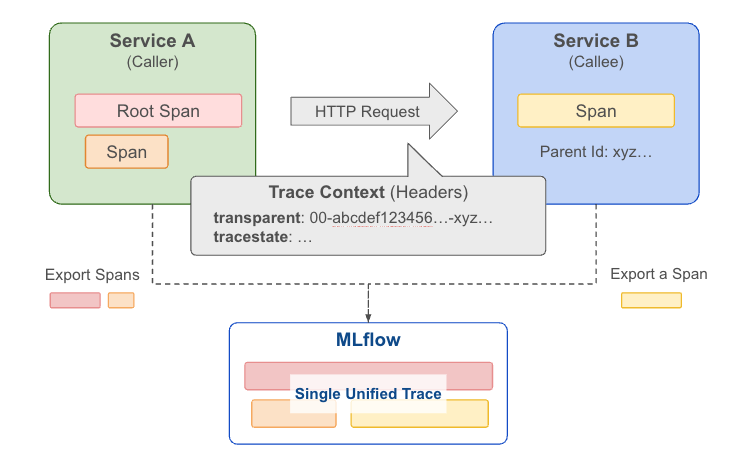
When your application spans multiple services, you may want to connect spans from these services into a single trace for tracking the end-to-end execution in one place. MLflow supports this via Distributed Tracing, by propagating the active trace context over HTTP so that spans recorded in different services are stitched together.
How It Works
MLflow is OpenTelemetry-compatible, so trace context is propagated through the HTTP headers following the W3C TraceContext specification. MLflow provides two APIs to simplify handling the headers at the client and server sides:
- Use get_tracing_context_headers_for_http_request in the client side (caller service) to get headers containing the current trace context.
- Use set_tracing_context_from_http_request_headers in the server side (callee service) to extract the trace and span information from the incoming request headers.
Prerequisites
For distributed tracing to work, both services must log traces to the same MLflow tracking server and the same experiment:
- Start an MLflow tracking server (or use a shared remote server).
- In every service, set the tracking URI and experiment before creating spans.
export MLFLOW_TRACKING_URI="http://localhost:5000"
export MLFLOW_EXPERIMENT_NAME="distributed-tracing-demo"
or
import mlflow

mlflow.set_tracking_uri("http://localhost:5000")
mlflow.set_experiment("distributed-tracing-demo")
If services use different experiments, their spans will end up in separate traces instead of being merged into one.
Usage Example
Below is a runnable two-service example using FastAPI. The client creates the root span and calls the server, which adds a nested span under the same trace.
Server (Callee Service)
Create a server.py file with the following content:
import mlflow
import uvicorn
from fastapi import FastAPI, Request
from mlflow.tracing import set_tracing_context_from_http_request_headers

# Set the tracking URI and experiment
mlflow.set_tracking_uri("http://localhost:5000")
mlflow.set_experiment("distributed-tracing-demo")

app = FastAPI()


@app.post("/handle")
async def handle(request: Request):
    headers = dict(request.headers)
    body = await request.json()
    with set_tracing_context_from_http_request_headers(headers):
        # This span will be added to the same trace as a child span
        with mlflow.start_span("server-handler") as span:
            span.set_inputs(body)
            result = {"response": f"Processed: {body.get('input', '')}"}
            span.set_outputs(result)
    return result


if __name__ == "__main__":
    uvicorn.run(app, host="0.0.0.0", port=5001)
Client (Caller Service)
Create a client.py file with the following content:
import requests
import mlflow
from mlflow.tracing import get_tracing_context_headers_for_http_request

# Connect to the same tracking server and experiment as the server
mlflow.set_tracking_uri("http://localhost:5000")
mlflow.set_experiment("distributed-tracing-demo")

# Create a root span at client side
with mlflow.start_span("client-root") as span:
    span.set_inputs({"input": "hello"})
    headers = get_tracing_context_headers_for_http_request()
    response = requests.post(
        "http://localhost:5001/handle", headers=headers, json={"input": "hello"}
    )
    span.set_outputs(response.json())
Run it
# Terminal 1 — start the server
python server.py

# Terminal 2 — run the client
python client.py
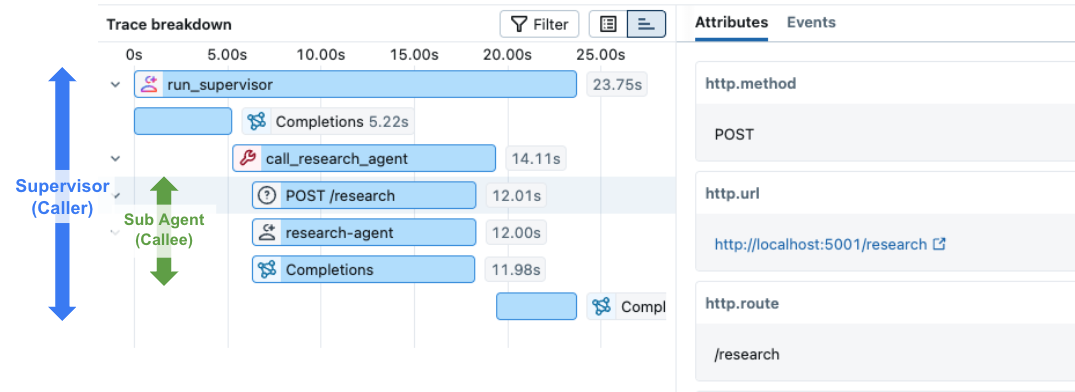
Open the MLflow UI at http://localhost:5000 and navigate to the distributed-tracing-demo experiment. You will see a single trace containing spans from both the client and the server:
AI Gateway Integration
When an agent calls an MLflow AI Gateway endpoint with usage tracking enabled, the gateway automatically creates a trace for each request. If the agent also sends a traceparent header, the gateway will create a lightweight span under the agent's trace that links to the full gateway trace and includes token usage.
An important note for AI Gateway integration is that the gateway trace and the agent trace are stored in different experiments, while they are linked together through a span attribute. The gateway trace is a full trace with request/response payloads and token usage, while the agent trace includes a lightweight span gateway/<endpoint_name> that contains a link to the gateway trace and token usage in span attributes. This design allows aggregating gateway usage across experiments while avoiding storing duplicated payloads.
- Gateway experiment — full trace with request/response payloads and token usage
- Agent experiment — agent trace with a child
gateway/<endpoint_name>span containing a link to the gateway trace and token usage (no duplicated payloads)
To enable this, pass the traceparent header when calling the gateway from within an active span:
import mlflow
import requests
from mlflow.tracing import get_tracing_context_headers_for_http_request
from openai import OpenAI

client = OpenAI(
    base_url="http://localhost:5000/gateway/openai/v1",
    api_key="dummy",
)

with mlflow.start_span("my-agent"):
    headers = get_tracing_context_headers_for_http_request()
    response = client.chat.completions.create(
        model="my-endpoint",
        messages=[{"role": "user", "content": "Hello!"}],
        extra_headers=headers,
    )
The gateway endpoint must have usage tracking enabled for both the gateway trace and the distributed span to be created.
Limitation in Databricks
If you set up MLflow tracking to Databricks, to make distributed tracing work, the trace destination must be set to Unity Catalog. Please refer to Store MLflow traces in Unity Catalog for details.