Tracing Claude Code
MLflow Tracing provides automatic tracing for the Claude Code CLI. Once configured, every Claude Code session in your project is recorded to MLflow with:
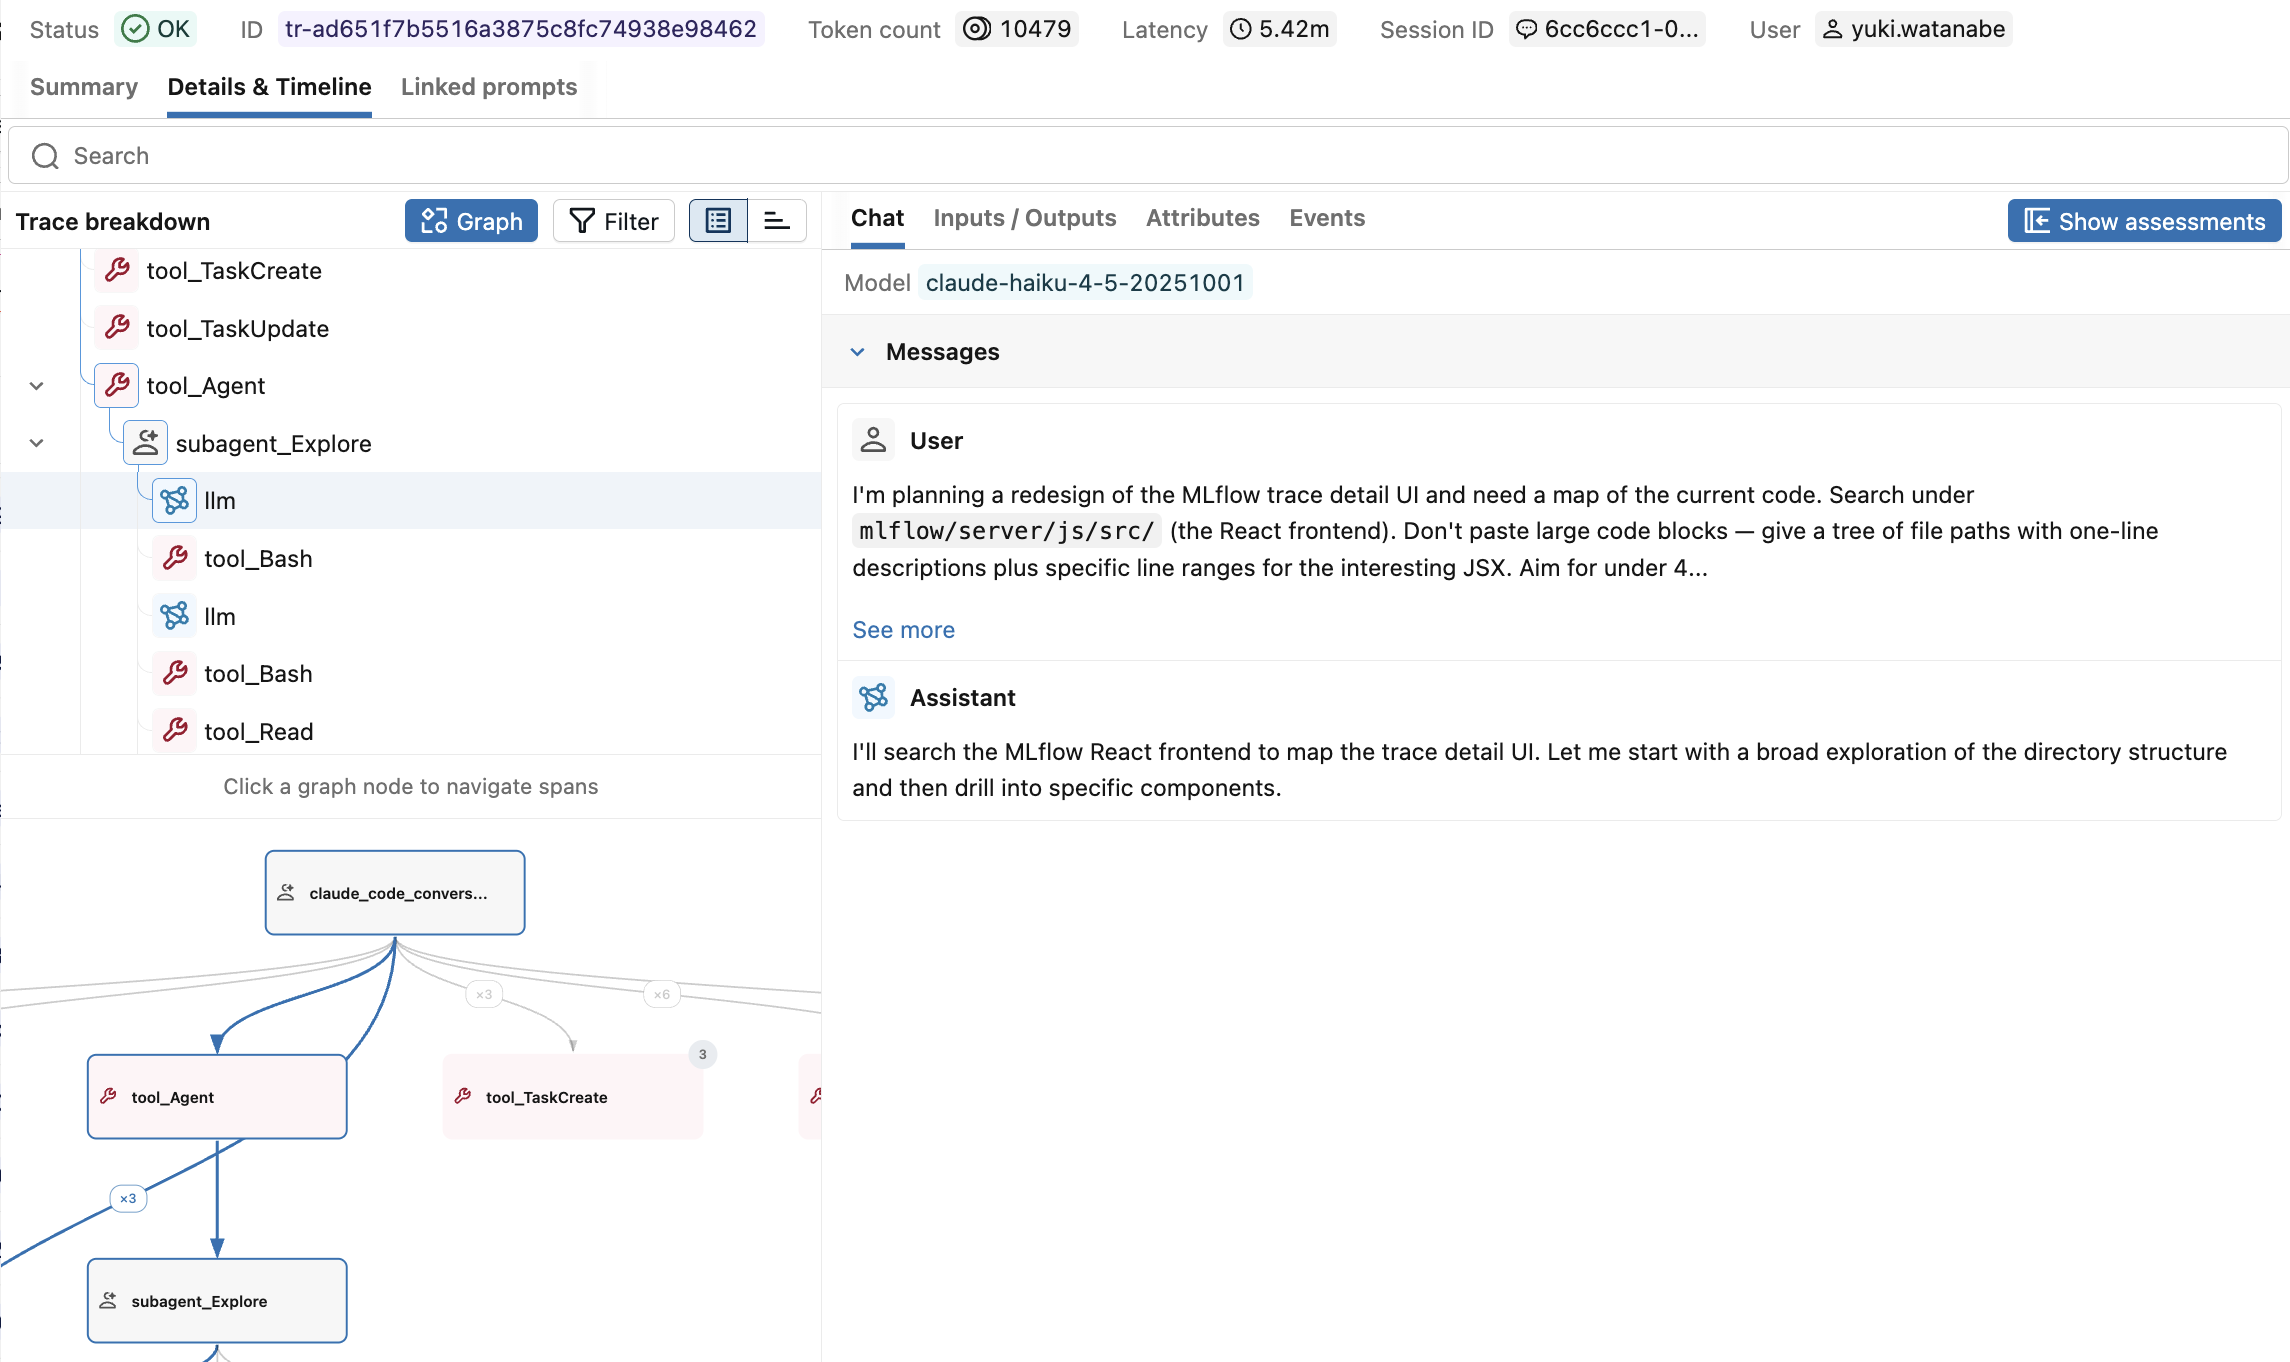
- User prompts and assistant responses
- Tool calls (file reads/edits, bash, web fetches, etc.) with their inputs and outputs
- Subagent invocations with the full nested trace of every step they ran
- Skill usage
- Per-call and per-session token usage and cost
- Latency and timing for each step
- Session metadata (working directory, user, model)
This page covers tracing the Claude Code CLI. If you're building an application on top of the Claude Agent SDK, see Claude Agent SDK (Python) or Claude Agent SDK (TypeScript) instead.
Setup
There are two ways to enable Claude Code tracing. Pick whichever fits your environment:
- Claude Code Plugin (Recommended)
- MLflow Python SDK
The MLflow Tracing plugin is the easiest way to enable tracing - it installs straight inside Claude Code and doesn't require a local Python environment with MLflow.
Step 1. Add the MLflow plugin marketplace
Run this from your terminal (not from inside Claude Code) in the repo you want to trace:
claude plugin marketplace add mlflow/mlflow --sparse .claude-plugin
The in-Claude /plugin marketplace add command clones the full mlflow/mlflow repo and often times out. Use the terminal command above with --sparse .claude-plugin instead.
Step 2. Install the plugin
From your terminal:
claude plugin install mlflow-tracing@mlflow-plugins
Run claude to launch Claude Code (or restart it if it's already running) so the plugin is loaded.
Step 3. Run the setup command
Inside Claude Code, run the plugin's setup command and follow the wizard, providing the required values (tracking URI, experiment, scope):
/mlflow-tracing:setup
Step 4. Confirm the configuration
/mlflow-tracing:status
This reports whether tracing is enabled, the active tracking URI, the active experiment, and which scope (environment, project, user, or none) the configuration came from.
Step 5. Use Claude Code as usual
Once setup is complete, every Claude Code session in this project is traced automatically. The trace is exported to MLflow when the session ends.
If you already have a Python environment with MLflow installed, you can configure tracing through the MLflow CLI instead.
Requirements
- MLflow >= 3.4 (
pip install 'mlflow>=3.4') - Claude Code CLI installed and configured
Basic setup
# Set up tracing in current directory
mlflow autolog claude

# Set up tracing in a specific directory
mlflow autolog claude -d ~/my-project

# Check tracing status
mlflow autolog claude --status

# Disable tracing
mlflow autolog claude --disable
Configuration examples
# Set up with custom tracking URI
mlflow autolog claude -u file://./custom-mlruns
mlflow autolog claude -u sqlite:///mlflow.db

# Set up with Databricks backend and a specific experiment ID
mlflow autolog claude -u databricks -e 123456789

# Set up with a specific experiment name
mlflow autolog claude -n "My AI Project"
How it works
- Setup:
mlflow autolog claudewrites Claude Code hooks into.claude/settings.jsonin your project directory. - Automatic tracing: When you run
claudein the configured directory, sessions are traced automatically. - View results: Start
mlflow server(or point at your existing backend) and open the MLflow UI.
Basic example
# Set up tracing in your project
mlflow autolog claude -d ~/my-project

# Navigate to the project directory
cd ~/my-project

# Use Claude Code normally - tracing happens automatically
claude "help me refactor this Python function to be more efficient"

# View traces in the MLflow UI
mlflow server
Tracking Token Usage and Cost
MLflow automatically tracks token usage and cost for Claude Code sessions without any extra setup. Token counts for each LLM call are logged on the relevant span, and the aggregated cost and time trends are displayed in the built-in experiment dashboard.
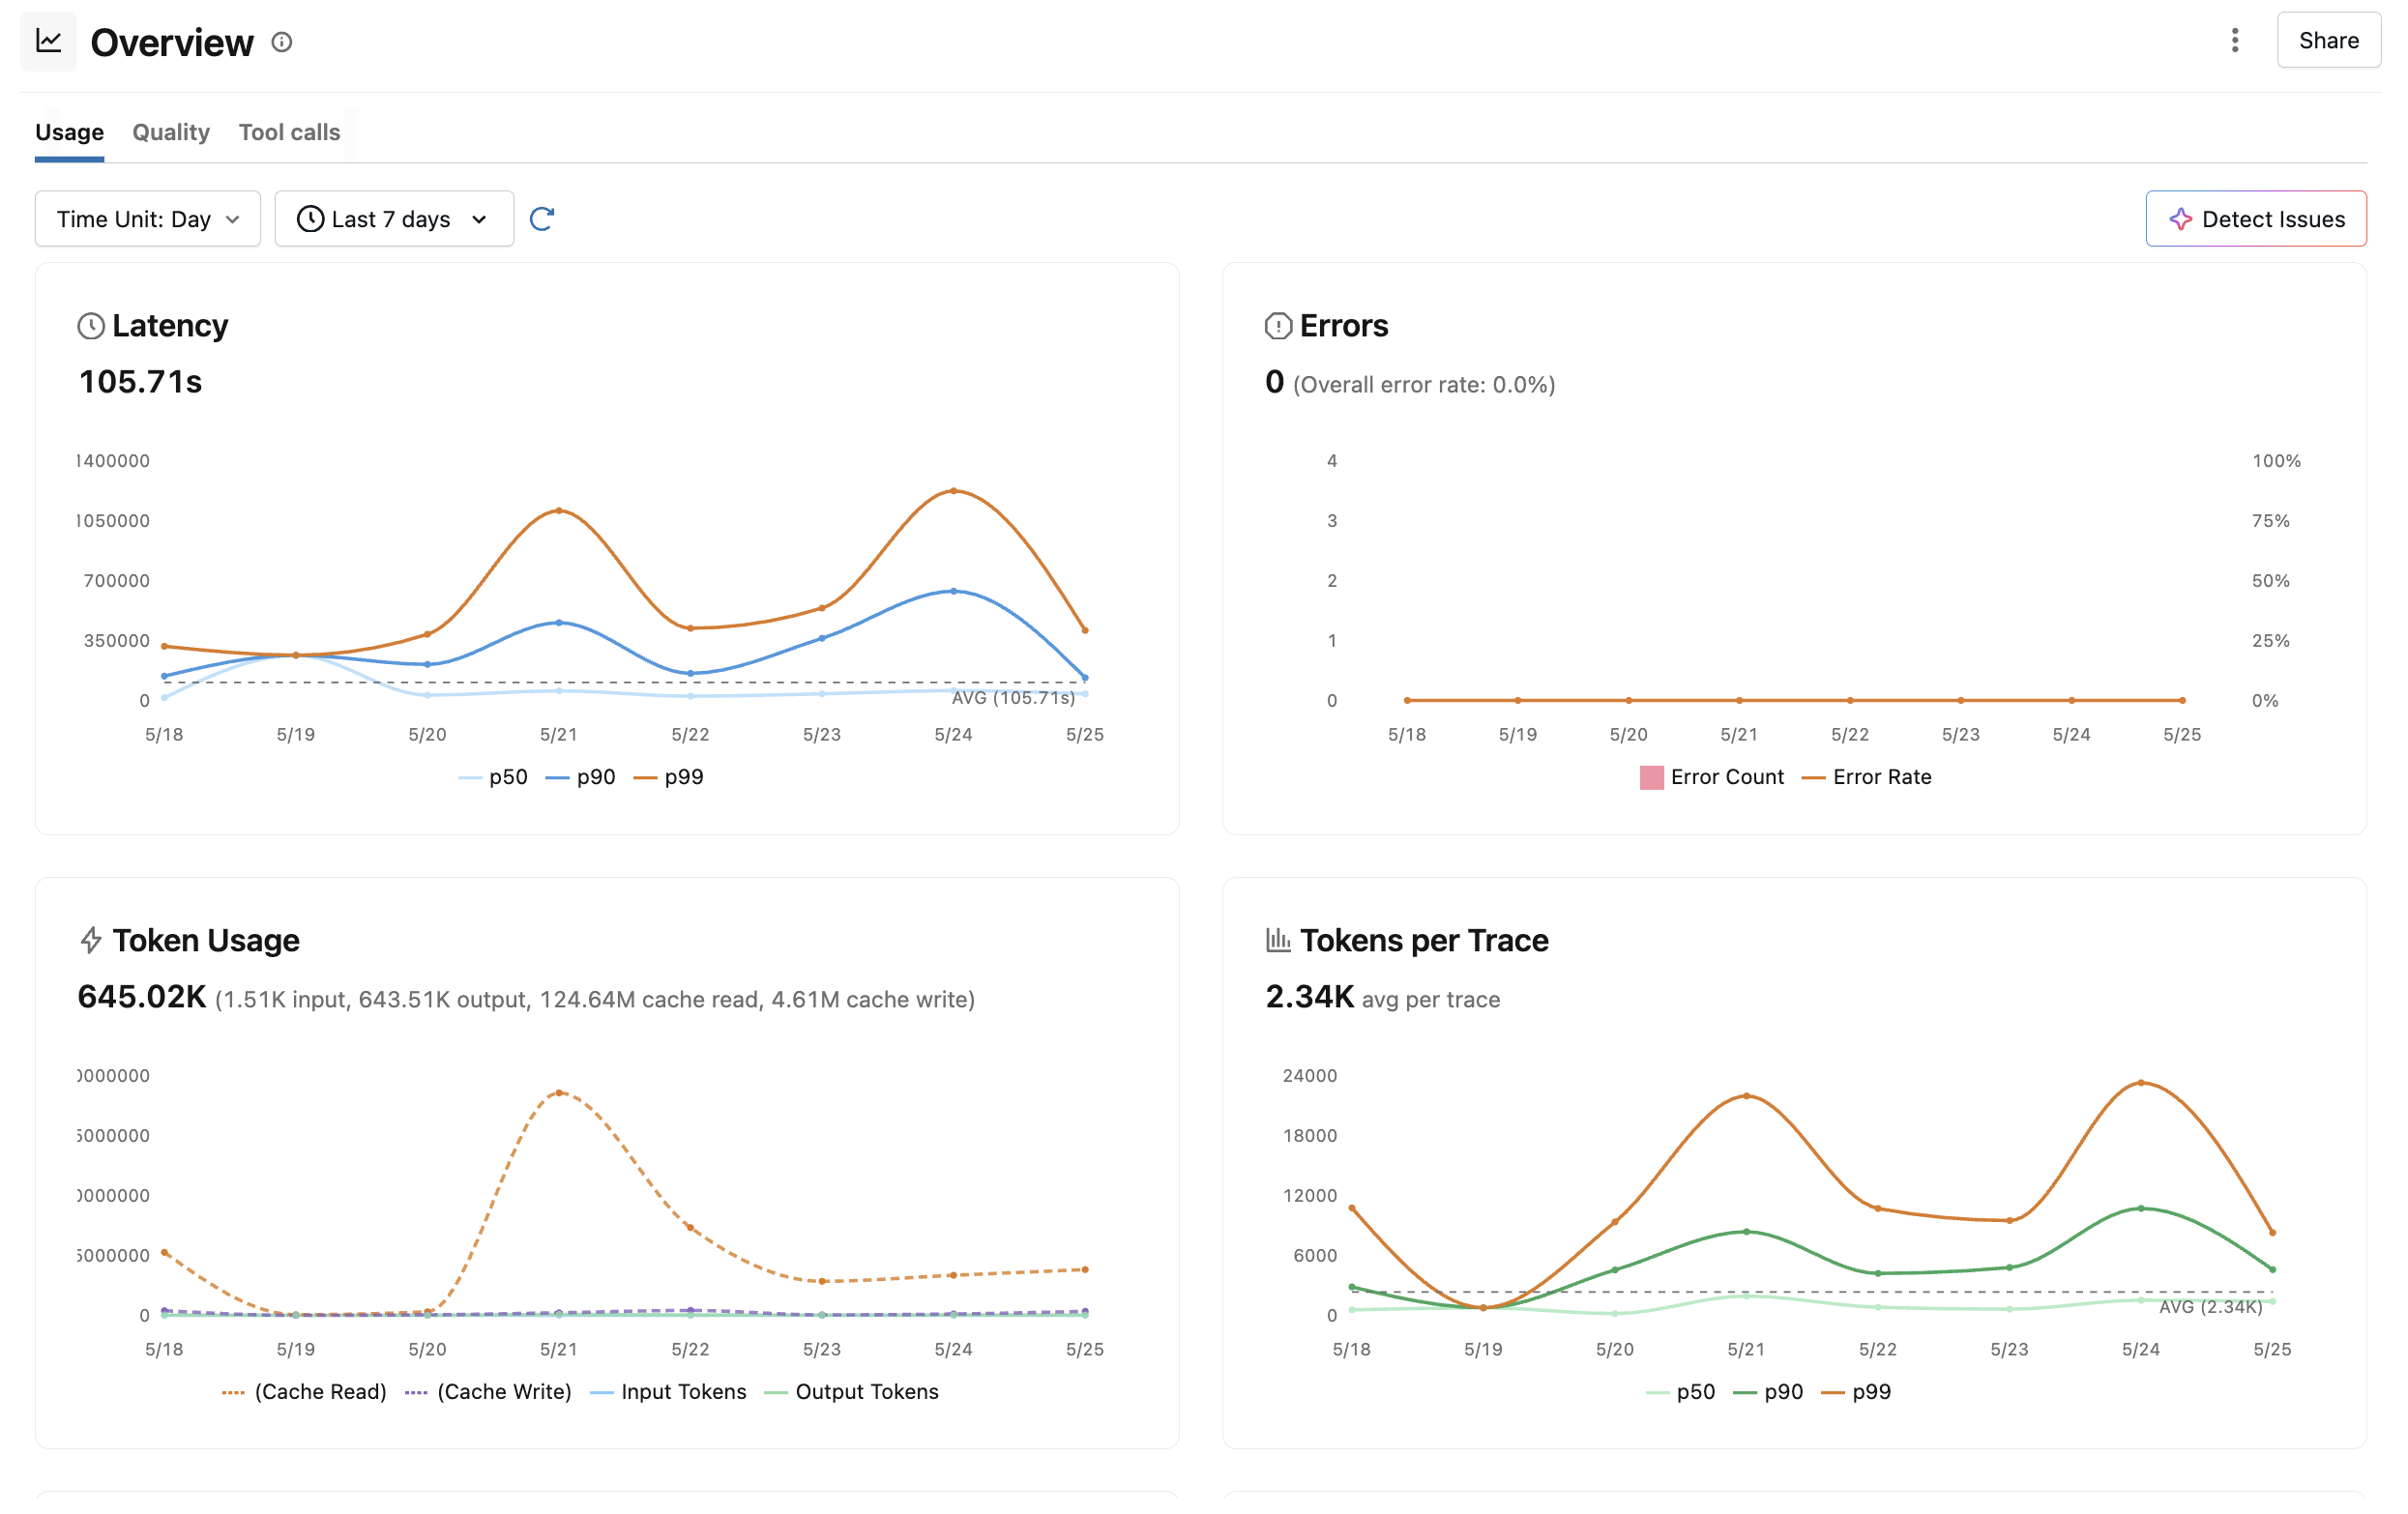
See Token Usage and Cost Tracking for details on accessing this information programmatically.
Troubleshooting
Tracing not working
- Confirm the plugin is installed (
claude plugin list) or thatmlflow autolog claude --statusreports tracing enabled. - Restart Claude Code after installing the plugin so it's loaded.
- Verify the tracking URI is reachable from your machine.
- Check that the correct settings file was written:
./.claude/settings.json(project scope) or~/.claude/settings.json(user scope).
Missing traces
- Claude Code traces are exported when a session ends, so they only appear in MLflow after you exit the session.
- Check whether shell-level
MLFLOW_*environment variables are overriding your project or user settings. - Verify the configured experiment exists and the resolved experiment ID is valid.
- For the MLflow Python SDK setup, review logs in
.claude/mlflow/claude_tracing.log.
Disabling tracing
- Plugin:
claude plugin uninstall mlflow-tracing@mlflow-plugins(orclaude plugin disable ...). - MLflow Python SDK:
mlflow autolog claude --disable. - Runtime override: set
MLFLOW_CLAUDE_TRACING_ENABLED=falsein the environment that launchesclaude.