Tracing Codex CLI
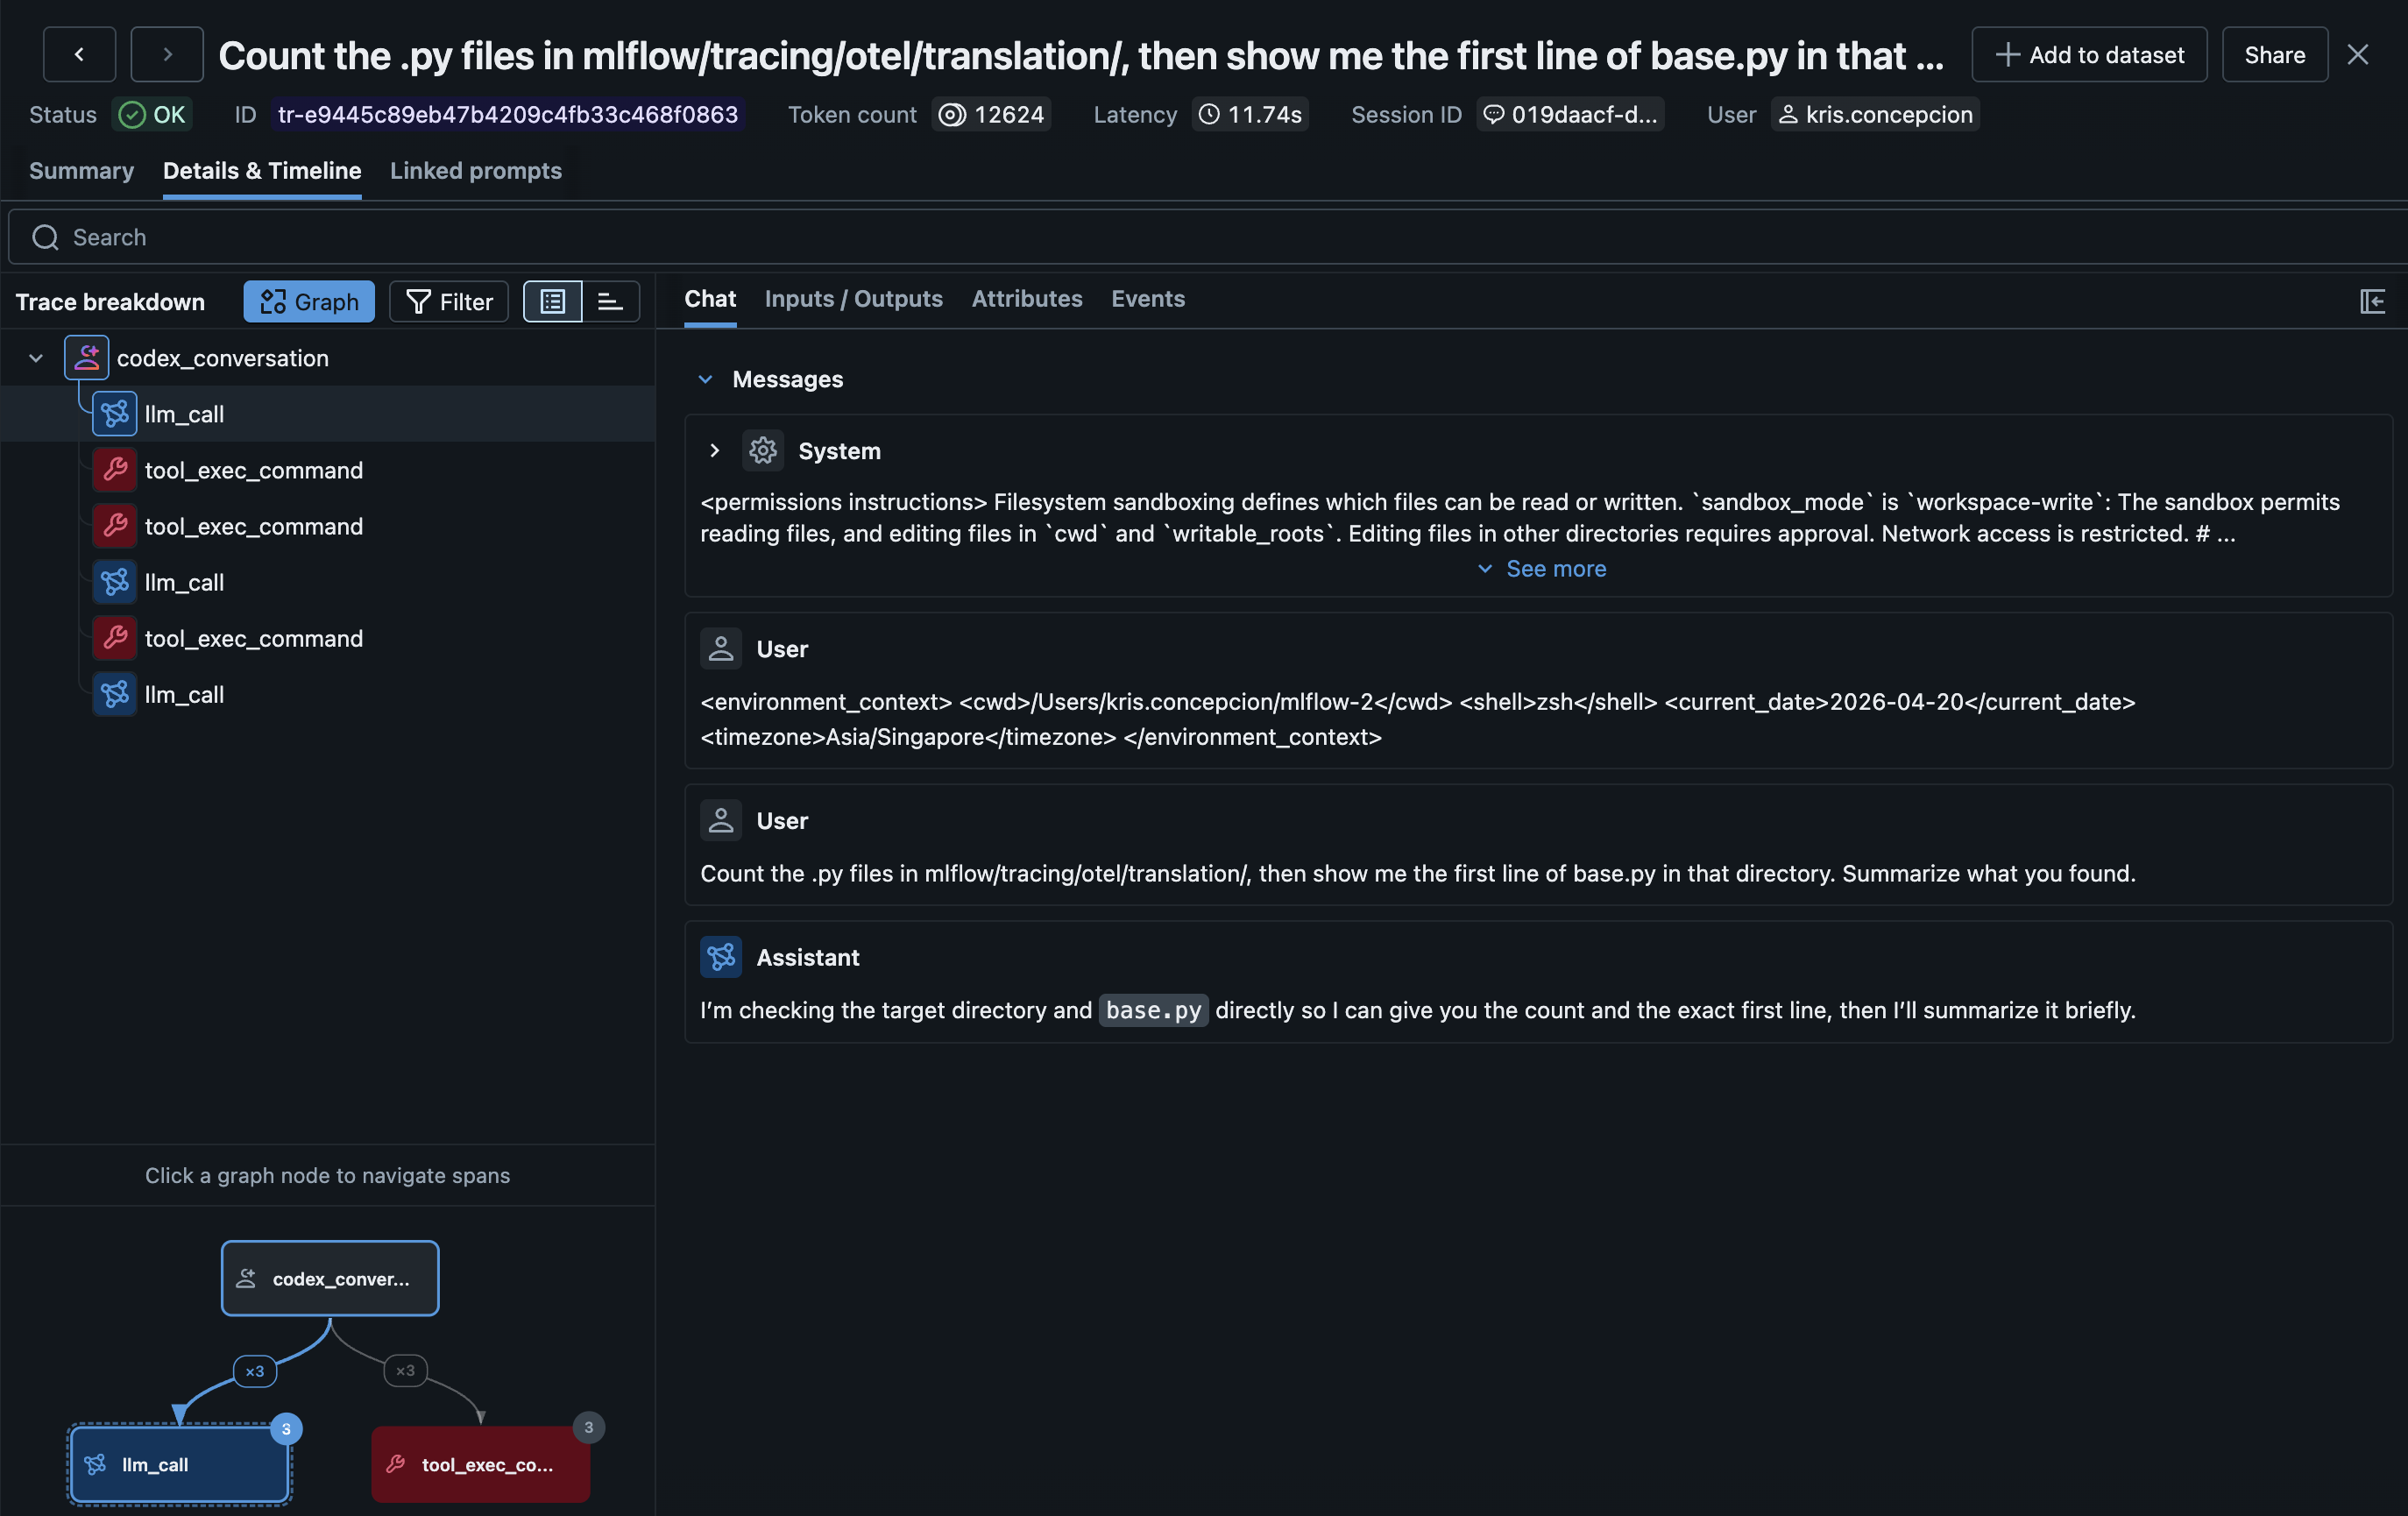
MLflow Tracing provides automatic tracing for Codex CLI, OpenAI's terminal-based coding agent. After setup, MLflow will automatically capture traces of your Codex conversations including:
- User prompts and assistant responses
- Tool usage (shell commands, file operations, etc.)
- Token usage (input, output, and total tokens)
- Session metadata including working directory and user
Traces are created after each conversation turn — no need to wait for the session to end.
Setup
Requirements
- MLflow tracking server running
- Codex CLI installed
- Node.js 18+
- The
@mlflow/codexnpm package
Step 1: Install the Tracing Plugin
npm install -g @mlflow/codex
If you'd rather not install globally, you can invoke the bin through npx (e.g. npx @mlflow/codex setup) — everything below works the same way.
Step 2: Run the Setup Command
Running mlflow-codex setup starts an interactive flow for setting up the tracing hook.
~/my-project $ mlflow-codex setup

Configure MLflow tracing for Codex CLI
? Where should MLflow tracing be installed?
  ● Project  ./.codex/  (default)
  ○ User  ~/.codex/

  ↑/↓ to move, enter to select

✓ Created /path/to/project/.codex/config.toml with notify hook

  MLflow tracking URI [http://localhost:5000] http://localhost:5000
  MLflow experiment ID [0] 1

✓ Wrote tracing config to /path/to/project/.codex/mlflow-tracing.json

Next steps
  1. Start the MLflow tracking server in a separate terminal:
       mlflow server --port 5000
  2. Launch codex — traces appear at http://localhost:5000 after each turn.
Pass --non-interactive / -y to skip the interactive flow and use the default values.
Setup refuses to overwrite a pre-existing notify = ... entry so your Codex config is never mangled — edit config.toml yourself if a different notifier is already registered.
Step 3: Start the MLflow Tracking Server
The MLflow server must be running to receive traces. Start it in a separate terminal:
mlflow server --port 5000
Step 4: Use Codex Normally
codex "help me refactor this function"
Traces become visible at http://localhost:5000 after each turn completes.
MLFLOW_TRACKING_URI and MLFLOW_EXPERIMENT_ID environment variables (if set in the shell that launched codex) override the values written to mlflow-tracing.json. This is convenient for one-off overrides in CI or when switching between local and Databricks endpoints.
How It Works
- The
notifyhook inconfig.tomlfires after each Codex conversation turn - Codex passes the turn data (user prompt, assistant response) as a JSON argument
- The plugin optionally reads the session transcript (a JSONL rollout file) for richer data like tool calls and token usage
- An MLflow trace is created with an AGENT root span and LLM/TOOL child spans
Configuration Examples
The setup command writes two configuration files:
./.codex/config.toml— addsnotify = ["mlflow-codex", "notify-hook"]so Codex invokes the hook after every turn../.codex/mlflow-tracing.json— persists your MLflow config so the hook can run without shell exports.
If you prefer to edit these manually, the equivalent entries are:
notify = ["mlflow-codex", "notify-hook"]
{
  "trackingUri": "http://localhost:5000",
  "experimentId": "0"
}
Per-run overrides via environment variables (take precedence over the config file):
MLFLOW_TRACKING_URI=databricks MLFLOW_EXPERIMENT_ID=123456789 codex "..."
OTLP Tracing (Suitable for Operational Monitoring)
Codex CLI also supports native OpenTelemetry tracing via its config.toml:
[otel]
exporter = { otlp-http = {
  endpoint = "http://localhost:5000/v1/traces",
  protocol = "binary",
  headers = { "x-mlflow-experiment-id" = "0" }
}}
Codex's native OTLP traces capture internal execution details (websocket connections, request handling, tool scheduling) rather than clean conversation flows. For user-facing conversation traces with prompts, responses, and tool results, the notify hook approach above is recommended.
The OTLP traces can be useful for debugging Codex internals or monitoring performance, and can be used alongside the hook-based traces.
Token Usage and Cost
MLflow automatically tracks token usage for each LLM call within Codex conversations. See the Token Usage and Cost Tracking documentation for details.
Cost is computed based on API pricing. If you are using Codex with a subscription plan rather than per-API-call billing, the computed cost may not reflect your actual spend.
Troubleshooting
Common Issues
Tracing not working:
- Verify the
notify = ["mlflow-codex", "notify-hook"]entry is in~/.codex/config.toml - Confirm
mlflow-codexis on PATH: runwhich mlflow-codex(should resolve afternpm install -g @mlflow/codex) - Confirm
~/.codex/mlflow-tracing.jsonexists and contains a validtrackingUri. Re-runmlflow-codex setupif the file is missing or stale. - Check that Node.js 18+ is being used (required for
fetchsupport) - Check the MLflow tracking server is accessible
Missing traces:
- Traces are created per conversation turn, not per session
- Verify the MLflow tracking server is accessible
Disable Tracing
Remove the notify line from ~/.codex/config.toml. Existing traces are preserved.