Tracing Goose
MLflow Tracing provides automatic tracing capability for Goose, an open-source AI agent by Block that automates engineering tasks on your local machine. MLflow supports tracing for Goose through the OpenTelemetry integration.
:::tip What is Goose? Goose is an open-source, on-device AI agent built by Block. It goes beyond code suggestions — Goose can autonomously write and execute code, manage files, run shell commands, interact with APIs, browse the web, and orchestrate pipelines. It works with any LLM provider and is extensible through MCP (Model Context Protocol) servers. :::
Step 1: Install Goose
Install the Goose CLI using the official installer:
# macOS / Linux
curl -fsSL https://github.com/block/goose/releases/download/stable/download_cli.sh | CONFIGURE=false bash

# Or install via Homebrew
brew install block/tap/goose
For other installation methods, see the Goose documentation.
Step 2: Start the MLflow Tracking Server
Start the MLflow Tracking Server with a SQL-based backend store:
mlflow server --port 5000
This example uses SQLite as the backend store. To use other types of SQL databases such as PostgreSQL, MySQL, and MSSQL, change the store URI as described in the backend store documentation.
:::tip Managed MLflow For a fully managed experience with built-in authentication, scalable storage, and team collaboration, try Managed MLflow for free. :::
Step 3: Set Environment Variables
Goose has a built-in OpenTelemetry exporter that sends traces over OTLP/HTTP. Point it at the MLflow server:
export OTEL_EXPORTER_OTLP_ENDPOINT=http://localhost:5000
export OTEL_EXPORTER_OTLP_HEADERS=x-mlflow-experiment-id=0
:::note About x-mlflow-experiment-id
The x-mlflow-experiment-id header tells MLflow which experiment to associate the traces with. You can use 0 for the default experiment, or specify a custom experiment ID. To create a new experiment and get its ID, run:
mlflow experiments create --experiment-name "goose-traces"
:::
To export only traces (and disable metrics/logs export), you can optionally set:
export OTEL_TRACES_EXPORTER=otlp
export OTEL_METRICS_EXPORTER=none
export OTEL_LOGS_EXPORTER=none
Step 4: Run Goose
With the environment variables set in the same shell session, start Goose:
goose session
Or run a one-off task:
goose run -t "What is 2 + 2?"
Goose will automatically export traces to MLflow. All interactions, including LLM calls, tool executions, and agent decisions, are traced automatically.
Step 5: View Traces in MLflow
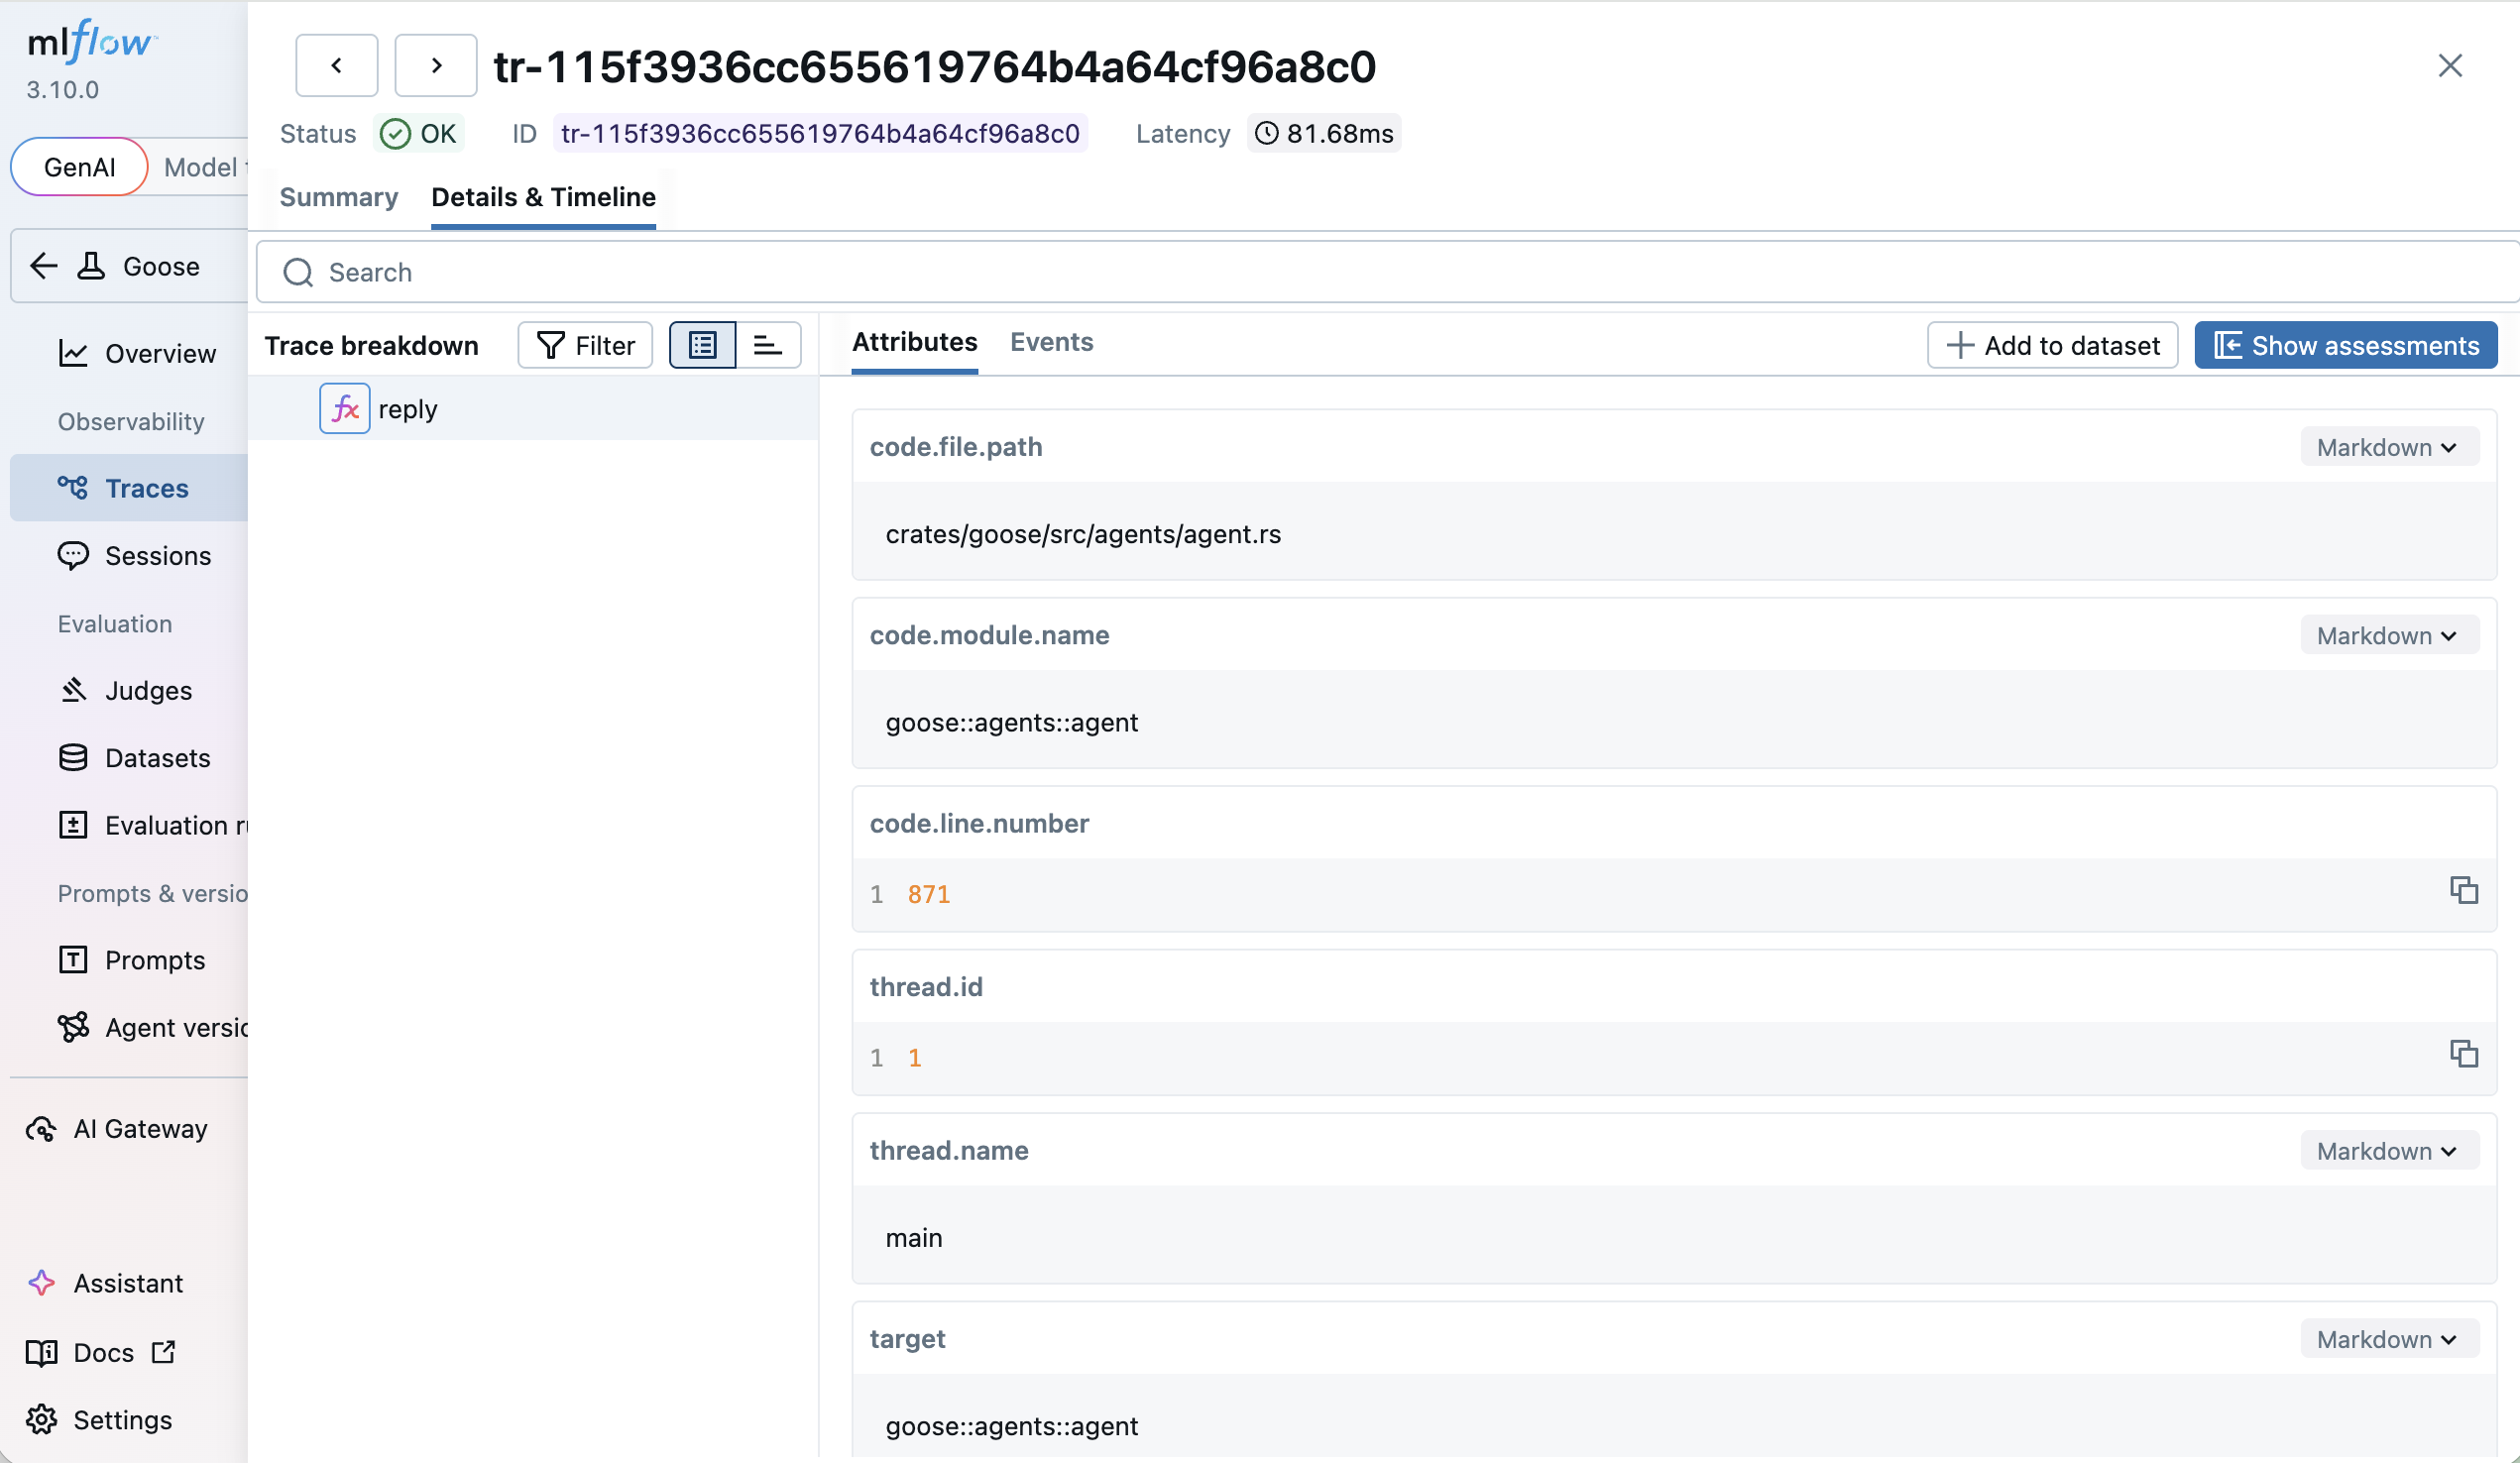
After running a Goose session, open the MLflow UI at http://localhost:5000 and navigate to the Traces tab.
You will see detailed traces showing:
- LLM Requests: Full prompts and completions with token usage
- Tool Executions: Shell commands, file operations, and other tool calls
- Agent Decisions: The agent's reasoning and planning steps
Troubleshooting
Traces Not Appearing in MLflow
- Check backend store: Ensure MLflow is using a SQL backend, not file-based storage. If you see
"POST /v1/traces HTTP/1.1" 501 Not Implementedin the server logs, the server is running with a file-based backend that does not support tracing - Verify endpoint: Confirm the MLflow server is running and accessible at the configured endpoint
- Check OTel is enabled: Run
echo $OTEL_EXPORTER_OTLP_ENDPOINTto verify the environment variable is set in the same shell session where Goose is running - Check OTel is not disabled: Ensure
OTEL_SDK_DISABLEDis not set totrue - Try console export: Set
OTEL_TRACES_EXPORTER=consoleto verify Goose is generating traces