Tracing Hermes Agent
MLflow Tracing can capture end-to-end Hermes Agent execution traces, including LLM calls, tool invocations, and long-running agent sessions, by ingesting OpenTelemetry spans emitted by the hermes-otel plugin.
Once configured, Hermes traces appear in MLflow with:
- An
AGENTroot span for each Hermes turn LLMspans for model callsTOOLspans for terminal and tool execution- Token usage, latency, and session metadata
Setup
Prerequisites
- An MLflow tracking environment. See the Connect Your Environment guide if you need to set one up.
- An MLflow experiment to receive Hermes traces. Take note of its experiment ID.
- Hermes Agent installed
Step 1: Install the Hermes OTLP Plugin
hermes plugins install briancaffey/hermes-otel
Step 2: Point the Plugin at MLflow
Create ~/.hermes/plugins/hermes_otel/config.yaml and point it at the MLflow OTLP endpoint:
enabled: true
force_flush_on_session_end: true
capture_sender_id: true
capture_conversation_history: true

backends:
  - type: otlp
    name: mlflow
    endpoint: http://localhost:5000/v1/traces
    metrics: false
    logs: false
    headers:
      x-mlflow-experiment-id: "<your-experiment-id>"
x-mlflow-experiment-id is required for OTLP ingestion. MLflow uses it to route incoming Hermes spans to the right experiment.
Step 3: (Optional) Point Hermes LLM calls at the MLflow AI Gateway
Update ~/.hermes/config.yaml so Hermes uses the MLflow AI Gateway as the default model provider. With a small change to your configuration, you get centralized model routing for the same Hermes runs, plus:
- Governance — one place to manage which models Hermes can call
- Budgets — spending limits and alerts for long-running Hermes sessions
- Guardrails — PII detection and safety filters applied at the gateway
- Usage logs — per-request inputs, outputs, tokens, and latency
See the Hermes Agent + MLflow AI Gateway guide to set this up.
model:
  default: "gpt-5.5"
  provider: "custom"
  base_url: "http://localhost:5000/gateway/mlflow/v1"
Step 4: Run Hermes Agent
Start an interactive Hermes session and run a tool-calling prompt:
hermes
For example:
> What is the weather in Tokyo?
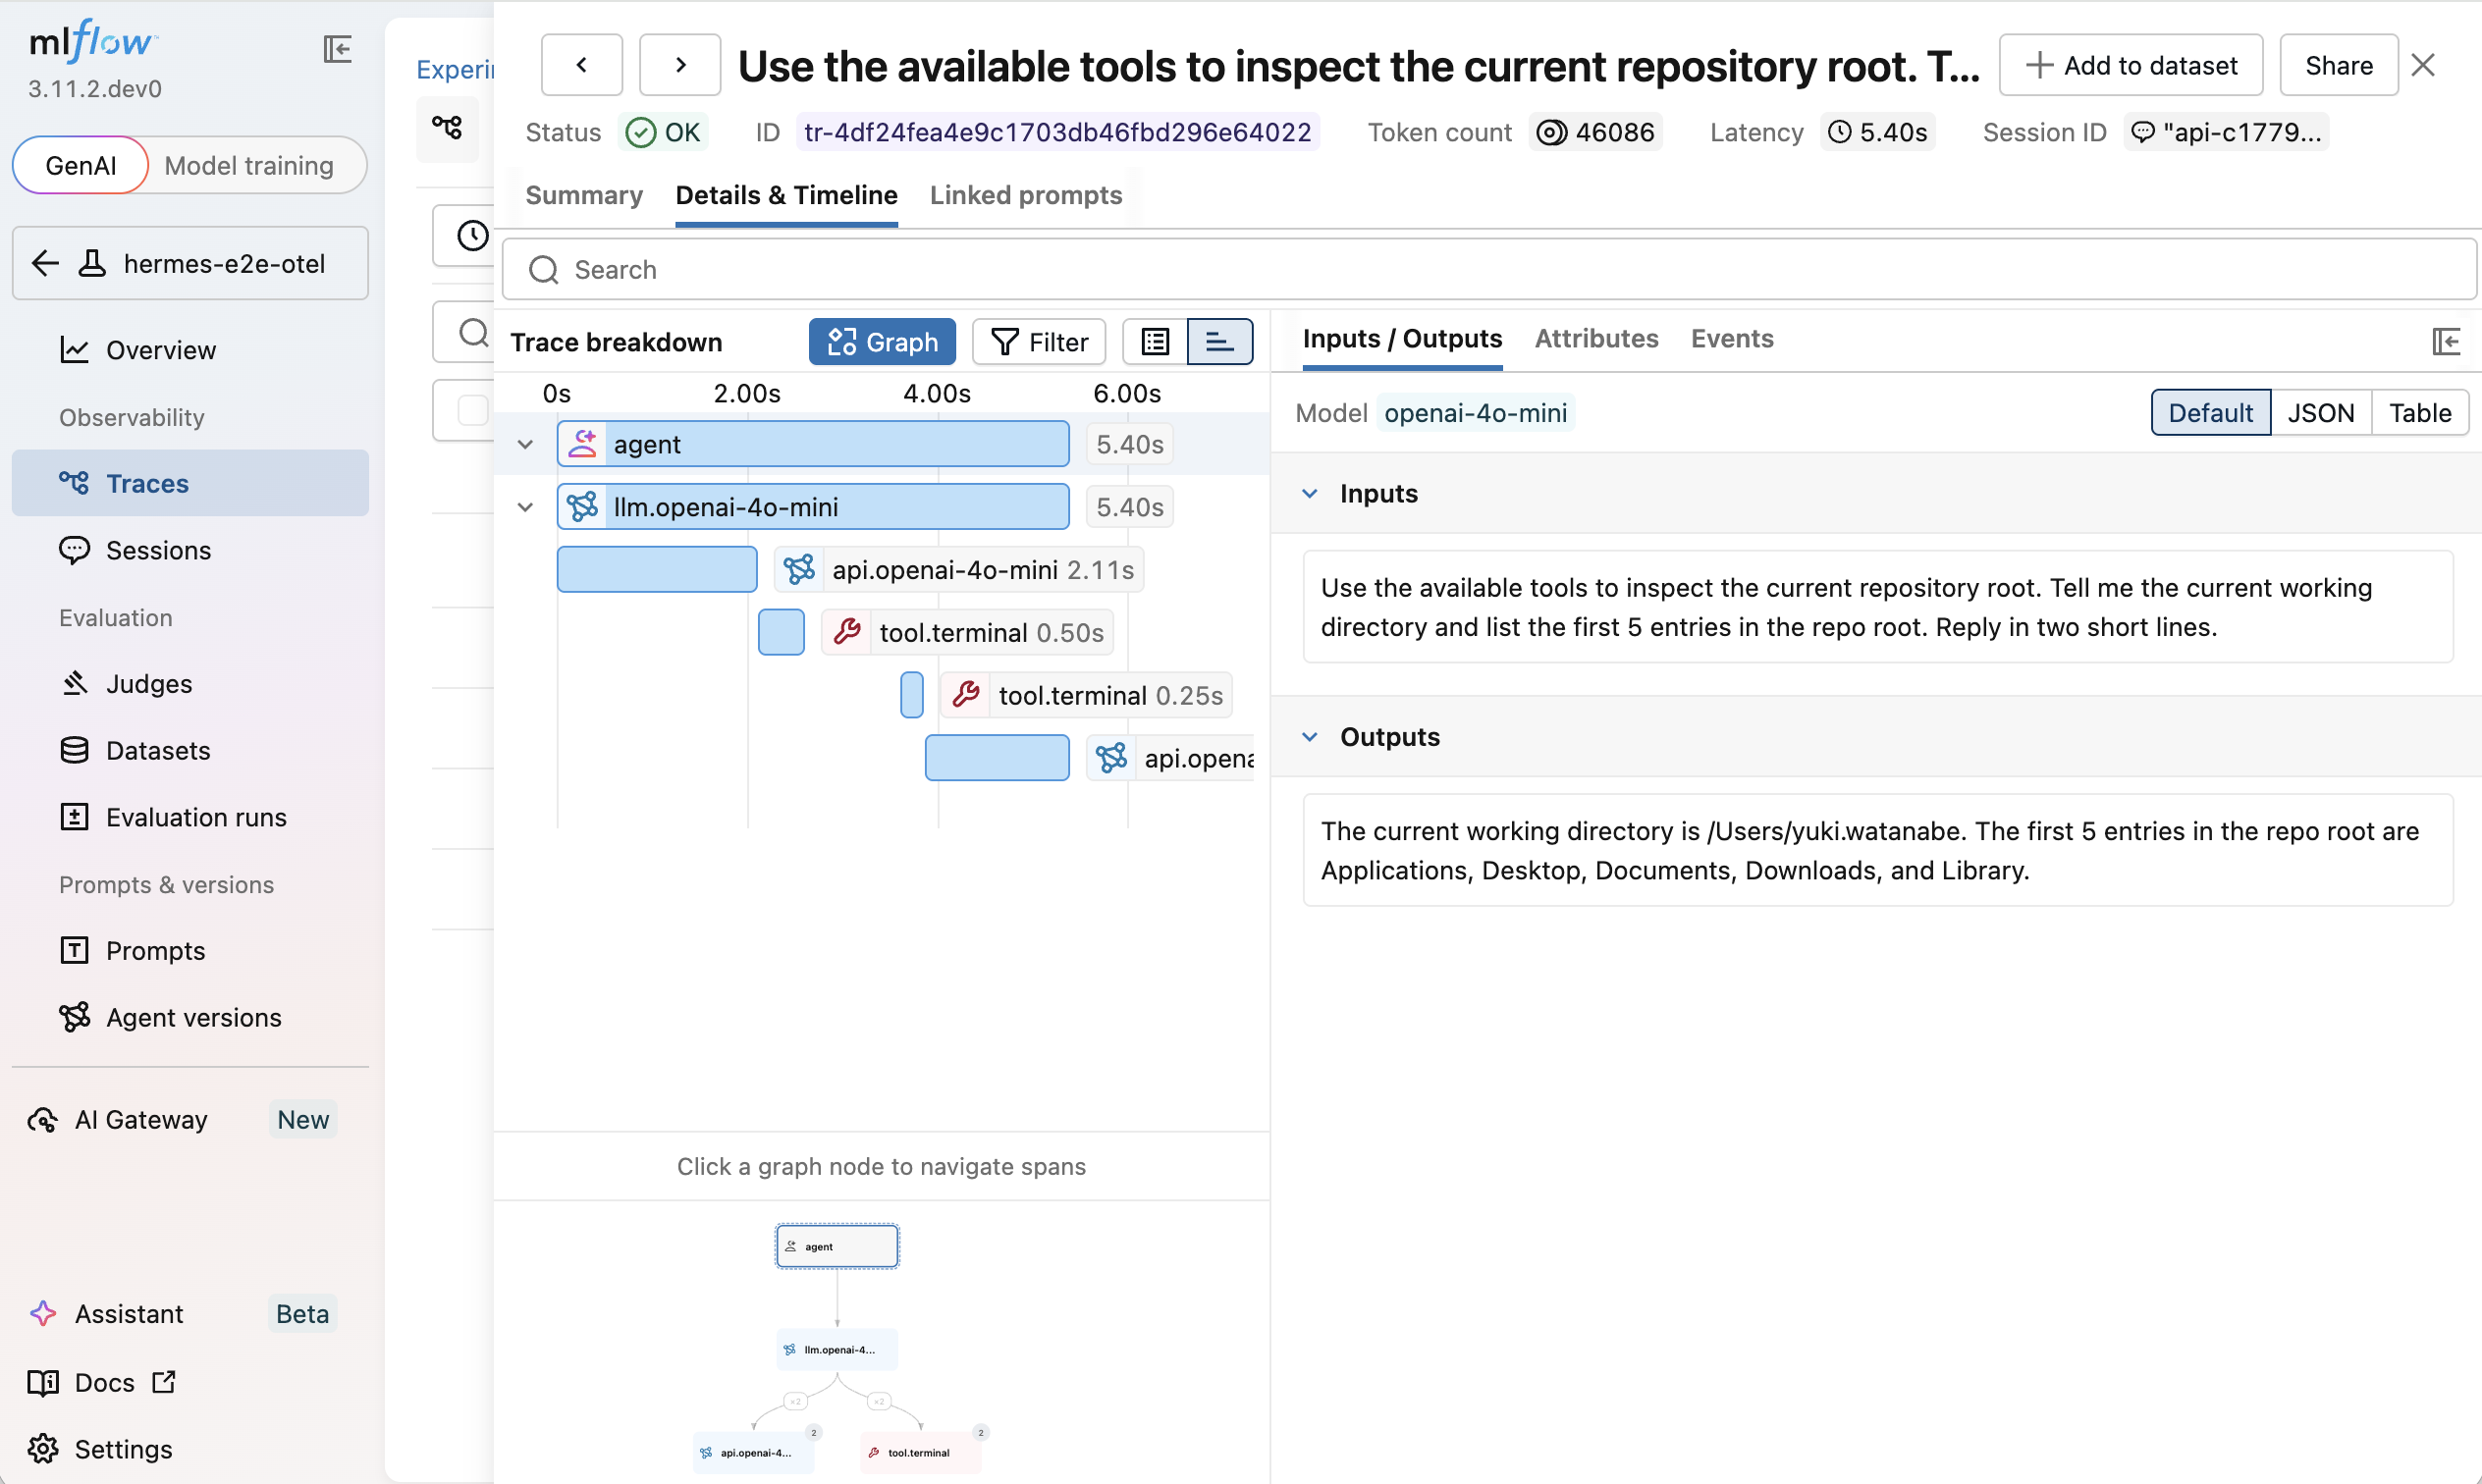
What Gets Traced
Hermes traces show the full agent execution path in MLflow:
AGENT (agent)
├── LLM (llm.<model>)
├── LLM (api.<model>)
├── TOOL (tool.terminal)
├── TOOL (tool.<name>)
└── ...
This makes it possible to see not just the final answer, but also which tools Hermes called, what commands ran, and how long each step took.
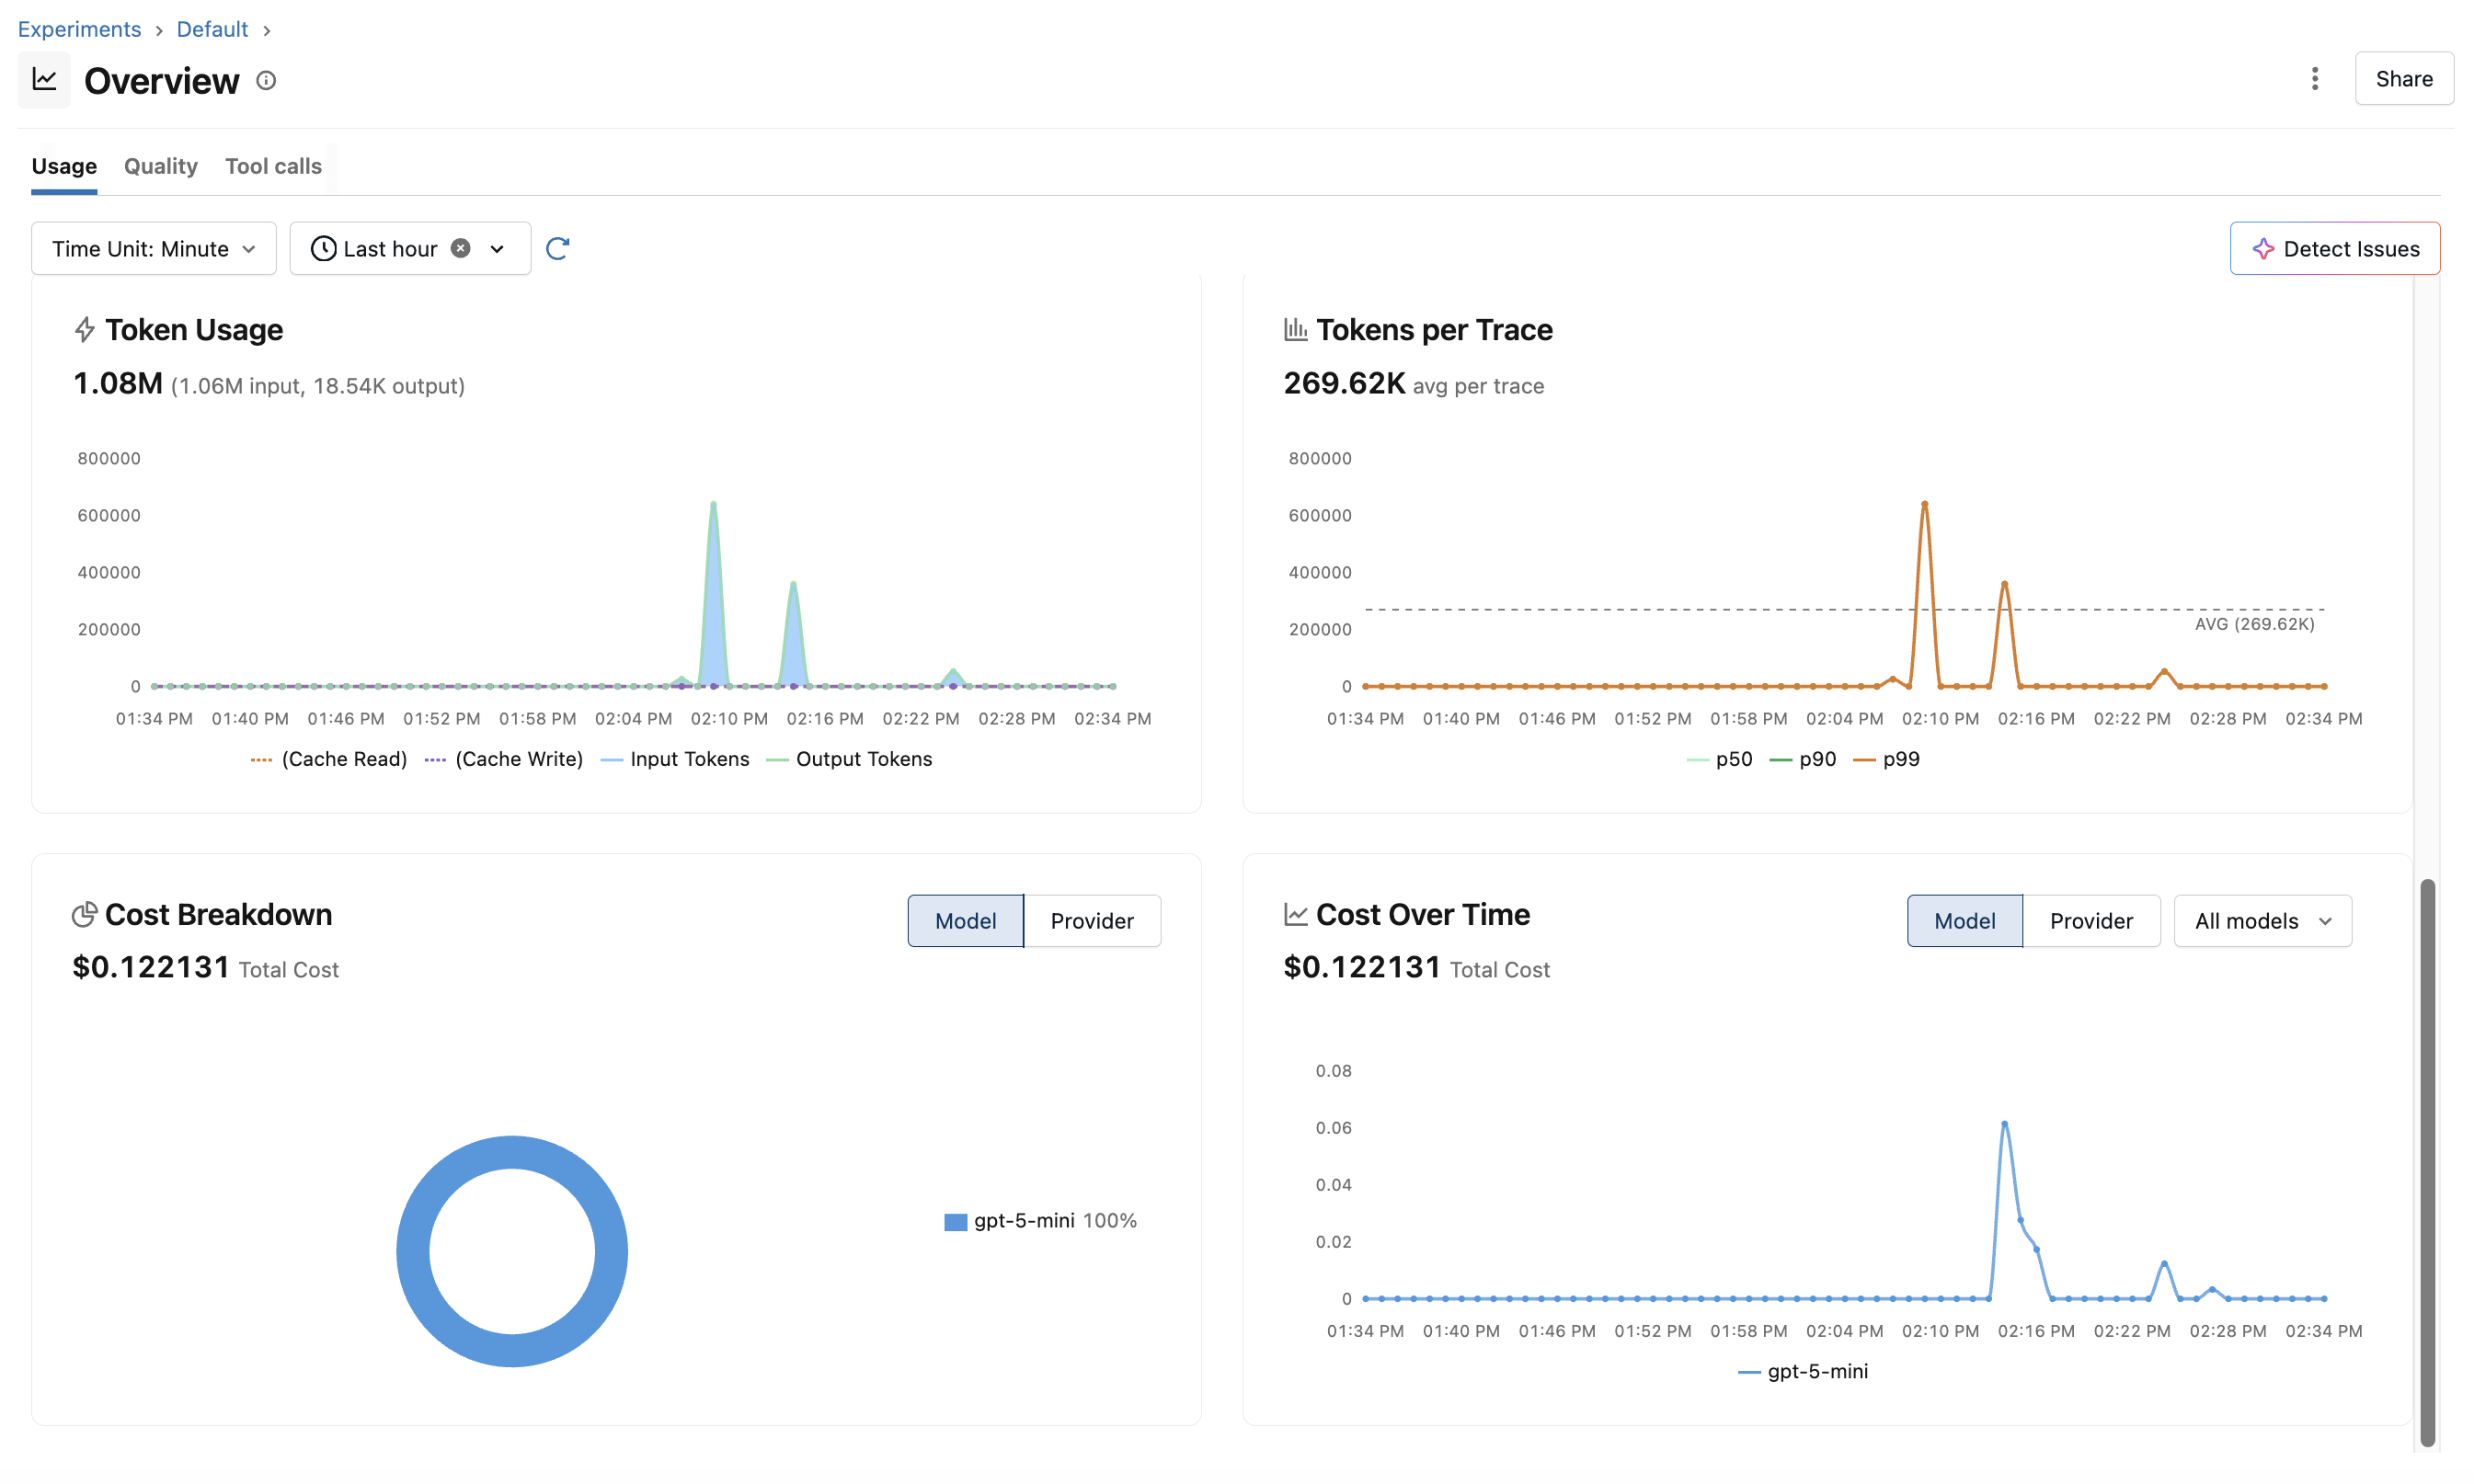
In addition to per-trace detail, MLflow aggregates Hermes traffic into per-experiment dashboards covering token usage, cost, and latency:
Troubleshooting
No traces appear in MLflow
- Verify the MLflow server is reachable at
http://localhost:5000/v1/traces - Verify
x-mlflow-experiment-idpoints to an existing experiment - Restart Hermes after editing
~/.hermes/config.yamlor the plugin config
Hermes runs but tool spans are missing
- Confirm the task actually invoked a tool
- Check that
hermes_otelis enabled underplugins.enabled - Make sure the plugin package is installed into the same environment Hermes runs from
You only see gateway logs, not full agent traces
- Gateway logs capture model requests
- Full Hermes agent traces require
hermes-otelexporting spans directly to MLflow
Acknowledgments
The Hermes Agent tracing integration is made possible by the hermes-otel plugin created by Brian Caffey.