Tracing Koog

Integration via OpenTelemetry
Koog can be integrated with MLflow via OpenTelemetry. Configure Koog's OpenTelemetry exporter to send traces to MLflow's OTLP endpoint.
MLflow Tracing provides automatic tracing capability for Koog, JetBrains' framework for building AI agents in Kotlin. MLflow supports tracing for Koog through the OpenTelemetry integration — Koog's built-in OpenTelemetry feature sends traces directly to MLflow's OTLP endpoint with no additional adapters needed.
Step 1: Start the MLflow Tracking Server
OpenTelemetry trace ingestion is supported in MLflow 3.6.0 and above.
OpenTelemetry endpoint (OTLP)
MLflow Server exposes an OTLP endpoint at /v1/traces (OTLP). This endpoint accepts traces from any native OpenTelemetry instrumentation, allowing you to trace applications written in other languages such as Java, Go, Rust, etc.
To use this endpoint, start MLflow Server with a SQL-based backend store. The following command starts MLflow Server with an SQLite backend store:
mlflow server
To use other types of SQL databases such as PostgreSQL, MySQL, and MSSQL, change the store URI as described in the backend store documentation.
In your application, configure the server endpoint and set the MLflow experiment ID in the OTLP header x-mlflow-experiment-id.
export OTEL_EXPORTER_OTLP_TRACES_ENDPOINT=http://localhost:5000/v1/traces
export OTEL_EXPORTER_OTLP_TRACES_HEADERS=x-mlflow-experiment-id=123
Currently, MLflow Server supports only the OTLP/HTTP endpoint, and the OTLP/gRPC endpoint is not yet supported.
Step 2: Configure the Koog Agent
Install the OpenTelemetry feature in your Koog agent and add an OtlpHttpSpanExporter pointing to the MLflow server's OTLP endpoint. Include the x-mlflow-experiment-id header to associate traces with a specific experiment.
import ai.koog.agents.core.agent.AIAgent
import ai.koog.agents.features.opentelemetry.feature.OpenTelemetry
import ai.koog.prompt.executor.clients.openai.OpenAIModels
import ai.koog.prompt.executor.llms.all.simpleOpenAIExecutor
import io.opentelemetry.exporter.otlp.http.trace.OtlpHttpSpanExporter
import kotlinx.coroutines.runBlocking

fun main() = runBlocking {
    val agent = AIAgent(
        promptExecutor = simpleOpenAIExecutor(System.getenv("OPENAI_API_KEY")),
        llmModel = OpenAIModels.Chat.GPT4oMini,
        systemPrompt = "You are a helpful assistant."
    ) {
        install(OpenTelemetry) {
            addSpanExporter(
                OtlpHttpSpanExporter.builder()
                    .setEndpoint("http://localhost:5000/v1/traces")
                    .addHeader("x-mlflow-experiment-id", "0")
                    .build()
            )
        }
    }

    val result = agent.run("Tell me a joke about programming")
    println("Result: $result")
}
Use "0" for the default experiment, or create a new experiment:
mlflow experiments create --experiment-name "koog-agent-traces"
Step 3: Run and View Traces
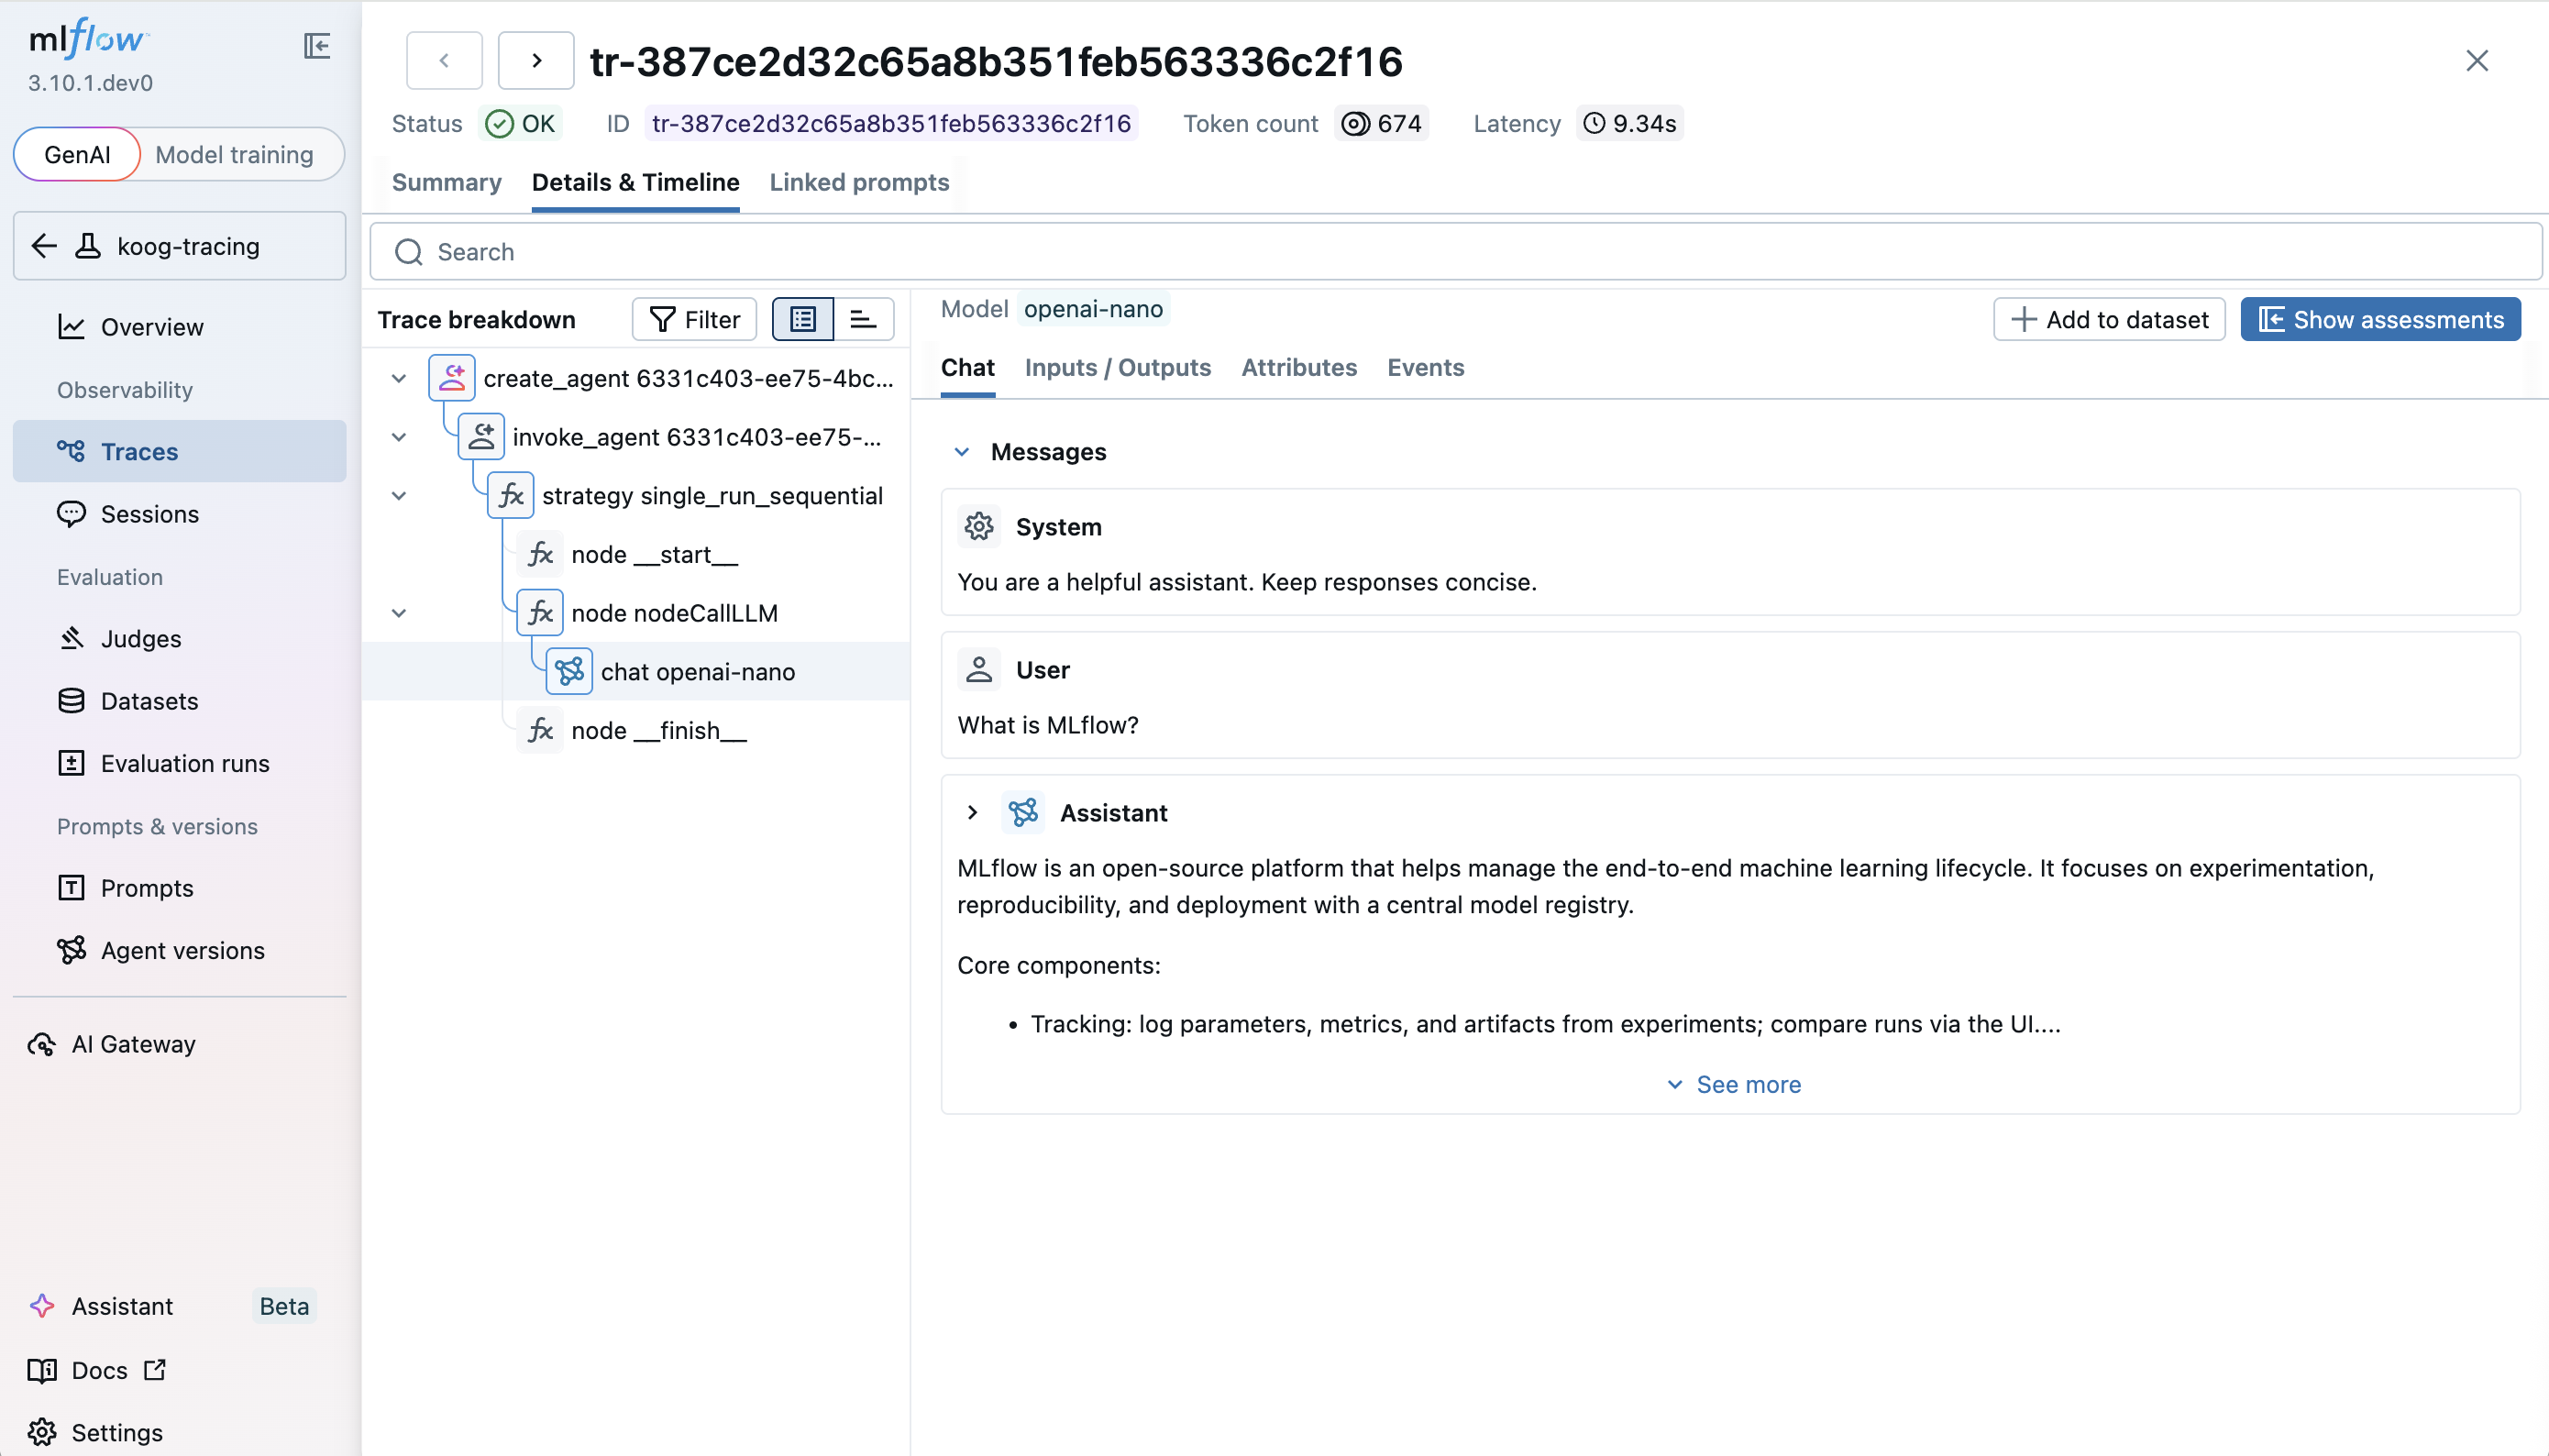
Run your Koog agent, then open the MLflow UI at http://localhost:5000 and navigate to the Traces tab to see detailed execution spans, including agent lifecycle events, LLM calls, and tool executions.
Enable Verbose Tracing
By default, Koog masks span content for security. To include full prompts and responses in MLflow traces, enable verbose mode and optionally set service info:
install(OpenTelemetry) {
    setServiceInfo("koog-agent", "1.0.0")
    setVerbose(true)

    addSpanExporter(
        OtlpHttpSpanExporter.builder()
            .setEndpoint("http://localhost:5000/v1/traces")
            .addHeader("x-mlflow-experiment-id", "0")
            .build()
    )
}
Troubleshooting
No traces appear in MLflow
- Ensure the MLflow server is running and accessible at the configured endpoint.
- Verify that
mlflow serverwas started with a SQL-based backend store (the default SQLite works out of the box). File-based storage does not support OpenTelemetry trace ingestion. - Make sure the
OTEL_SDK_DISABLEDenvironment variable is not set totrue.
Missing span content
- Koog masks span content by default. Set
setVerbose(true)in the OpenTelemetry configuration to include full prompts and responses.
Connection refused errors
- Confirm the MLflow server port matches the endpoint configured in
OtlpHttpSpanExporter. - Check that no firewall rules block the connection to the MLflow server.
Next Steps
- Evaluate the Agent: Learn how to evaluate the agent's performance.
- Collect User Feedback: Learn how to collect user feedback on traces for improving the agent.
- Search Traces: Learn how to search and analyze traces for insights.
Reference
- Collect OpenTelemetry Traces into MLflow — complete reference for sending OpenTelemetry traces to MLflow
- Koog OpenTelemetry Support — background on Koog's OpenTelemetry feature
- Koog MLflow Export Guide — Koog's guide for MLflow integration