Tracing LangGraph🦜🕸️
LangGraph is an open-source library for building stateful, multi-actor applications with LLMs, used to create agent and multi-agent workflows.
MLflow Tracing provides automatic tracing capability for LangGraph, as a extension of its LangChain integration. By enabling auto-tracing for LangChain by calling the mlflow.langchain.autolog() function, MLflow will
automatically capture the graph execution into a trace and log it to the active MLflow Experiment.
In TypeScript, you can pass the MLflow LangChain callback to the callbacks option.
- Python
- JS / TS
import mlflow

mlflow.langchain.autolog()
LangGraph.js tracing is supported via the OpenTelemetry ingestion. See the Getting Started section below for the full setup.
Getting Started
MLflow support tracing for LangGraph in both Python and TypeScript/JavaScript. Please select the appropriate tab below to get started.
- Python
- JS / TS
1. Start MLflow
Start the MLflow server following the Self-Hosting Guide, if you don't have one already.
2. Install dependencies
pip install langgraph langchain-openai mlflow
3. Enable tracing
import mlflow

# Calling autolog for LangChain will enable trace logging.
mlflow.langchain.autolog()

# Optional: Set a tracking URI and an experiment
mlflow.set_experiment("LangChain")
mlflow.set_tracking_uri("http://localhost:5000")
4. Define the LangGraph agent and invoke it
from typing import Literal

import mlflow

from langchain_core.messages import AIMessage, ToolCall
from langchain_core.outputs import ChatGeneration, ChatResult
from langchain_core.tools import tool
from langchain_openai import ChatOpenAI
from langgraph.prebuilt import create_react_agent

# Enabling tracing for LangGraph (LangChain)
mlflow.langchain.autolog()

# Optional: Set a tracking URI and an experiment
mlflow.set_tracking_uri("http://localhost:5000")
mlflow.set_experiment("LangGraph")


@tool
def get_weather(city: Literal["nyc", "sf"]):
    """Use this to get weather information."""
    if city == "nyc":
        return "It might be cloudy in nyc"
    elif city == "sf":
        return "It's always sunny in sf"


llm = ChatOpenAI(model="gpt-4o-mini")
tools = [get_weather]
graph = create_react_agent(llm, tools)

# Invoke the graph
result = graph.invoke({"messages": [{"role": "user", "content": "what is the weather in sf?"}]})
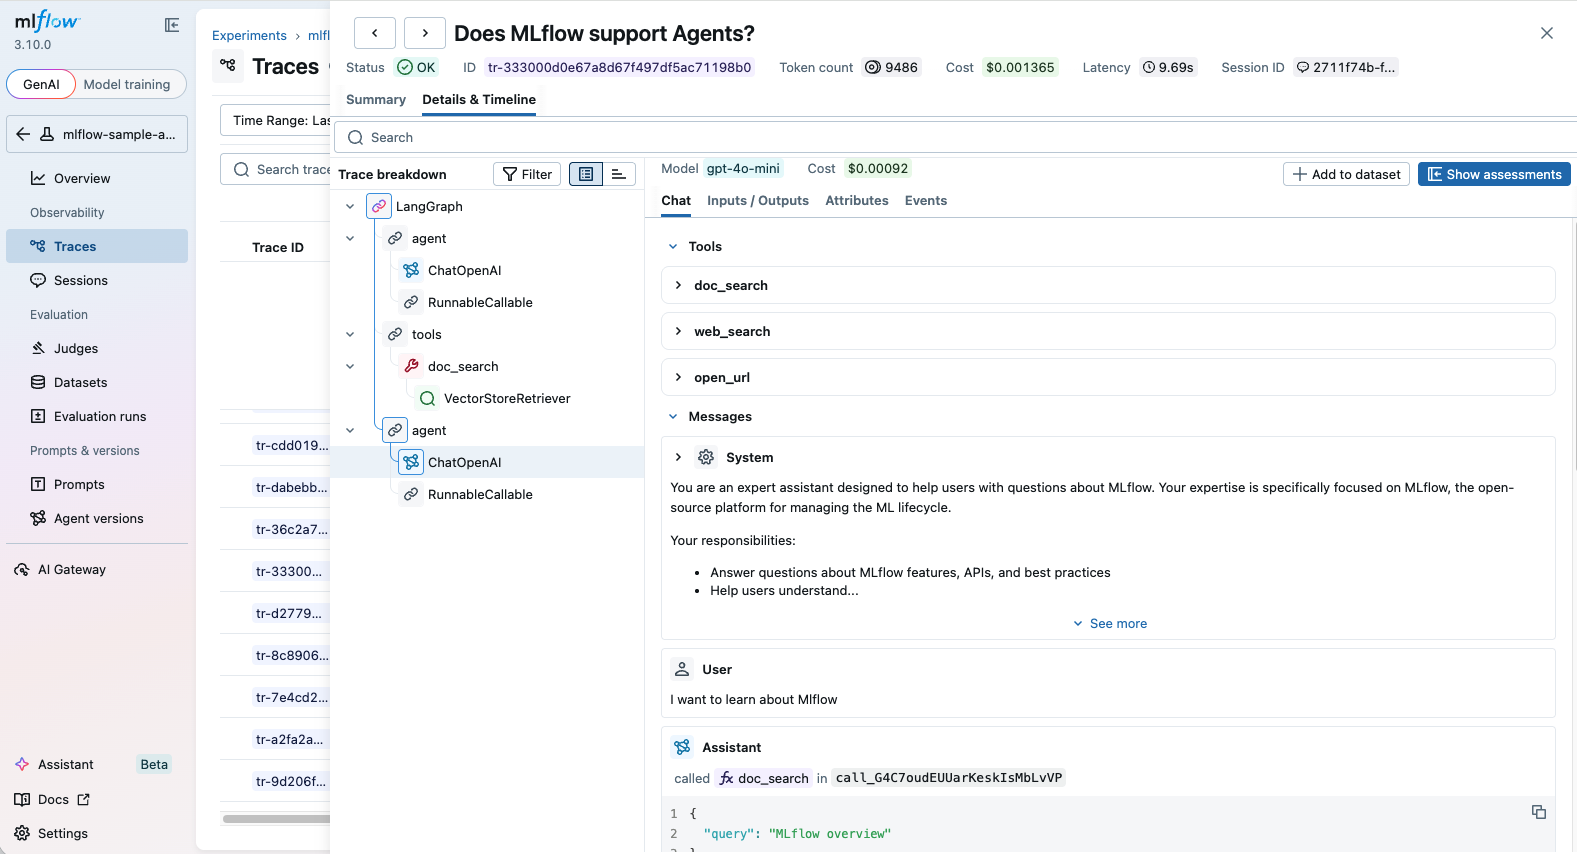
5. View the trace in the MLflow UI
Visit http://localhost:5000 (or your custom MLflow tracking server URL) to view the trace in the MLflow UI.
1. Start MLflow
Start the MLflow server following the Self-Hosting Guide, if you don't have one already.
2. Install the required dependencies:
npm i @langchain/langgraph @langchain/core @langchain/openai @arizeai/openinference-instrumentation-langchain
3. Enable OpenTelemetry
Enable OpenTelemetry instrumentation for LangChain in your application:
import { NodeTracerProvider, SimpleSpanProcessor } from "@opentelemetry/sdk-trace-node";
import { OTLPTraceExporter } from "@opentelemetry/exporter-trace-otlp-proto";
import { LangChainInstrumentation } from "@arizeai/openinference-instrumentation-langchain";
import * as CallbackManagerModule from "@langchain/core/callbacks/manager";

// Set up the OpenTelemetry
const provider = new NodeTracerProvider(
  {
    spanProcessors: [new SimpleSpanProcessor(new OTLPTraceExporter({
      // Set MLflow tracking server URL with `/v1/traces` path. You can also use the OTEL_EXPORTER_OTLP_TRACES_ENDPOINT environment variable instead.
      url: "http://localhost:5000/v1/traces",
      // Set the experiment ID in the header. You can also use the OTEL_EXPORTER_OTLP_TRACES_HEADERS environment variable instead.
      headers: {
        "x-mlflow-experiment-id": "123",
      },
    }))],
  }
);
provider.register();

// Enable LangChain instrumentation
const lcInstrumentation = new LangChainInstrumentation();
lcInstrumentation.manuallyInstrument(CallbackManagerModule);
4. Define the LangGraph agent and invoke it
Define the LangGraph agent following the LangGraph example and invoke it.
5. View the trace in the MLflow UI
Visit http://localhost:5000 (or your custom MLflow tracking server URL) to view the trace in the MLflow UI.
Tracking Token Usage and Cost
MLflow automatically tracks token usage and cost for LangGraph. The token usage for each LLM call will be logged in each Trace/Span and the aggregated cost and time trend are displayed in the built-in dashboard. See the Token Usage and Cost Tracking documentation for details on accessing this information programmatically.
Adding spans within a node or a tool
By combining auto-tracing with the manual tracing APIs, you can add child spans inside a node or tool, to get more detailed insights for the step.
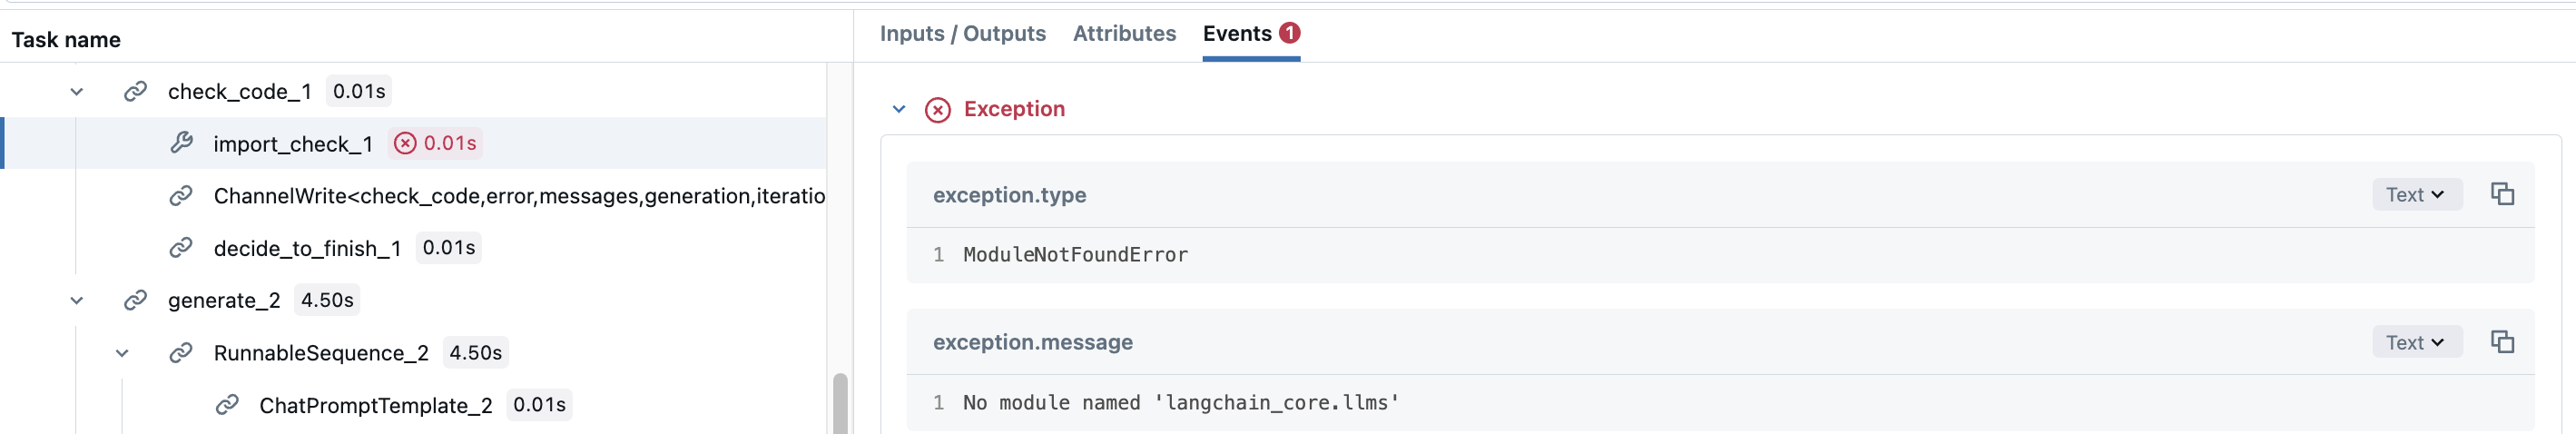
Let's take LangGraph's Code Assistant tutorial for example. The check_code node actually consists of two different validations for the generated code. You may want to add span for each validation to see which validation were executed. To do so, simply create manual spans inside the node function.
def code_check(state: GraphState):
    # State
    messages = state["messages"]
    code_solution = state["generation"]
    iterations = state["iterations"]

    # Get solution components
    imports = code_solution.imports
    code = code_solution.code

    # Check imports
    try:
        # Create a child span manually with mlflow.start_span() API
        with mlflow.start_span(name="import_check", span_type=SpanType.TOOL) as span:
            span.set_inputs(imports)
            exec(imports)
            span.set_outputs("ok")
    except Exception as e:
        error_message = [("user", f"Your solution failed the import test: {e}")]
        messages += error_message
        return {
            "generation": code_solution,
            "messages": messages,
            "iterations": iterations,
            "error": "yes",
        }

    # Check execution
    try:
        code = imports + "\n" + code
        with mlflow.start_span(name="execution_check", span_type=SpanType.TOOL) as span:
            span.set_inputs(code)
            exec(code)
            span.set_outputs("ok")
    except Exception as e:
        error_message = [("user", f"Your solution failed the code execution test: {e}")]
        messages += error_message
        return {
            "generation": code_solution,
            "messages": messages,
            "iterations": iterations,
            "error": "yes",
        }

    # No errors
    return {
        "generation": code_solution,
        "messages": messages,
        "iterations": iterations,
        "error": "no",
    }
This way, the span for the check_code node will have child spans, which record whether the each validation fails or not, with their exception details.
:::info Async Context Propagation
When using async methods like ainvoke() with manual @mlflow.trace decorators inside LangGraph nodes or tools, enable inline tracer execution to ensure proper context propagation:
mlflow.langchain.autolog(run_tracer_inline=True)
This ensures that manually traced spans are properly nested within the autolog trace hierarchy. Without this setting, manual spans may appear as separate traces in async scenarios.
When run_tracer_inline=True is enabled, avoid calling multiple graph invocations sequentially within the same async function, as this may cause traces to merge unexpectedly. If you need to make multiple sequential invocations, either:
- Wrap each invocation in a separate async task
- Use the default
run_tracer_inline=Falseif you don't need manual tracing integration
Thread ID Tracking
Since MLflow 3.6, MLflow will automatically record the thread (session) ID for the trace and let you view a group of traces as a session in the UI. To enable this feature, you need to pass the thread_id in the config when invoking the graph.
graph.invoke(inputs, {"configurable": {"thread_id": "1"}})
The thread ID will be recorded in the trace metadata and displayed in the MLflow Trace UI.

By navigating to the Session tab on the side bar, you can view all the traces in the session.

Combine with the MLflow Tracing SDK (JS / TS)
When using LangGraph.js with OpenTelemetry-based tracing, you can combine the automatically generated traces with the MLflow Tracing SDK (@mlflow/core) to add custom spans, set tags, and update trace metadata within the same trace.
import { init, withSpan } from "@mlflow/core";
import { LangChainInstrumentation } from "@arizeai/openinference-instrumentation-langchain";
import * as CallbackManagerModule from "@langchain/core/callbacks/manager";

// Initialize MLflow SDK - sets up the OTel provider to capture all spans
init({
  trackingUri: "http://localhost:5000",
  experimentId: "<your-experiment-id>",
});

// Enable LangChain instrumentation (also instruments LangGraph)
const lcInstrumentation = new LangChainInstrumentation();
lcInstrumentation.manuallyInstrument(CallbackManagerModule);

// Add custom MLflow spans alongside the auto-generated LangGraph traces
const result = await withSpan(
  { name: "custom_step", inputs: { query: "test" } },
  async (span) => {
    // your LangGraph application logic here
    return { result: "success" };
  }
);
For detailed instructions and examples, see Combining the OpenTelemetry SDK and the MLflow Tracing SDK.
Disable auto-tracing
Auto tracing for LangGraph can be disabled globally by calling mlflow.langchain.autolog(disable=True) or mlflow.autolog(disable=True).