Tracing LiteLLM Proxy
LiteLLM Proxy is a self-hosted LLM gateway that provides a unified OpenAI-compatible API to access 100+ LLM providers. It offers features like load balancing, spend tracking, and rate limiting across multiple providers.
This guide covers the LiteLLM Proxy Server. If you're using the LiteLLM Python SDK directly in your application, see the LiteLLM SDK Integration guide instead.
Integration Options
There are two ways to trace LLM calls through LiteLLM Proxy with MLflow:
| Approach | Description | Best For |
|---|---|---|
| Server-side Callback | Configure MLflow as a callback in LiteLLM Proxy config | Centralized tracing for all requests through the proxy |
| Client-side Tracing | Use OpenAI SDK with MLflow autolog | Combining LLM traces with your agent or application traces (how to →) |
With server-side tracing, all requests through the proxy are captured in a single MLflow experiment, regardless of which client or application made them. For application-specific tracing, consider using client-side tracing where each application manages its own traces.
Option 1: Server-side Callback (Recommended)
This approach configures LiteLLM Proxy to send traces directly to MLflow, capturing all LLM calls across all clients using the proxy.
Install LiteLLM with MLflow Support
pip install 'litellm[mlflow]'
Start MLflow Server
- Local (pip)
- Local (docker)
If you have a local Python environment >= 3.10, you can start the MLflow server locally using the mlflow CLI command.
mlflow server
MLflow also provides a Docker Compose file to start a local MLflow server with a postgres database and a minio server.
git clone --depth 1 --filter=blob:none --sparse https://github.com/mlflow/mlflow.git
cd mlflow
git sparse-checkout set docker-compose
cd docker-compose
cp .env.dev.example .env
docker compose up -d
Refer to the instruction for more details, e.g., overriding the default environment variables.
Configure LiteLLM Proxy
Add MLflow as a callback in your LiteLLM Proxy configuration file:
model_list:
  - model_name: gpt-4o-mini
    litellm_params:
      model: openai/gpt-4o-mini
      api_key: os.environ/OPENAI_API_KEY

litellm_settings:
  success_callback: ["mlflow"]
  failure_callback: ["mlflow"]
Set Environment Variables
Configure the MLflow tracking URI before starting the proxy:
# Required: Point to your MLflow server
export MLFLOW_TRACKING_URI="http://localhost:5000"

# Optional: Set the experiment name
export MLFLOW_EXPERIMENT_NAME="LiteLLM Proxy"
Start LiteLLM Proxy
litellm --config litellm_config.yaml
Make API Calls
Make requests to the proxy using any OpenAI-compatible client:
curl -X POST "http://localhost:4000/v1/chat/completions" \
  -H "Content-Type: application/json" \
  -H "Authorization: Bearer sk-1234" \
  -d '{
    "model": "gpt-4o-mini",
    "messages": [
      {"role": "user", "content": "Hello, how are you?"}
    ]
  }'
Or use the OpenAI Python SDK:
from openai import OpenAI

# Point to your LiteLLM Proxy
client = OpenAI(
    base_url="http://localhost:4000/v1",
    api_key="sk-1234",  # Your LiteLLM Proxy API key
)

response = client.chat.completions.create(
    model="gpt-4o-mini", messages=[{"role": "user", "content": "Hello, how are you?"}]
)
print(response.choices[0].message.content)
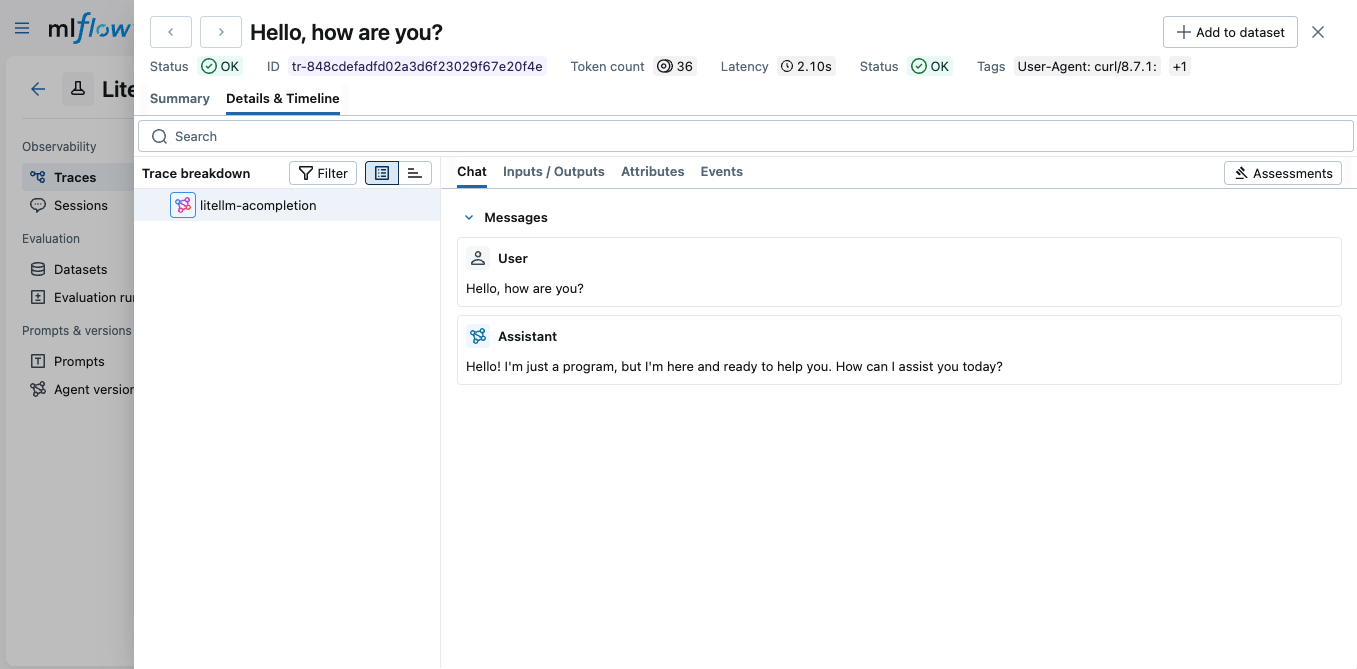
View Traces in MLflow UI
Open the MLflow UI at http://localhost:5000 to see the traces from your LiteLLM Proxy calls.
Option 2: Client-side Tracing
If you don't have access to configure the LiteLLM Proxy server, you can trace calls on the client side using the OpenAI SDK with MLflow autolog. Since LiteLLM Proxy exposes an OpenAI-compatible API, this works seamlessly.
Install Dependencies
- Python
- TypeScript
pip install 'mlflow[genai]' openai
npm install @mlflow/openai openai
Start MLflow Server
- Local (pip)
- Local (docker)
If you have a local Python environment >= 3.10, you can start the MLflow server locally using the mlflow CLI command.
mlflow server
MLflow also provides a Docker Compose file to start a local MLflow server with a postgres database and a minio server.
git clone --depth 1 --filter=blob:none --sparse https://github.com/mlflow/mlflow.git
cd mlflow
git sparse-checkout set docker-compose
cd docker-compose
cp .env.dev.example .env
docker compose up -d
Refer to the instruction for more details, e.g., overriding the default environment variables.
Enable Tracing and Make API Calls
- Python
- TypeScript
Enable tracing with mlflow.openai.autolog() and configure the OpenAI client to use LiteLLM Proxy's base URL.
import mlflow
from openai import OpenAI

# Enable auto-tracing for OpenAI
mlflow.openai.autolog()

# Set tracking URI and experiment
mlflow.set_tracking_uri("http://localhost:5000")
mlflow.set_experiment("LiteLLM Proxy")

# Point OpenAI client to LiteLLM Proxy
client = OpenAI(
    base_url="http://localhost:4000/v1",  # LiteLLM Proxy URL
    api_key="sk-1234",  # Your LiteLLM Proxy API key
)

# Make API calls as usual - traces will be captured automatically
response = client.chat.completions.create(
    model="gpt-4o-mini",
    messages=[
        {"role": "system", "content": "You are a helpful assistant."},
        {"role": "user", "content": "What is the capital of France?"},
    ],
)
print(response.choices[0].message.content)
Initialize MLflow tracing with init() and wrap the OpenAI client with the tracedOpenAI function.
import { init } from "@mlflow/core";
import { tracedOpenAI } from "@mlflow/openai";
import { OpenAI } from "openai";

// Initialize MLflow tracing
init({
  trackingUri: "http://localhost:5000",
  experimentId: "<experiment-id>",
});

// Wrap the OpenAI client pointing to LiteLLM Proxy
const client = tracedOpenAI(
  new OpenAI({
    baseURL: "http://localhost:4000/v1", // LiteLLM Proxy URL
    apiKey: "sk-1234", // Your LiteLLM Proxy API key
  })
);

// Make API calls - traces will be captured automatically
const response = await client.chat.completions.create({
  model: "gpt-4o-mini",
  messages: [
    { role: "system", content: "You are a helpful assistant." },
    { role: "user", content: "What is the capital of France?" },
  ],
});
console.log(response.choices[0].message.content);
View Traces in MLflow UI
Open the MLflow UI at http://localhost:5000 to see the traces.
With client-side tracing, you see traces from your application's perspective. Server-side callback tracing provides a complete view of all proxy activity including requests from other clients.
Combining with Manual Tracing
You can combine auto-tracing with MLflow's manual tracing to create comprehensive traces that include your application logic:
- Python
- TypeScript
import mlflow
from mlflow.entities import SpanType
from openai import OpenAI

mlflow.openai.autolog()

client = OpenAI(base_url="http://localhost:4000/v1", api_key="sk-1234")


@mlflow.trace(span_type=SpanType.CHAIN)
def ask_question(question: str) -> str:
    """A traced function that calls the LLM through LiteLLM Proxy."""
    response = client.chat.completions.create(
        model="gpt-5", messages=[{"role": "user", "content": question}]
    )
    return response.choices[0].message.content


# The entire function call and nested LLM call will be traced
answer = ask_question("What is machine learning?")
print(answer)
import { init, trace, SpanType } from "@mlflow/core";
import { tracedOpenAI } from "@mlflow/openai";
import { OpenAI } from "openai";

init({
  trackingUri: "http://localhost:5000",
  experimentId: "<experiment-id>",
});

const client = tracedOpenAI(
  new OpenAI({
    baseURL: "http://localhost:4000/v1",
    apiKey: "sk-1234",
  })
);

// Wrap your function with trace() to create a span
const askQuestion = trace(
  { name: "askQuestion", spanType: SpanType.CHAIN },
  async (question: string): Promise<string> => {
    const response = await client.chat.completions.create({
      model: "gpt-5",
      messages: [{ role: "user", content: question }],
    });
    return response.choices[0].message.content ?? "";
  }
);

// The entire function call and nested LLM call will be traced
const answer = await askQuestion("What is machine learning?");
console.log(answer);
Next Steps
Track User Feedback
Record user feedback on traces for tracking user satisfaction.
Manage Prompts
Learn how to manage prompts with MLflow's prompt registry.
Evaluate Traces
Evaluate traces with LLM judges to understand and improve your AI application's behavior.