Tracing Omnigent
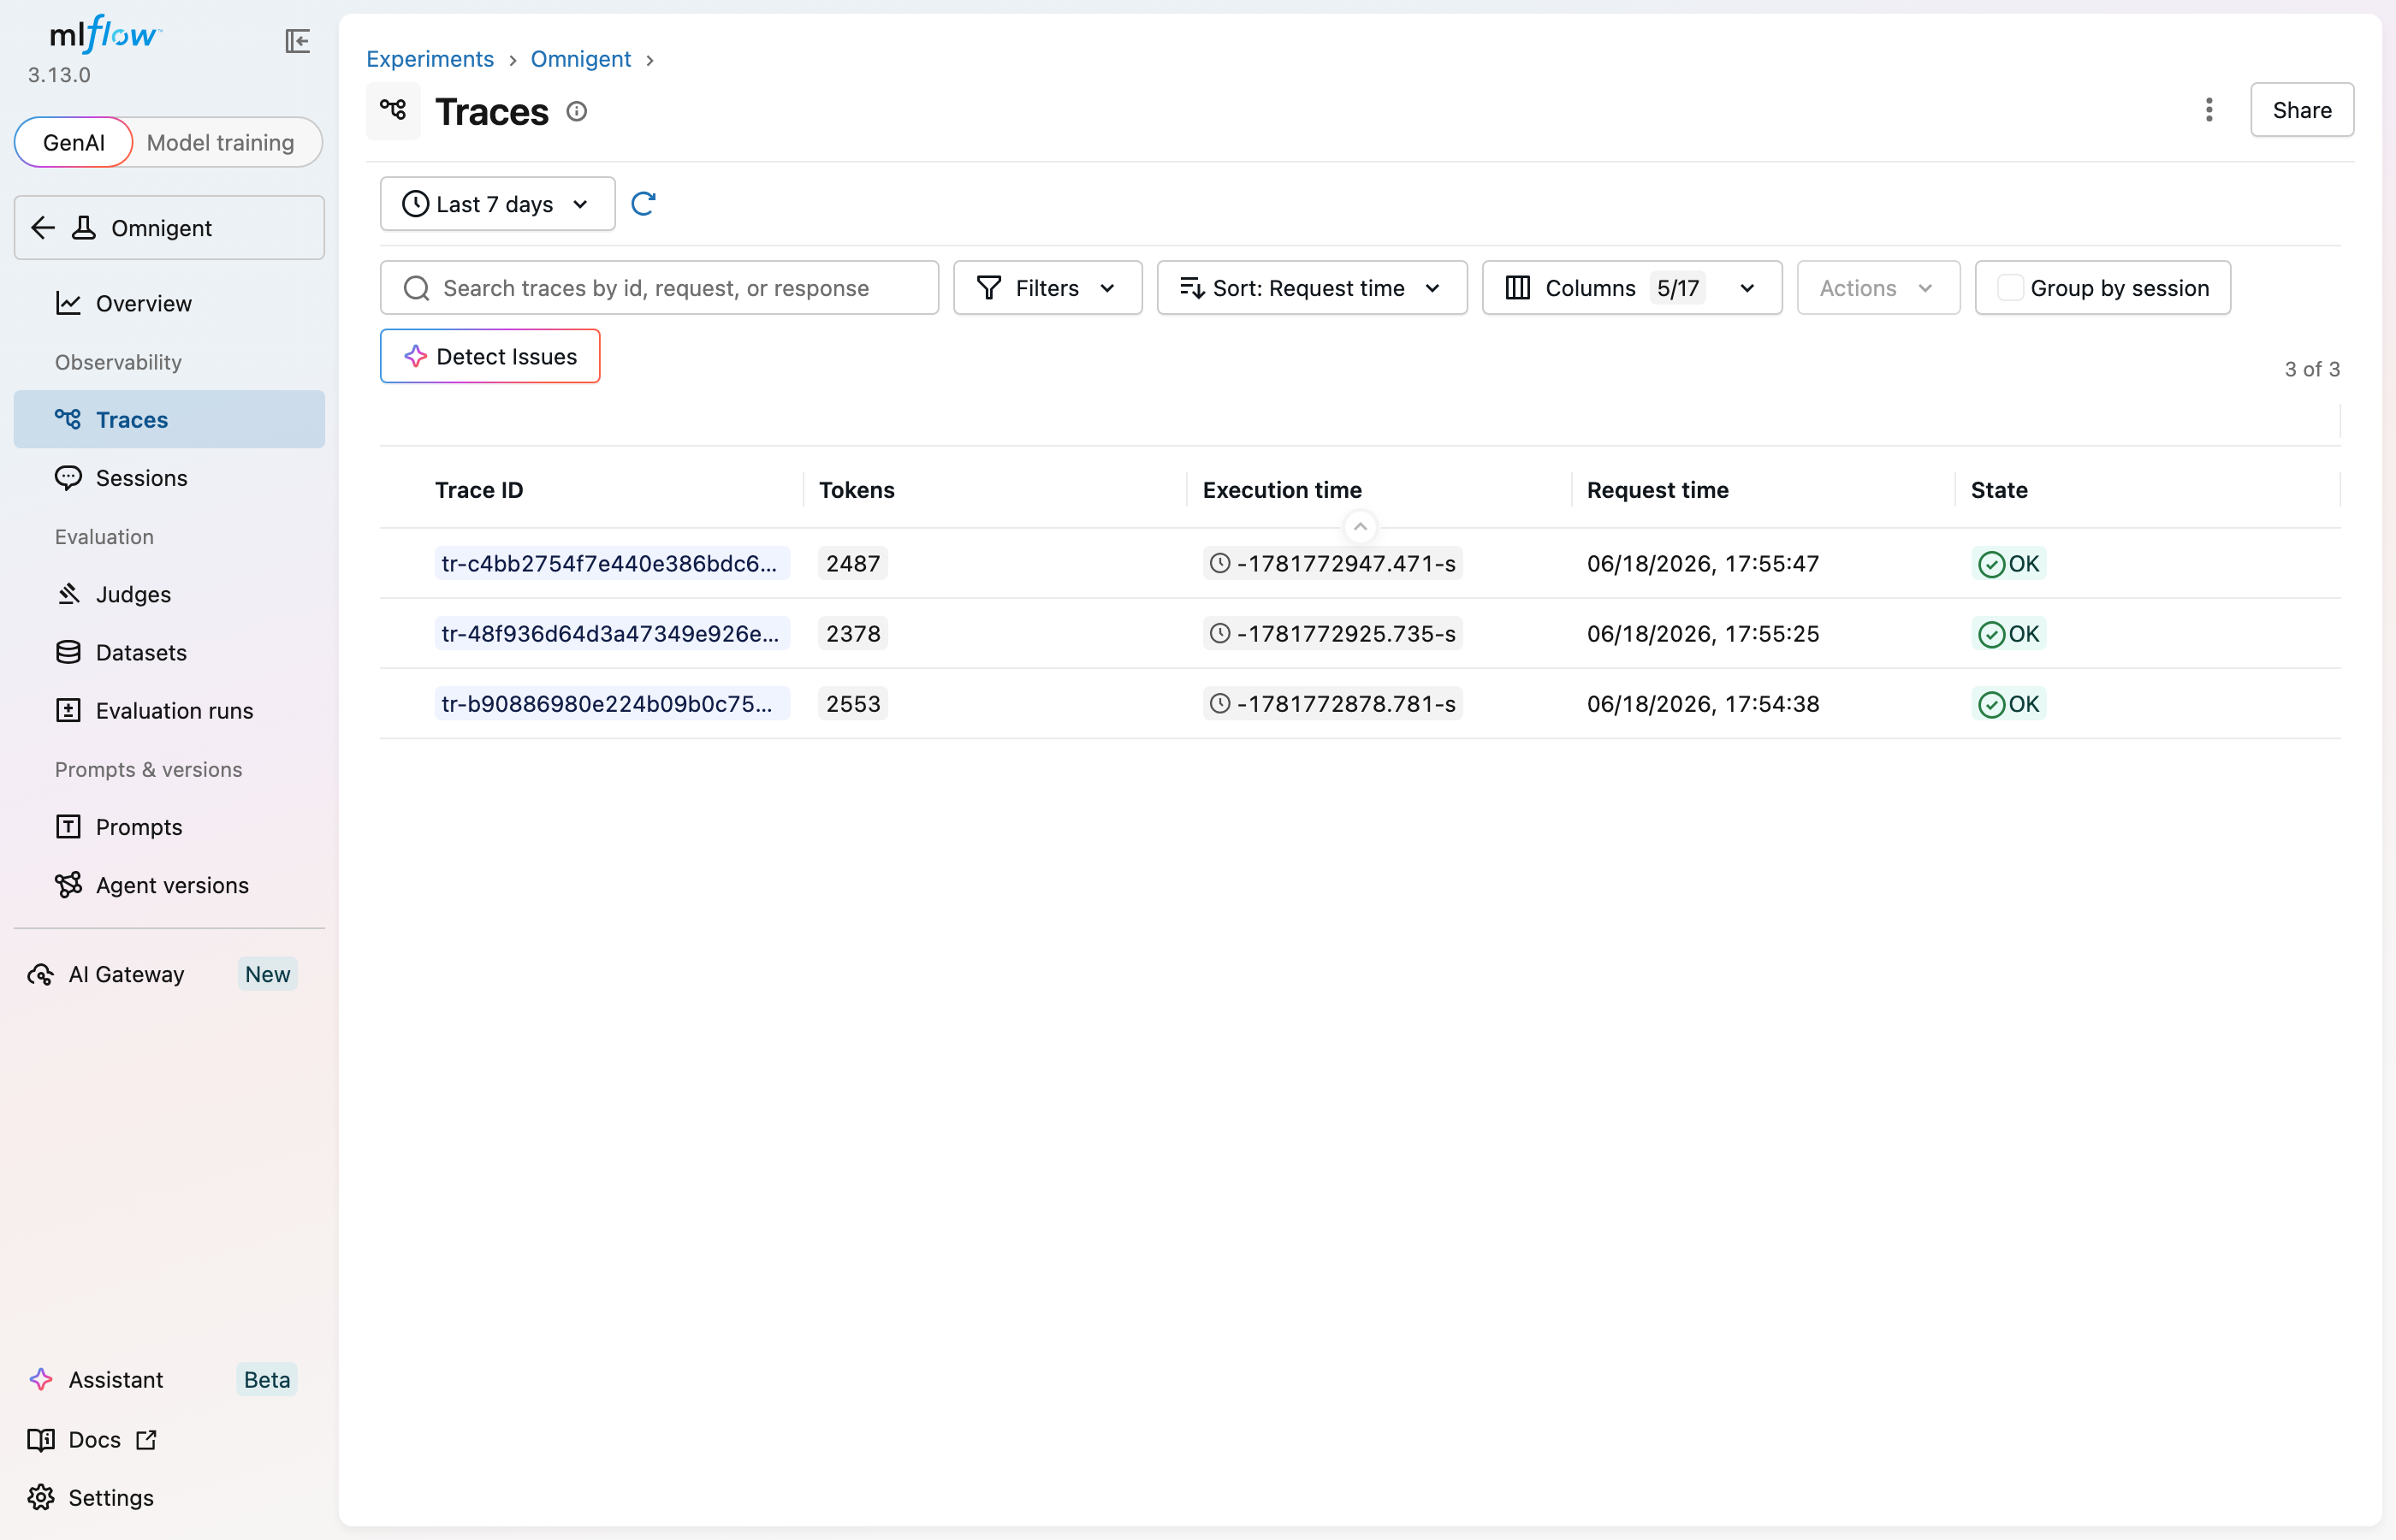
MLflow Tracing provides automatic tracing for Omnigent, a multi-harness AI agent orchestration platform. Omnigent natively emits OpenTelemetry traces via MLflow's tracing SDK, so after setup MLflow will automatically capture traces of your Omnigent agent sessions including:
- Agent turns with user prompts and assistant responses
- Tool invocations with arguments, results, and duration
- Per-turn token usage (input, output, cache read/write)
- Session metadata (response ID, model, agent name)
Omnigent is an agent orchestration platform that supports multiple execution harnesses (Claude Agent SDK, OpenAI Agents, Codex, Databricks, and more) behind a unified API. It provides policy enforcement, credential management, and observability across all harness types.
Setup
Omnigent ships MLflow as an optional dependency. Install the tracing extra and configure your export target.
Install the Tracing Extra
pip install 'omnigent[tracing]'
This installs mlflow and opentelemetry SDK packages. If the tracing extra is not installed, Omnigent degrades gracefully to a no-op — the server continues to run without emitting traces.
Start the MLflow Tracking Server
Start an MLflow server to receive and display traces:
mlflow server --port 5000
Or use Docker Compose:
docker compose up -d
Configure Environment Variables
- OTLP Export (Recommended)
- MLflow Tracking Server
Point Omnigent at any OTLP-compatible collector (MLflow tracking server, Jaeger, Grafana Tempo, etc.):
export OTEL_EXPORTER_OTLP_ENDPOINT="http://localhost:5000"
export OTEL_EXPORTER_OTLP_PROTOCOL="http/protobuf"  # or "grpc" (default)
Alternatively, point directly at an MLflow tracking server:
export MLFLOW_TRACKING_URI="http://localhost:5000"
Omnigent's telemetry.init() runs automatically at server startup and configures MLflow based on these environment variables. No code changes are needed.
Start Omnigent
Start Omnigent as usual. Traces are emitted automatically for every agent session.
omnigent run
How It Works
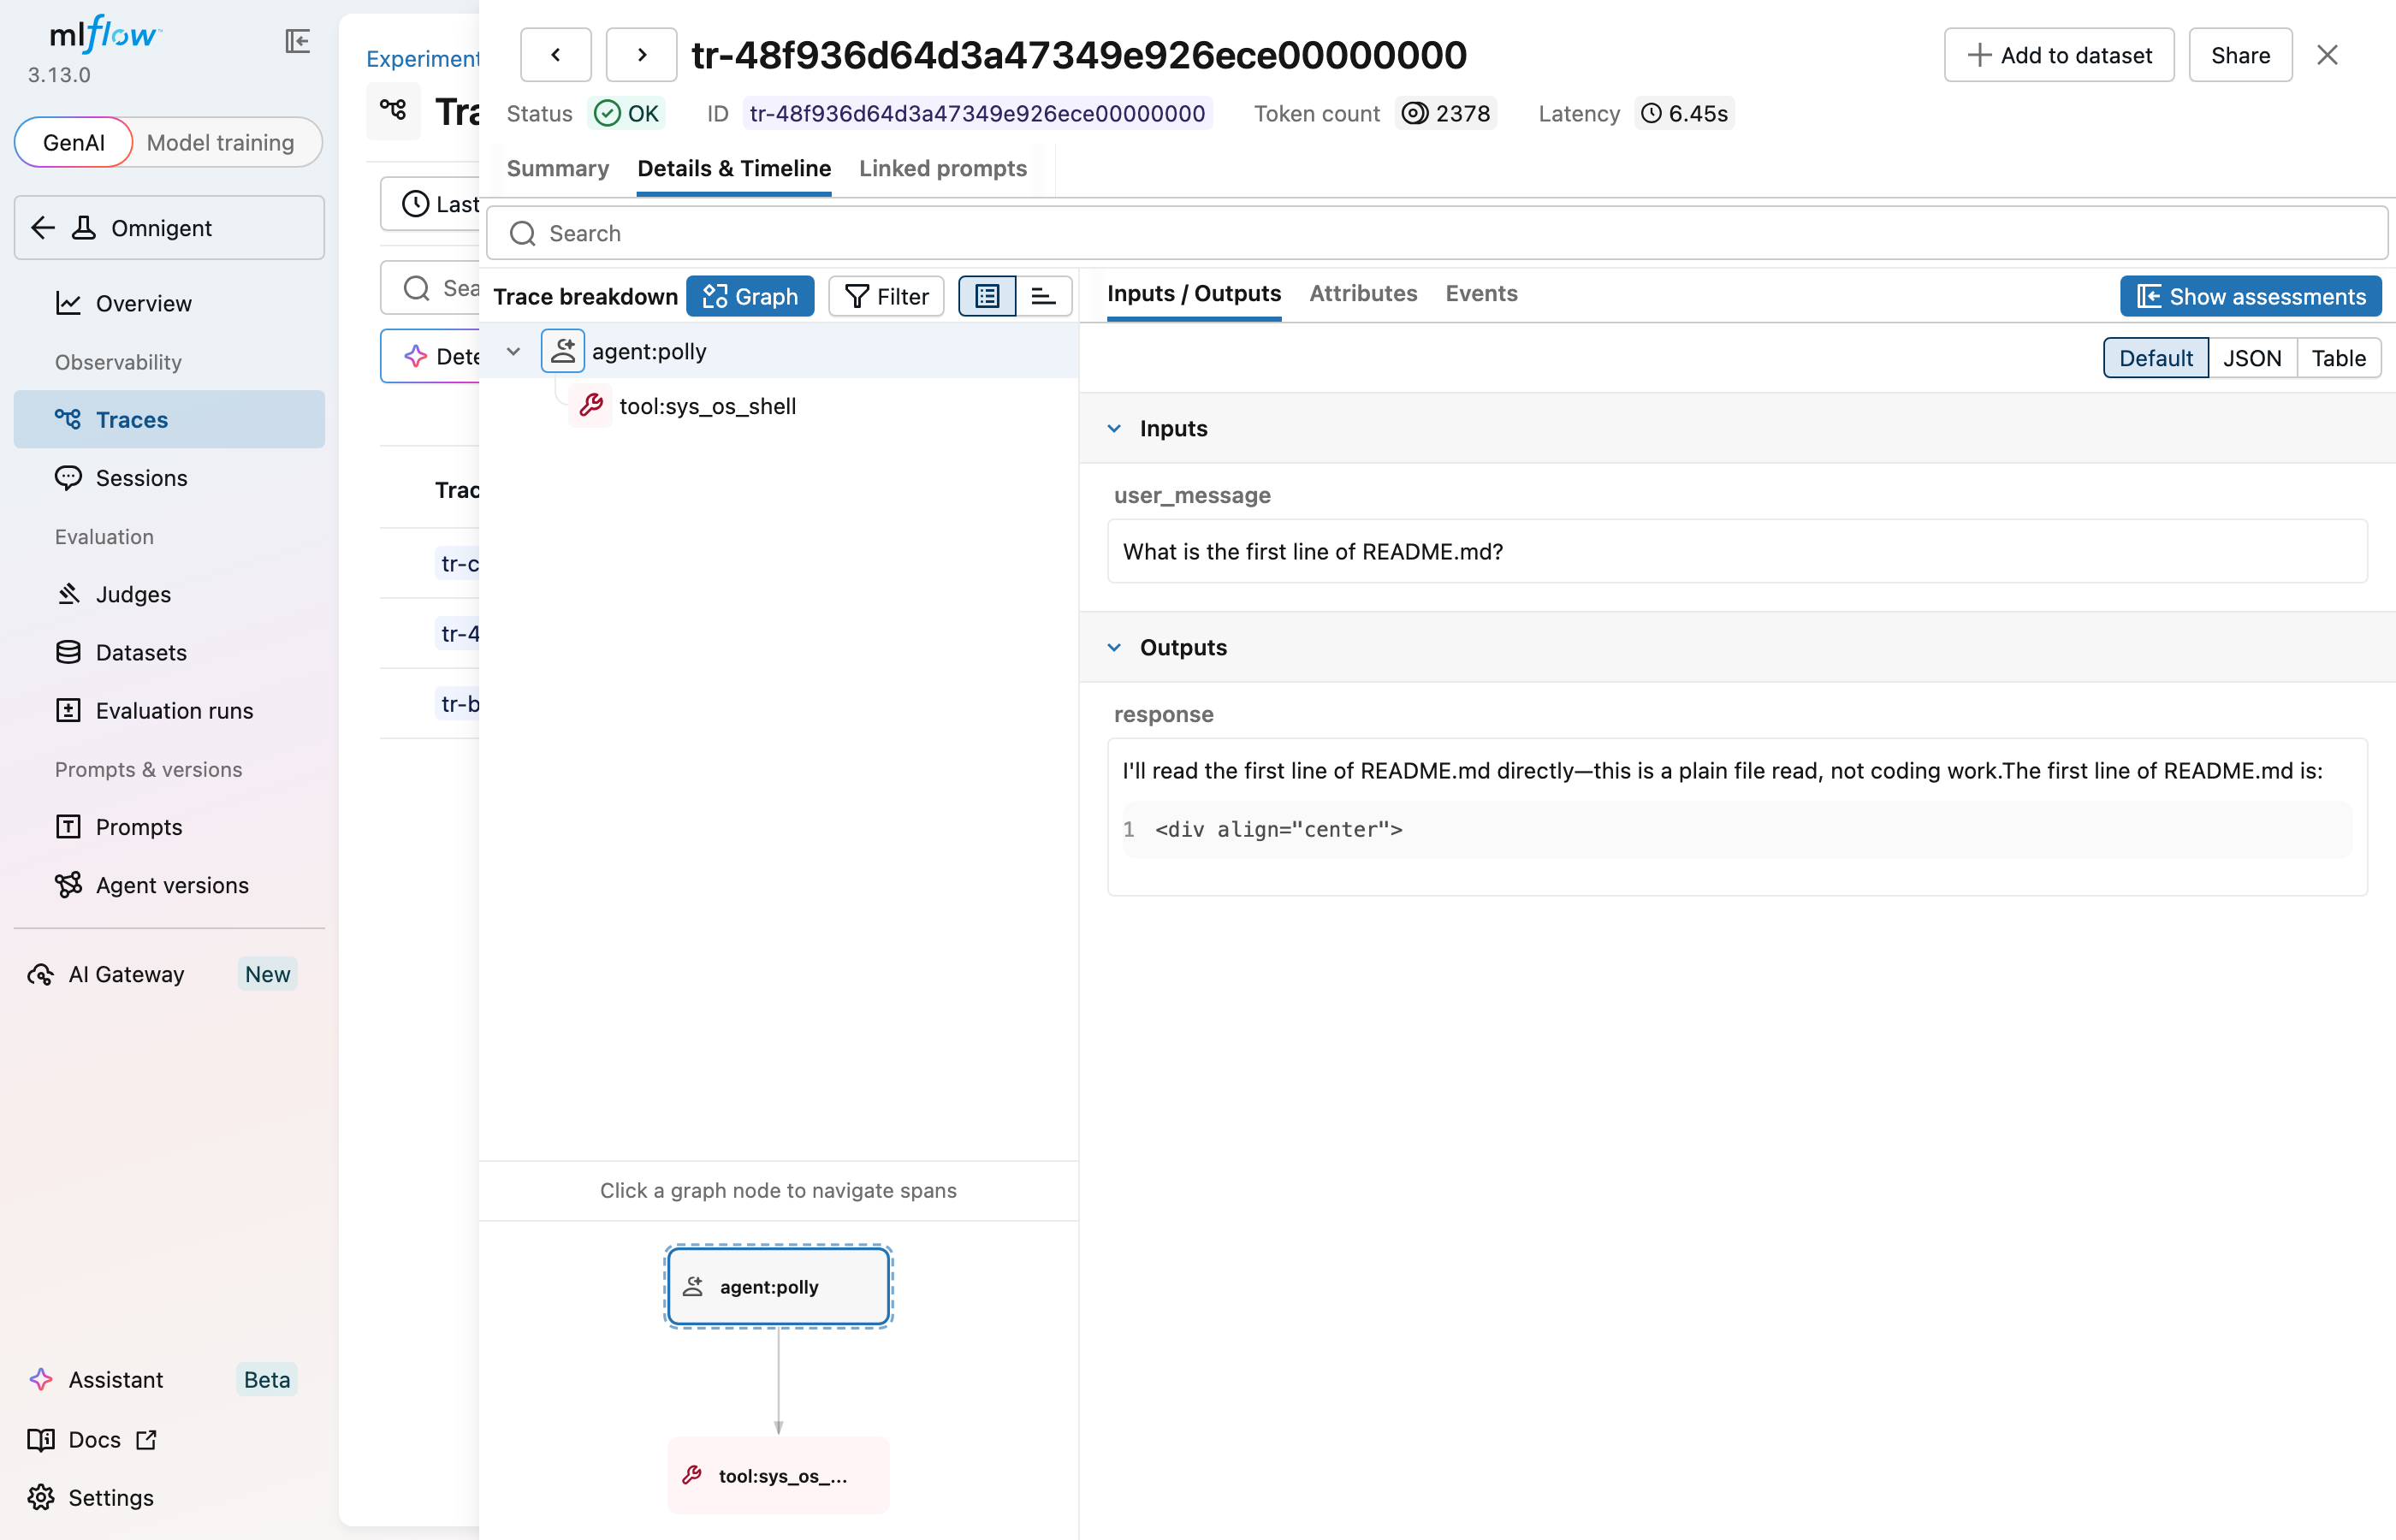
Omnigent uses MLflow's tracing SDK to emit structured spans in a hierarchy that mirrors the agent execution:
agent:<name>         (AGENT)       — user message, response, token usage
├── tool:<name>      (TOOL)        — arguments, result, duration
├── tool:<name>      (TOOL)
└── ...
Deterministic Trace ID
Omnigent response IDs use the format resp_<32-char hex>. The hex suffix is reused as the W3C trace ID, so operators can look up a trace by its response ID — just strip the resp_ prefix and paste the hex into any trace backend's search UI. No lookup table needed.
Unified Provider Mode
Omnigent sets MLFLOW_USE_DEFAULT_TRACER_PROVIDER=false so MLflow shares the global OpenTelemetry TracerProvider with raw OTel instrumentation (e.g., FastAPI auto-instrumentation). This means MLflow spans and raw OTel spans appear in the same trace tree.
Configuration Reference
| Variable | Purpose | Default |
|---|---|---|
OTEL_EXPORTER_OTLP_ENDPOINT | OTLP collector endpoint (e.g. your MLflow server URL) | unset |
OTEL_EXPORTER_OTLP_PROTOCOL | OTLP transport (grpc or http/protobuf) | grpc |
MLFLOW_TRACKING_URI | MLflow tracking server (fallback when no OTLP endpoint) | unset |
Monitoring Token Usage
MLflow automatically tracks token usage for each agent turn within Omnigent sessions. Token counts — including cache read and cache creation breakdowns — are logged on the agent span. Aggregated cost and time trends are displayed in the built-in experiment dashboard.
See Token Usage and Cost Tracking for details on accessing this information programmatically.
Troubleshooting
Tracing not working:
- Verify that
omnigent[tracing]is installed:python -c "import mlflow; print(mlflow.__version__)" - Check that
OTEL_EXPORTER_OTLP_ENDPOINTorMLFLOW_TRACKING_URIis set in the environment that starts the Omnigent server - Confirm the MLflow tracking server or OTLP collector is reachable
Missing traces:
- Traces are exported asynchronously. If the server shuts down abruptly, buffered spans may be lost.
- Check server logs for MLflow initialization warnings.
Content not appearing on spans:
- Message content is opt-in. Set
OMNIGENT_OTEL_CAPTURE_CONTENT=trueto include user messages and tool results on spans. This is disabled by default because messages may contain PII or secrets.
Next Steps
Track User Feedback
Record user feedback on traces for tracking user satisfaction.
Search Traces
Search and filter traces to find specific agent sessions.
Evaluate Traces
Evaluate traces with LLM judges to understand and improve your AI application's behavior.