Tracing Open WebUI
Open WebUI is a self-hosted web interface for running LLMs locally or via remote APIs. MLflow integrates with Open WebUI through its Pipelines system — a lightweight filter mechanism that intercepts every chat request and response. This page shows how to install and configure an MLflow filter pipeline that logs a trace for every conversation turn, grouped by session in the MLflow UI.
How It Works
Open WebUI's Pipelines system supports filter pipelines with two hooks:
inlet— runs before each request; captures the user message and session contextoutlet— runs after each response; logs a complete MLflow trace with user input, assistant response, model name, and token usage
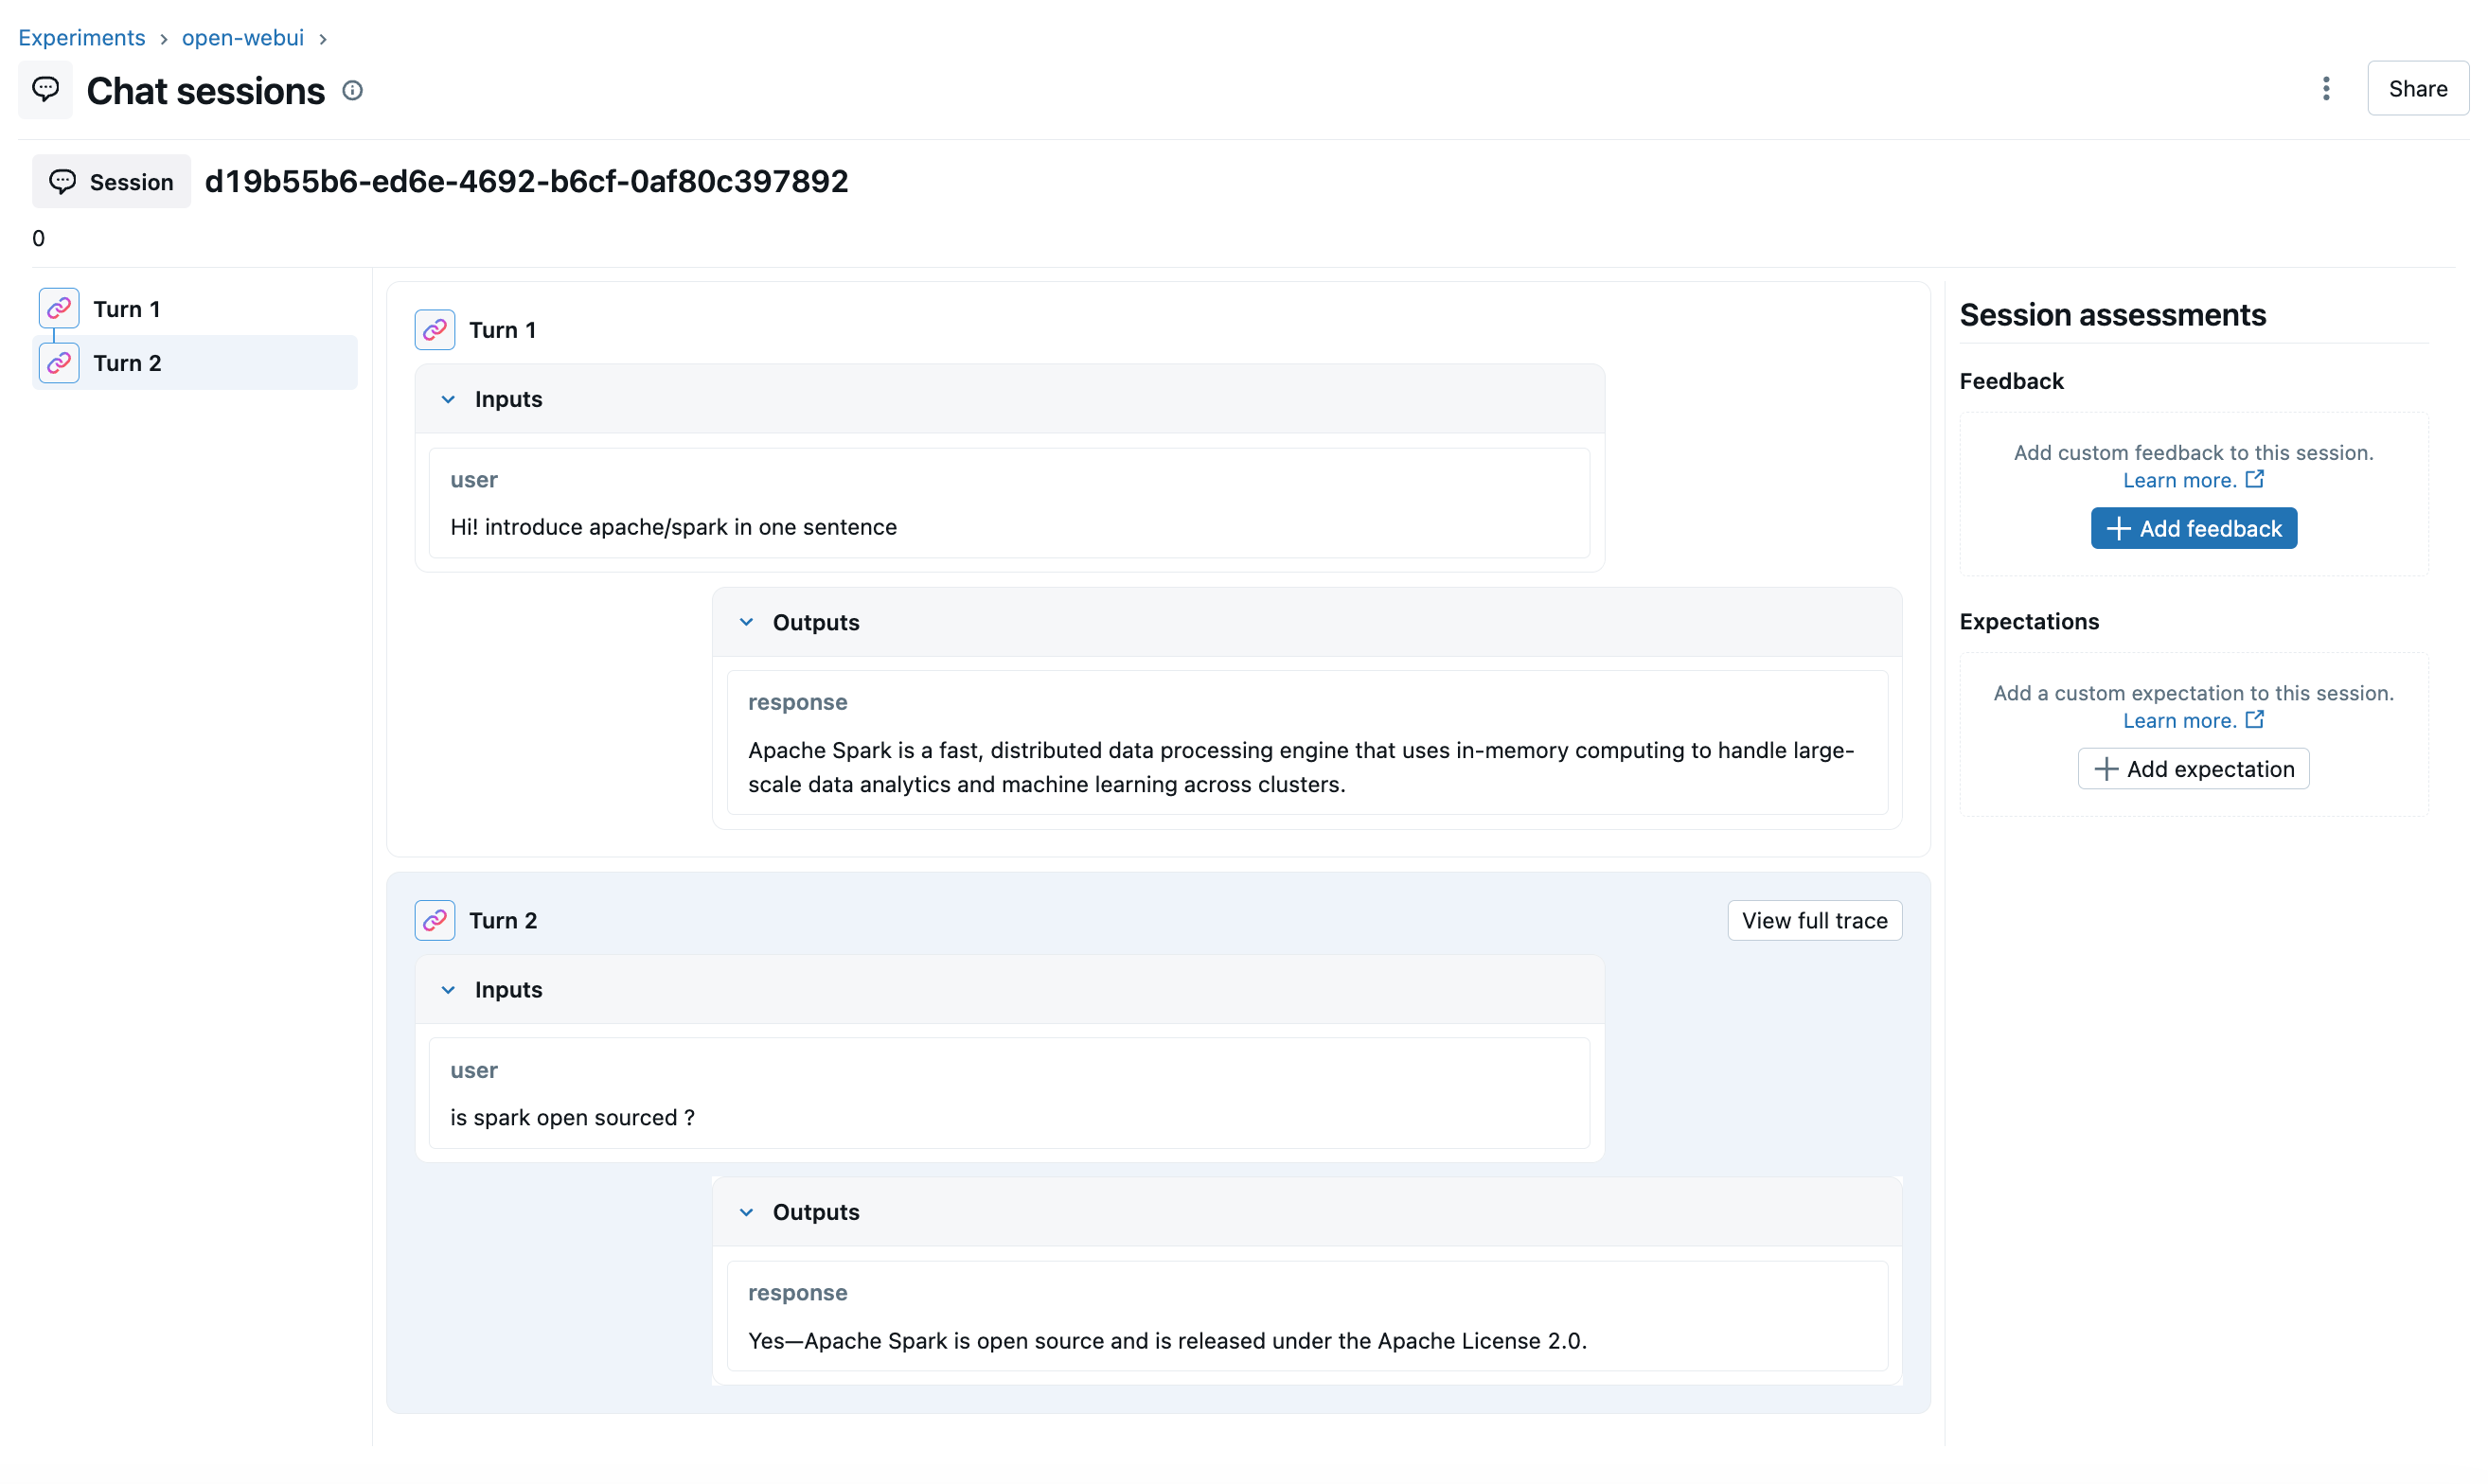
All turns of the same conversation are linked via mlflow.trace.session, so you can select "Group by session" in the MLflow UI to see the full conversation flow.
Step 1: Start the MLflow Server
mlflow server --disable-security-middleware
Step 2: Start Open WebUI
open-webui serve
Step 3: Launch the Pipeline Service via Docker
Build a custom Docker image with MLflow installed:
cat > Dockerfile.mlflow <<'EOF'
FROM ghcr.io/open-webui/pipelines:main
RUN pip install --no-cache-dir mlflow
EOF

docker build -f Dockerfile.mlflow -t pipelines-mlflow .

docker run -p 9099:9099 \
  --add-host=host.docker.internal:host-gateway \
  -v pipelines:/app/pipelines \
  --name pipelines \
  --restart always \
  -e MLFLOW_TRACKING_URI=http://host.docker.internal:5000/ \
  -e DEBUG_MODE=true \
  pipelines-mlflow
Step 4: Connect Open WebUI to the Pipeline Server
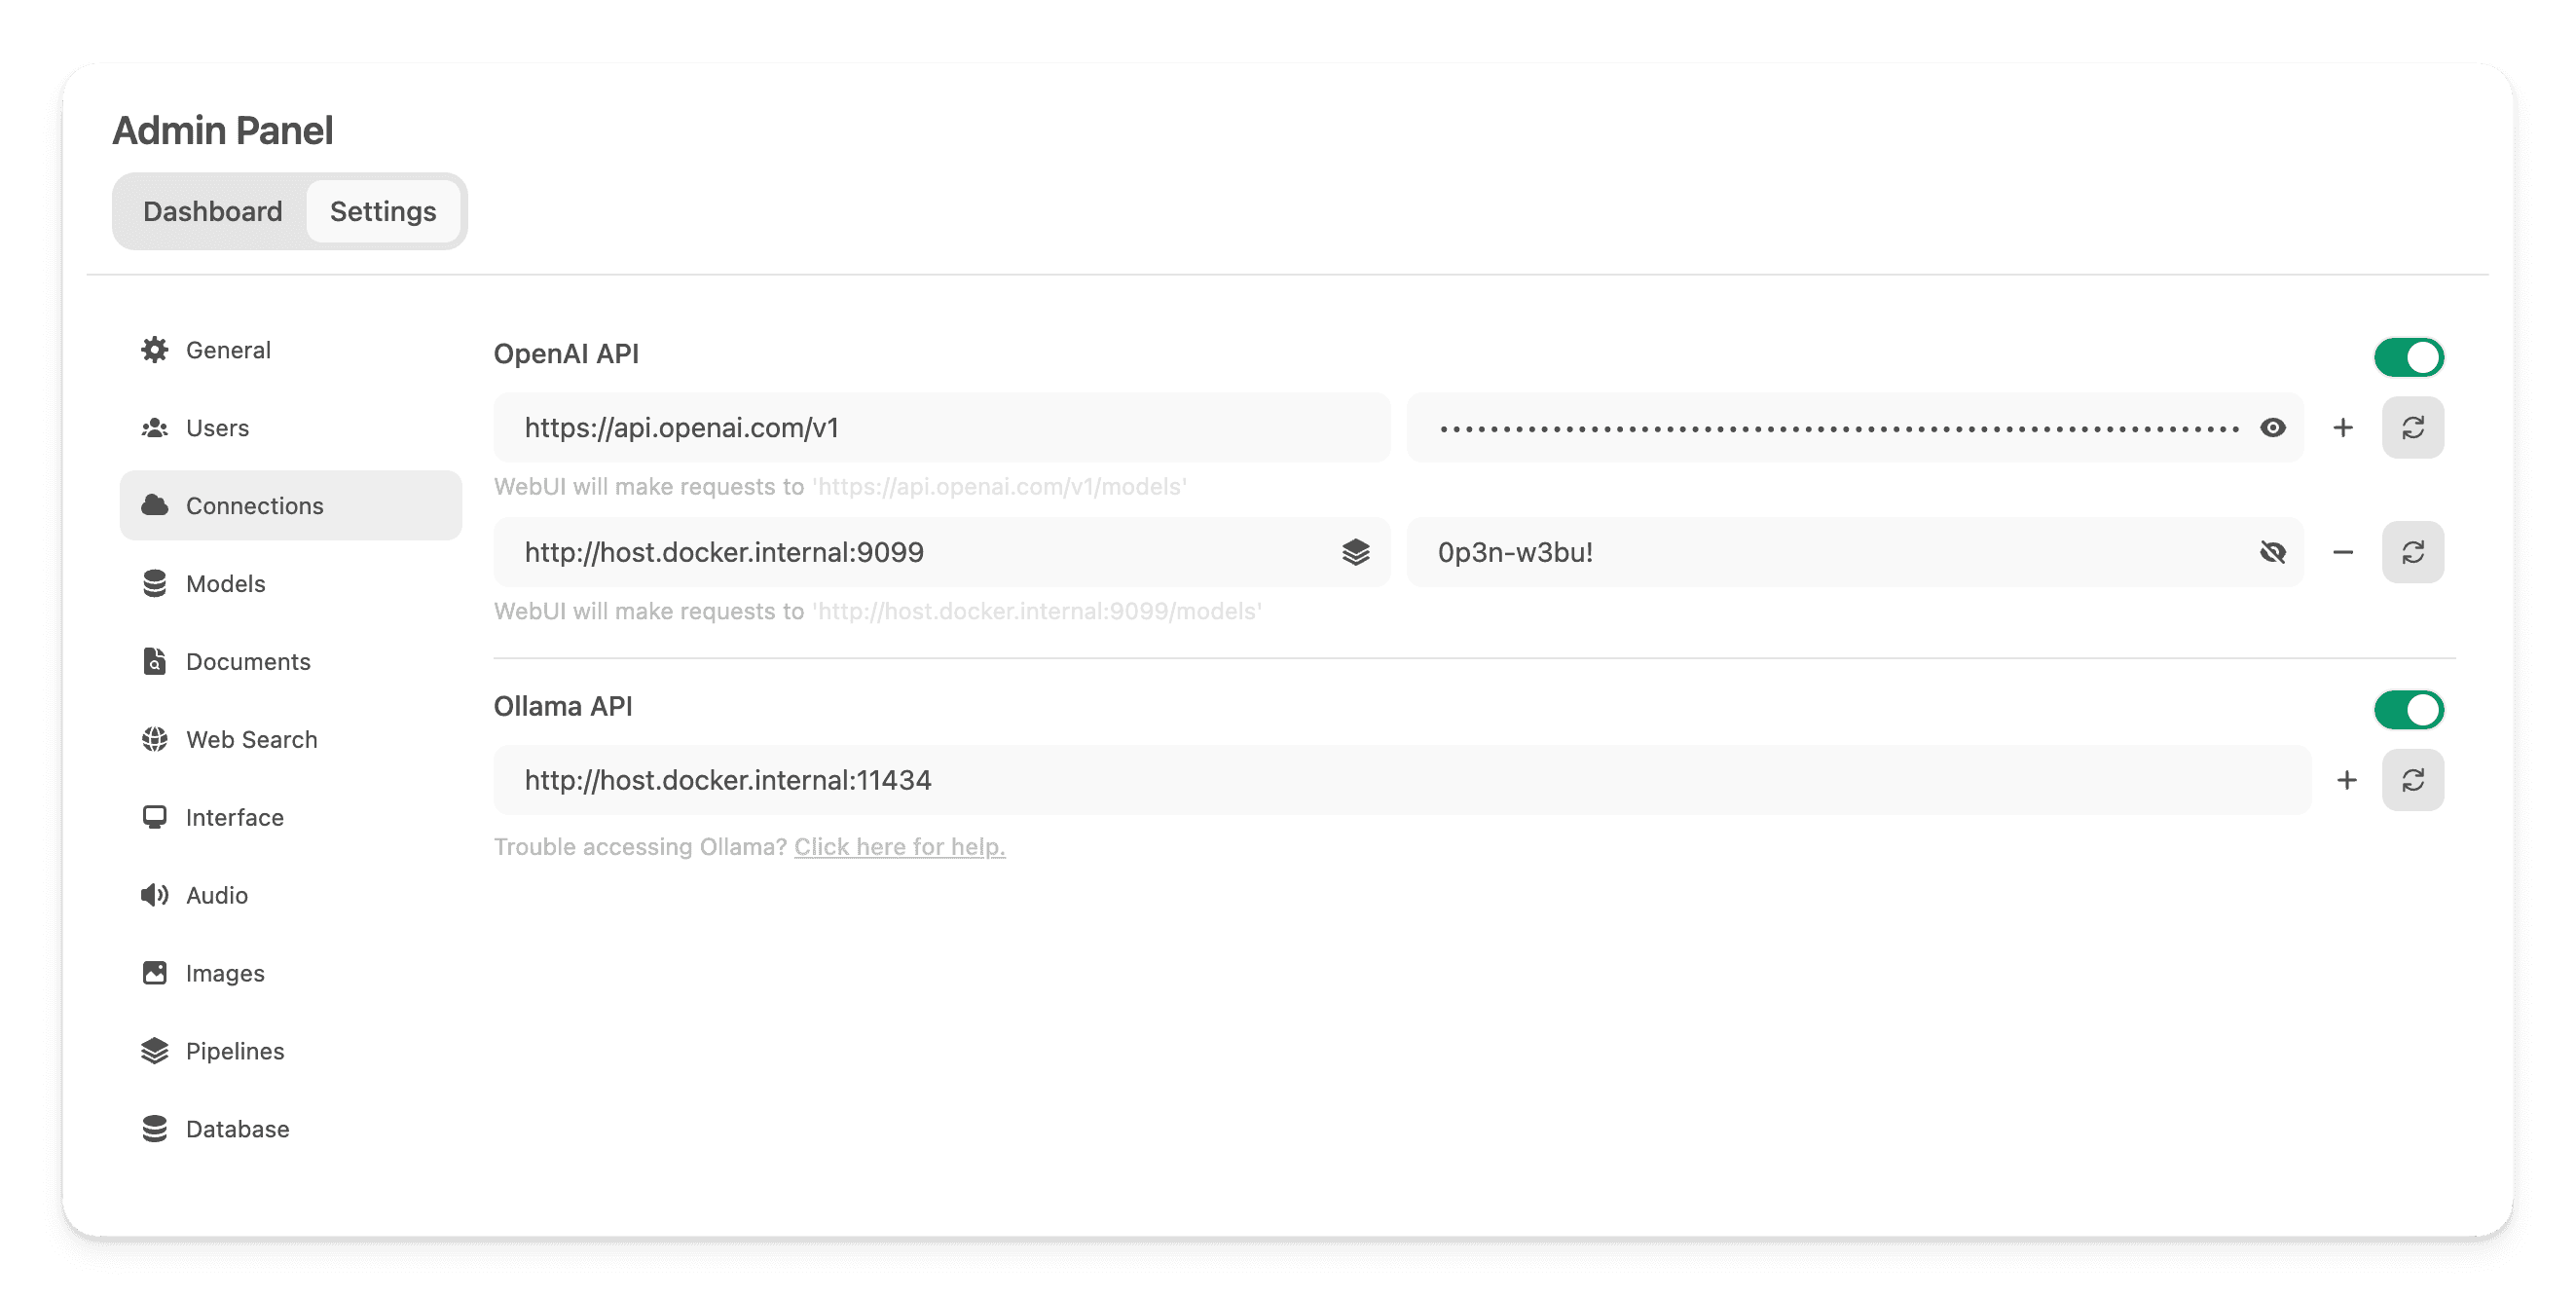
In Open WebUI, go to Admin Panel → Settings → Connections and add a new OpenAI API connection:
- URL:
http://localhost:9099/ - Password:
0p3n-w3bu!(default credential)
Step 5: Upload the Pipeline
Go to Admin Panel → Settings → Pipelines. Set the Pipelines listener address to http://host.docker.internal:9099, then upload the pipeline file using the file upload button. Then configure the MLflow tracking URI and experiment name in the pipeline's valve settings:
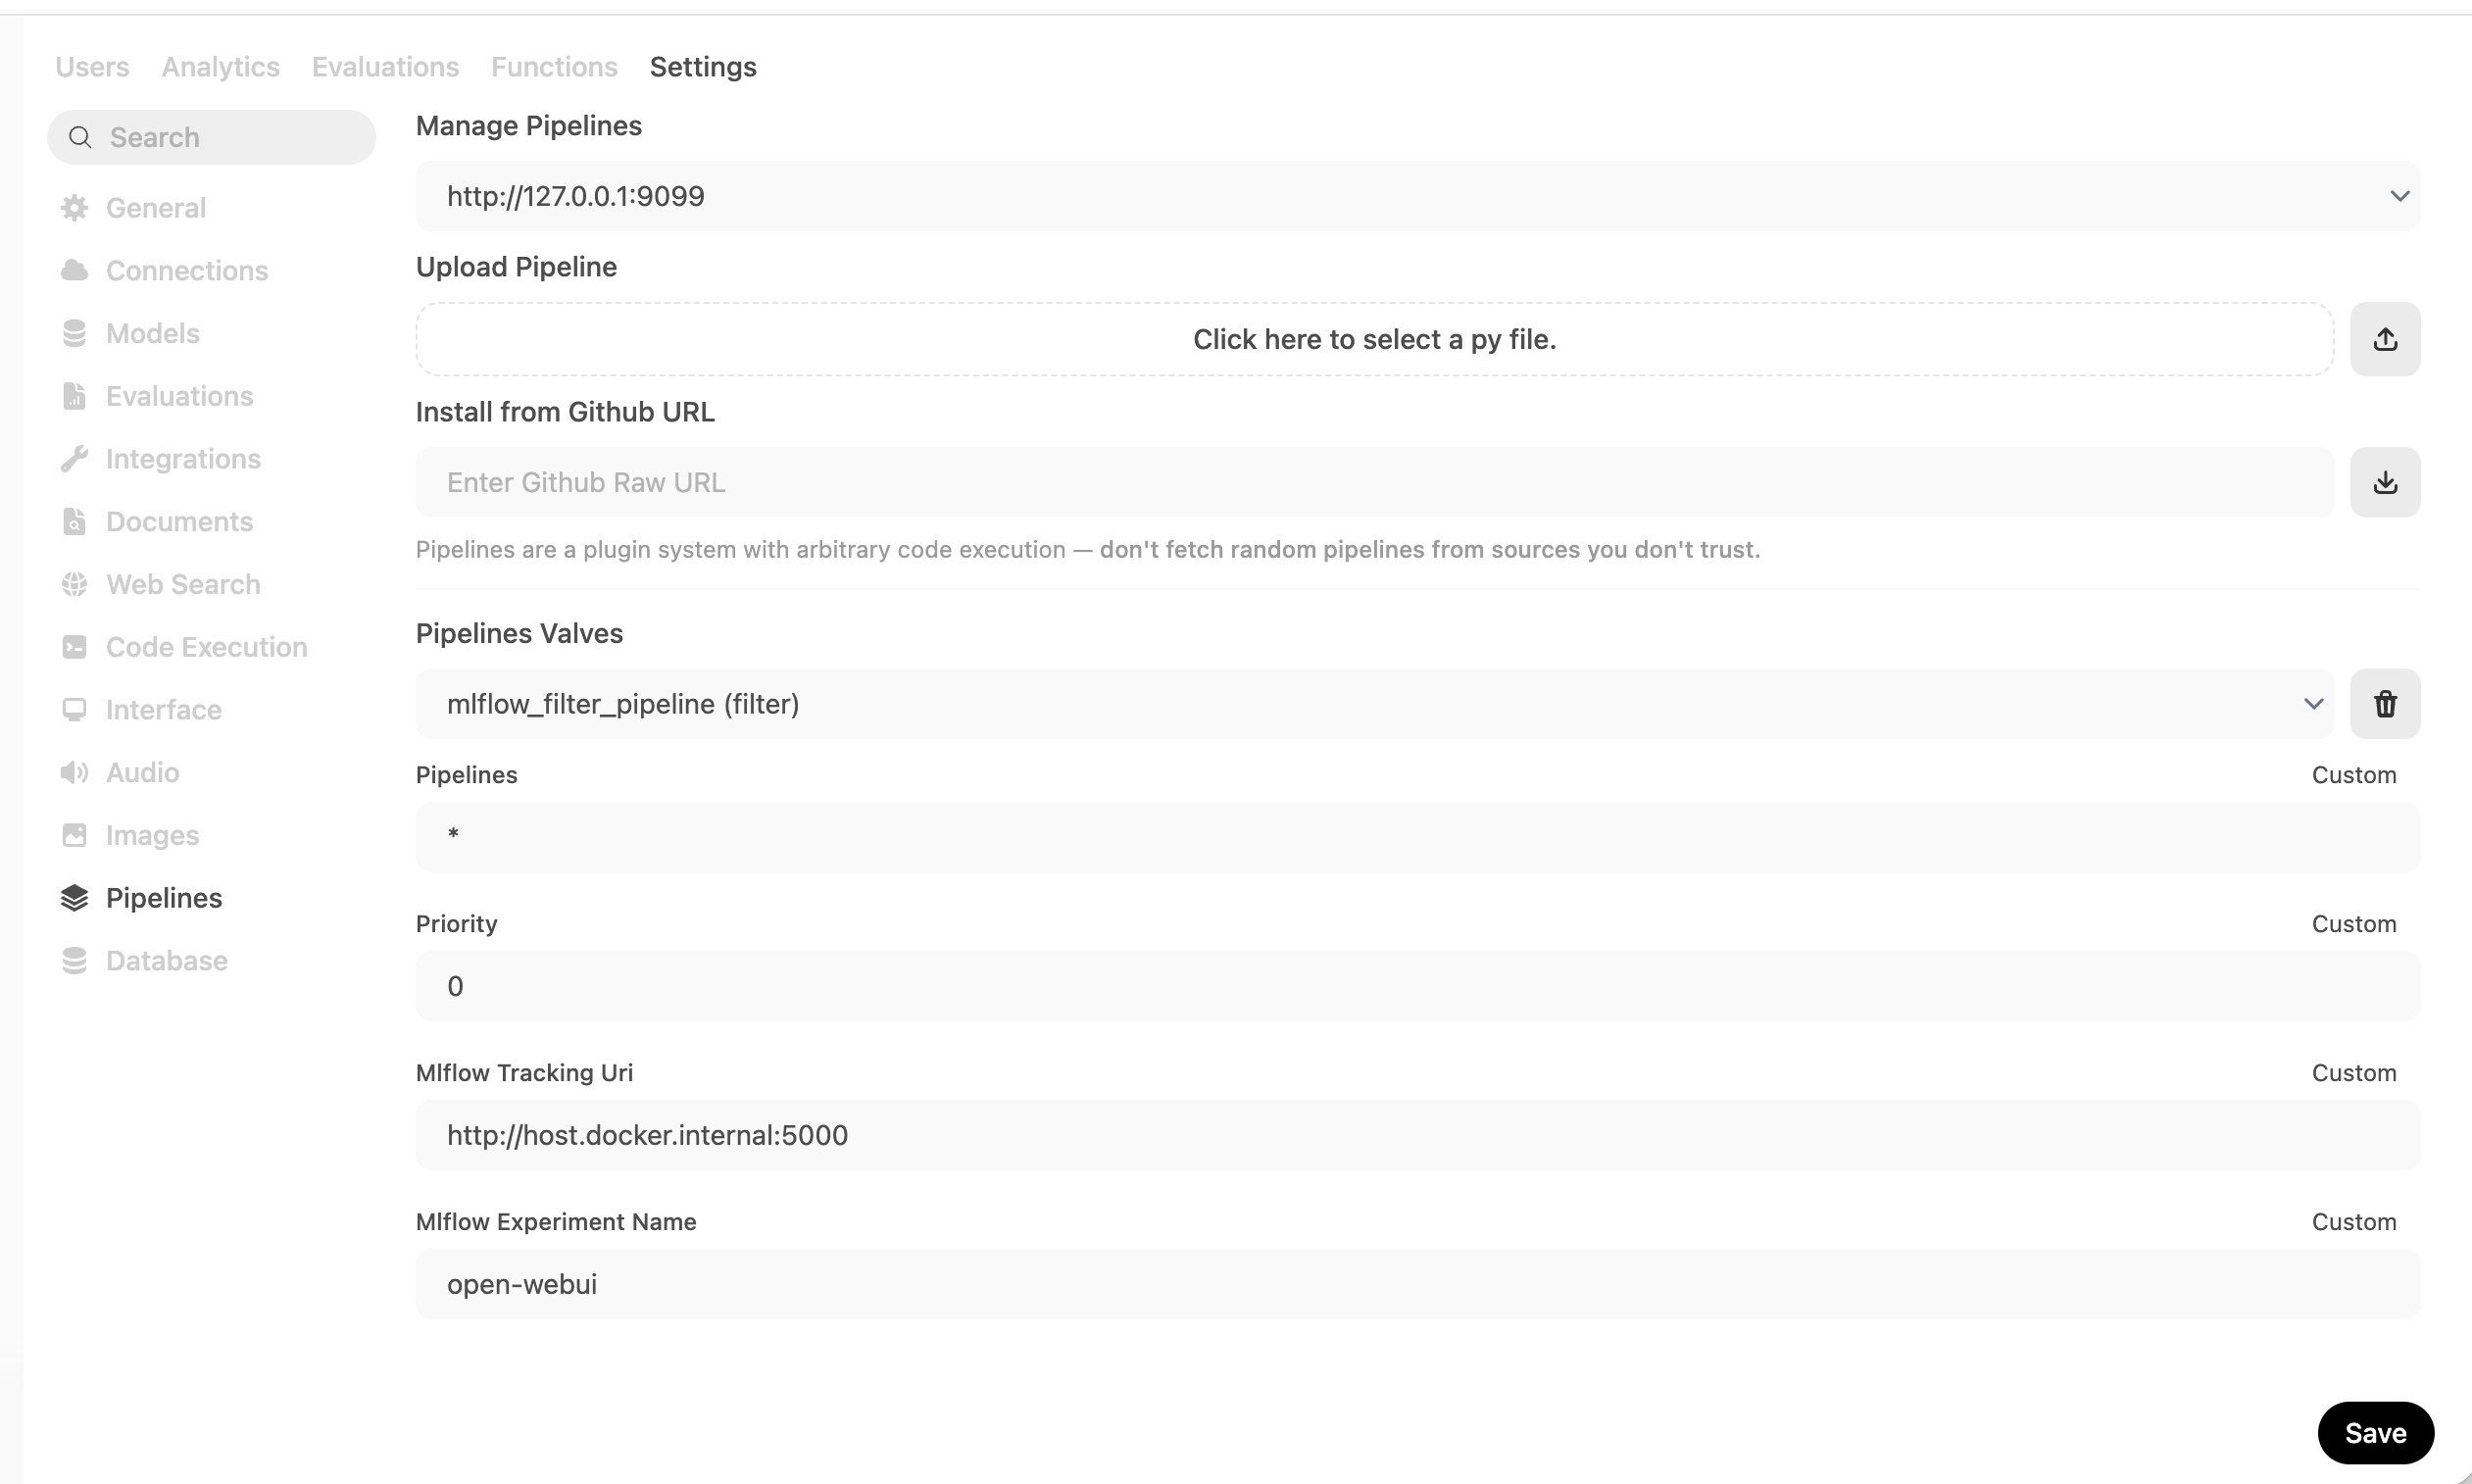
You can find the pipeline file at examples/open_webui/mlflow_filter_pipeline.py in the MLflow repository.
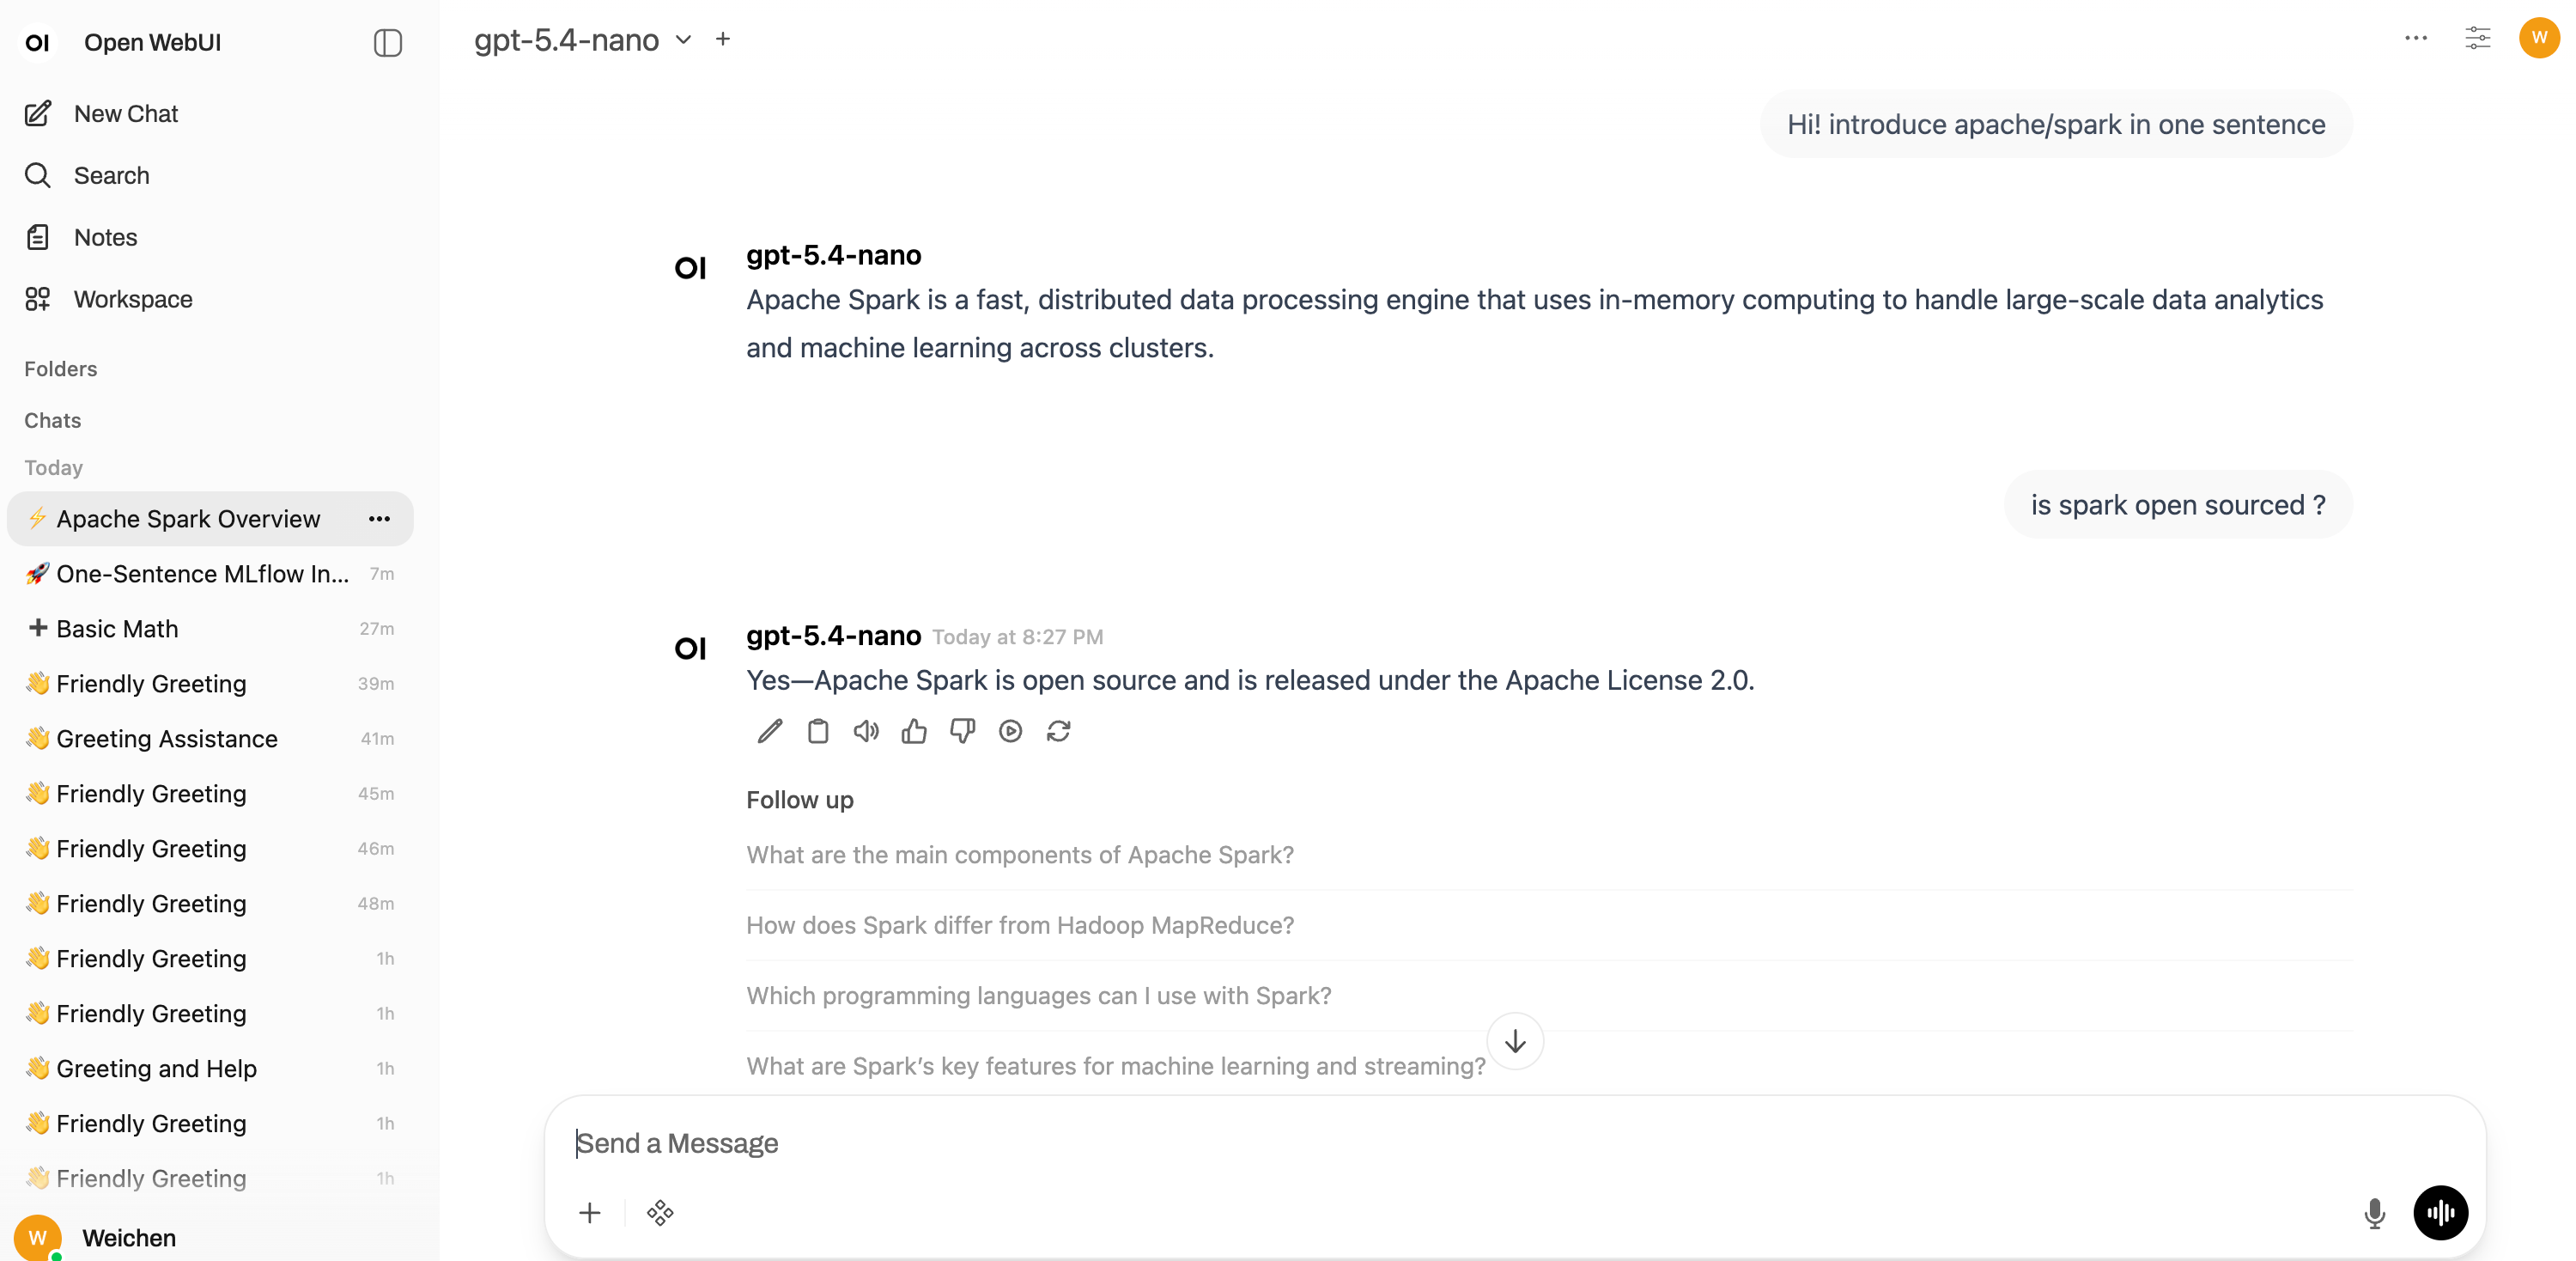
Step 6: Chat and Observe Traces
Start a conversation in Open WebUI:
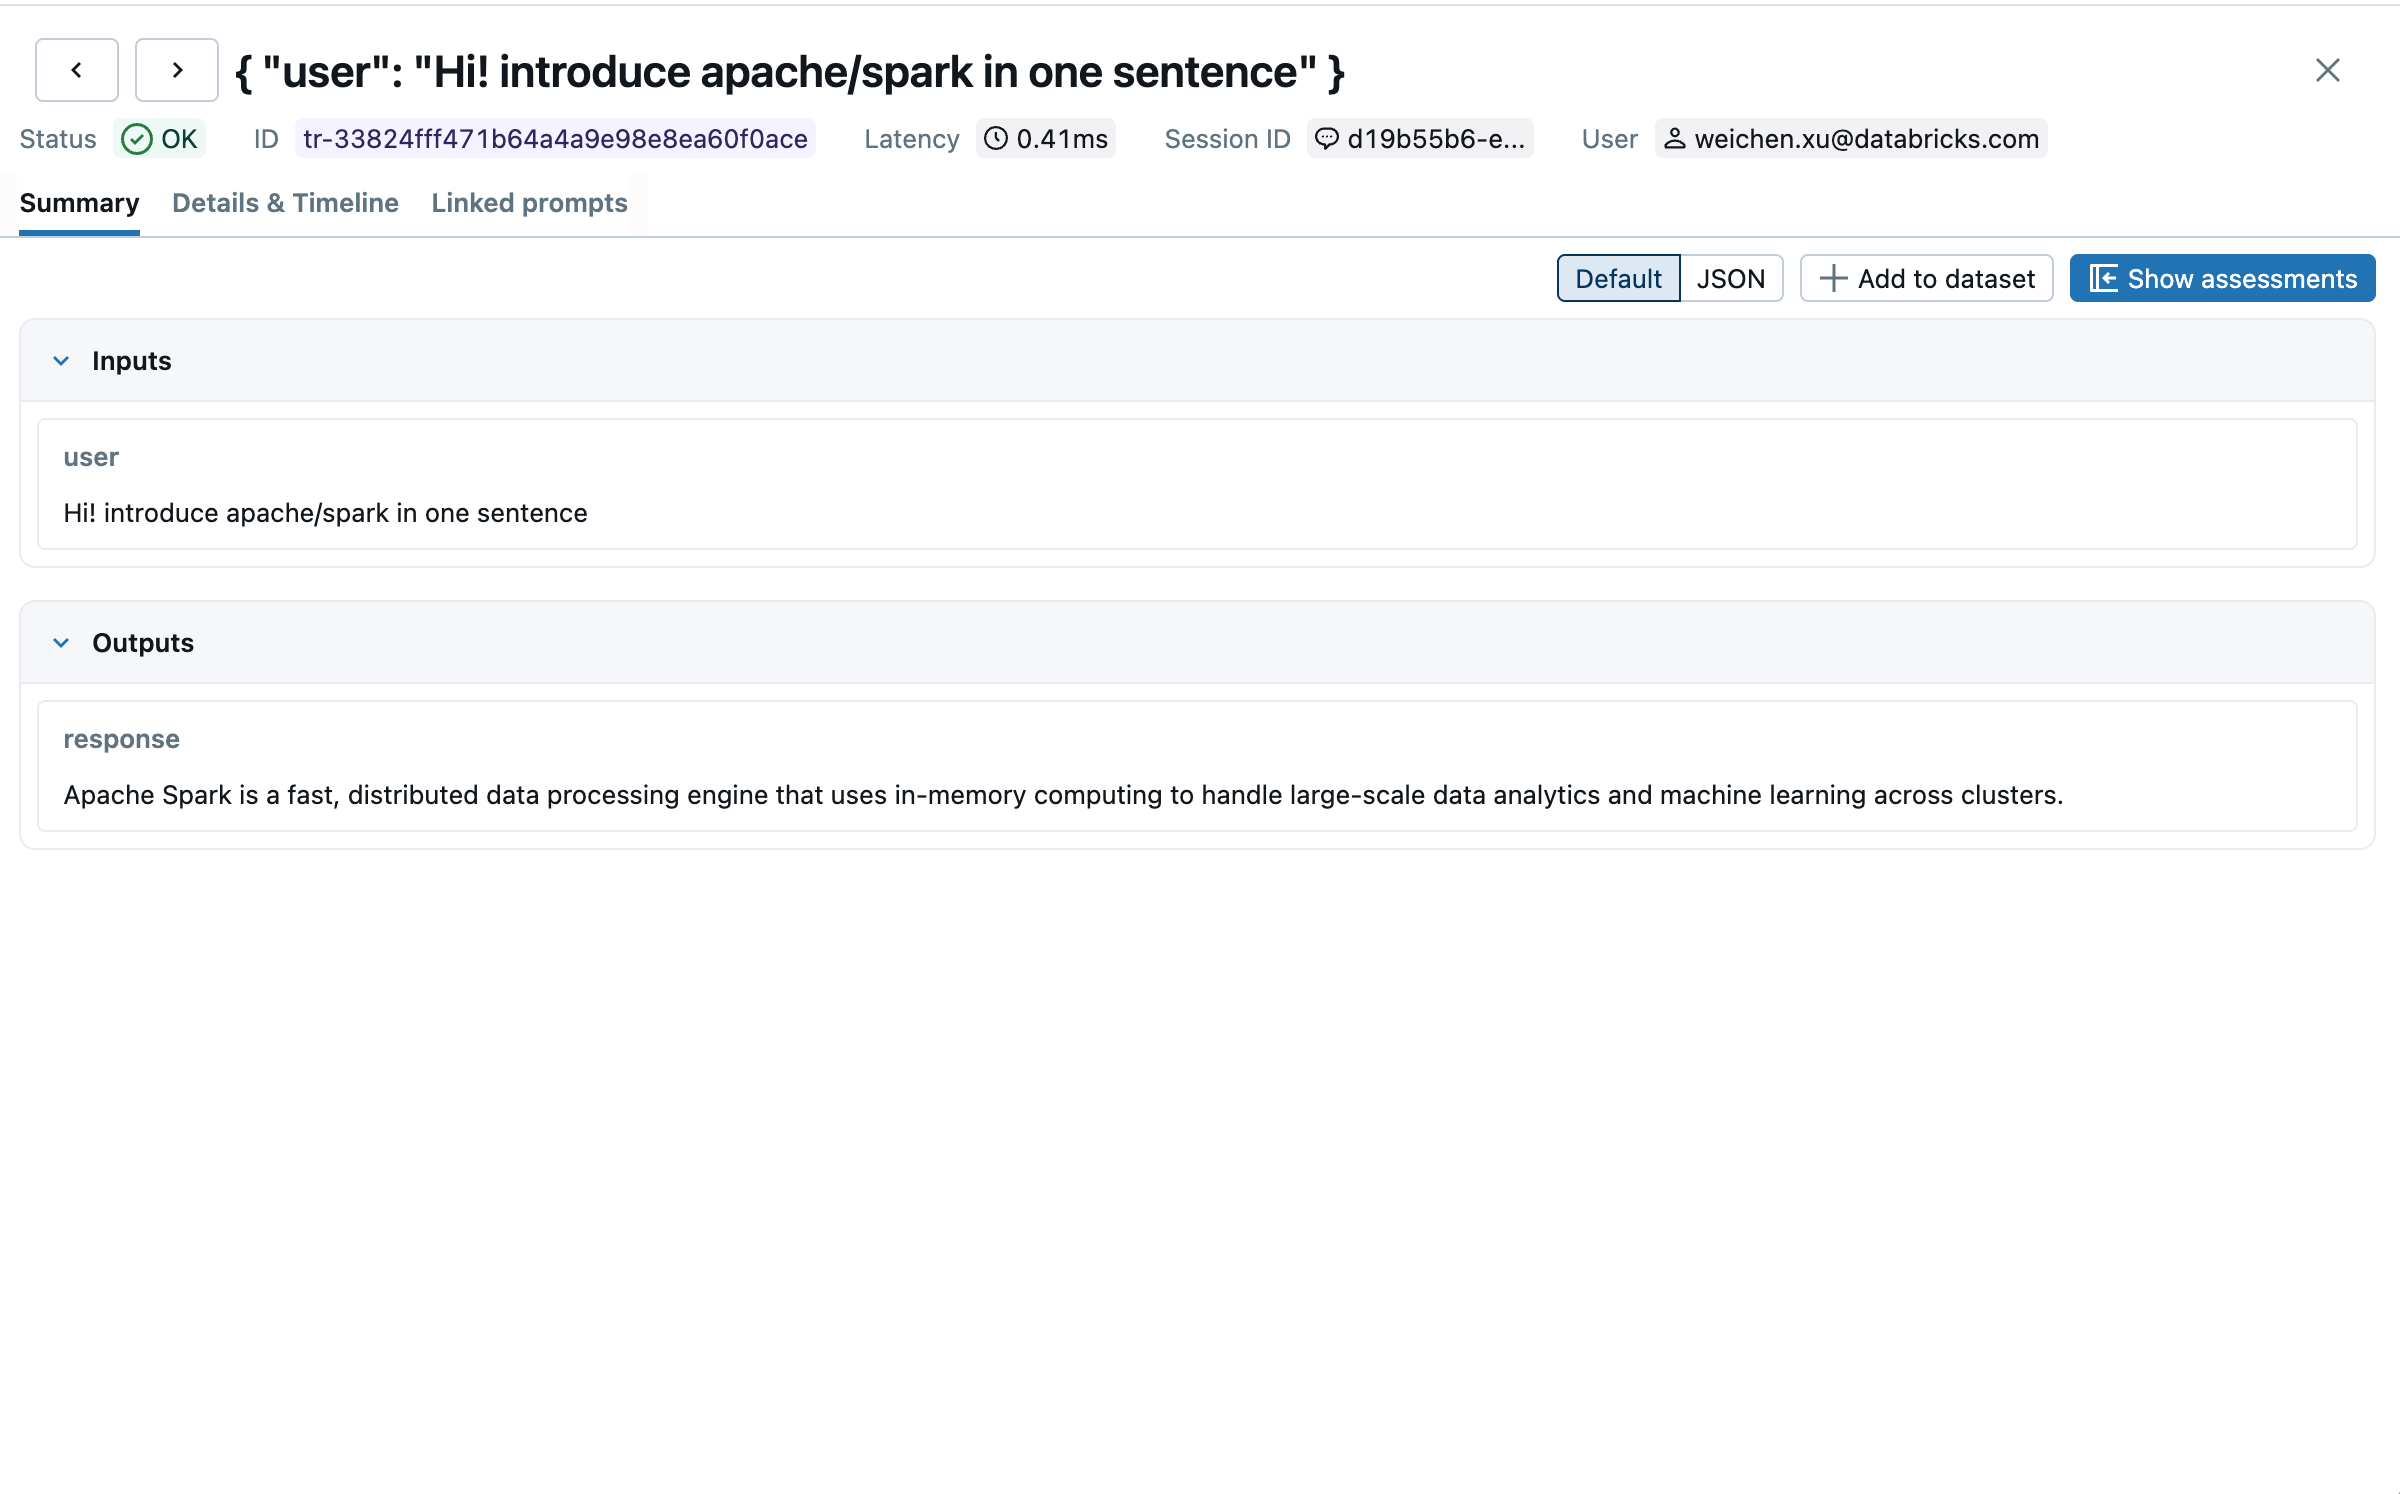
Open the MLflow UI and navigate to the Traces tab. Each conversation turn appears as a separate trace:
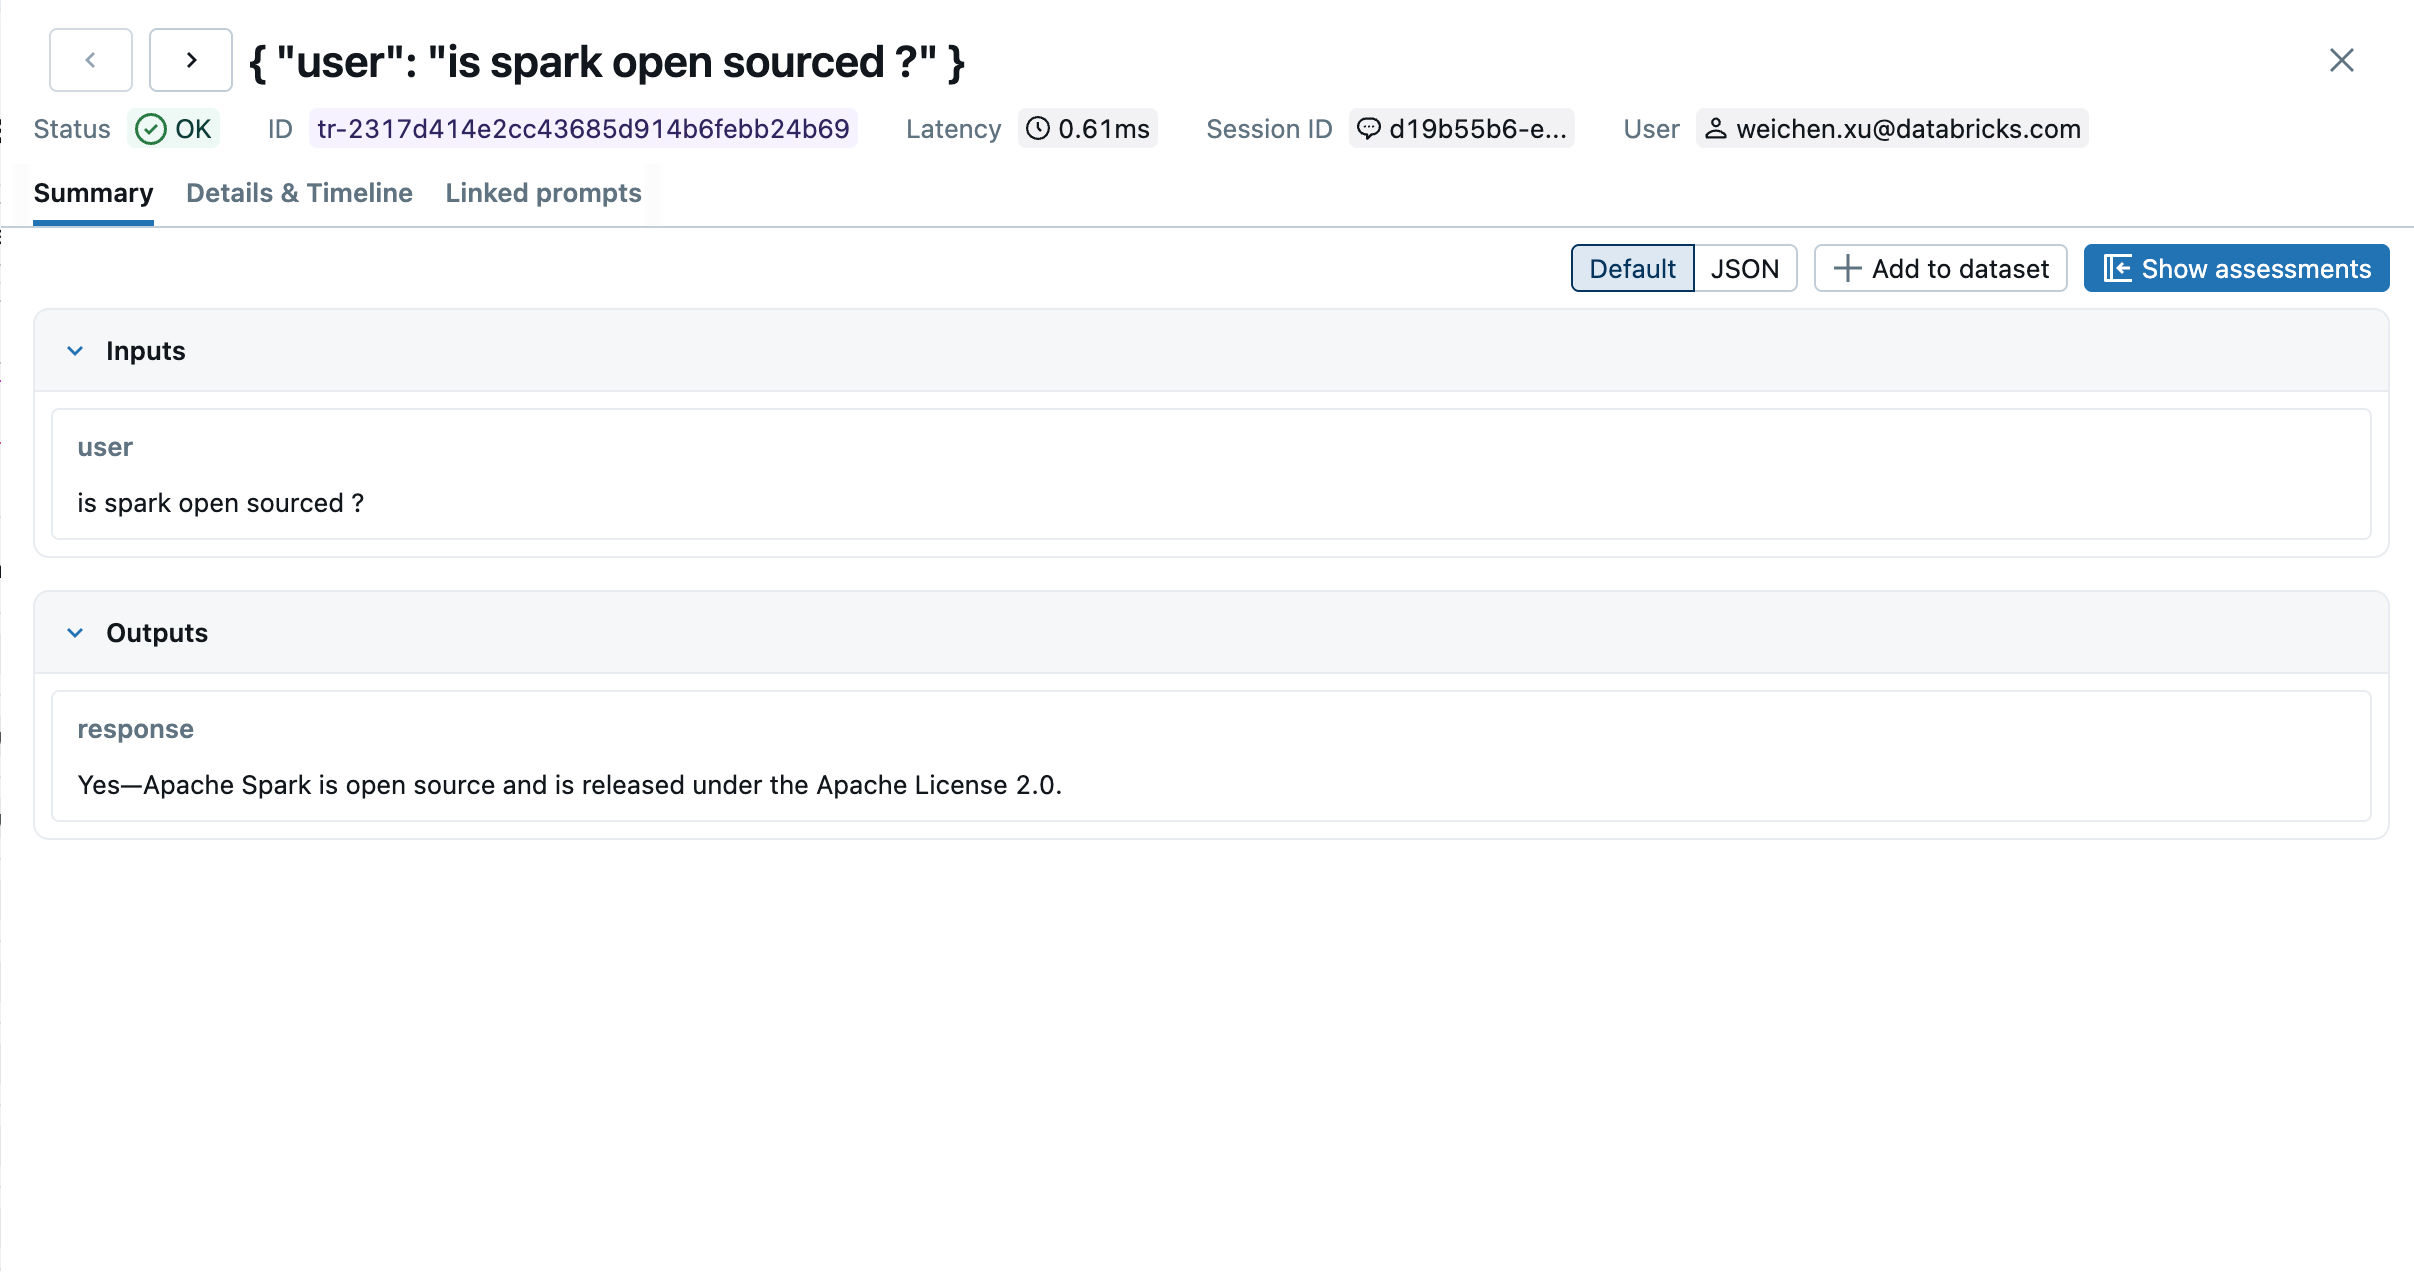
Enable "Group by session" to see the full conversation grouped under one session:
What Gets Traced
| Field | Description |
|---|---|
| Inputs | Last user message per turn |
| Outputs | Assistant response |
model | Model name reported by Open WebUI |
mlflow.trace.session | Chat ID — groups all turns of a conversation |
mlflow.trace.user | Authenticated user's email |
| Token usage | Input/output/total tokens when provided by the backend |
Configuration
The pipeline exposes the following valves configurable from the Open WebUI admin UI:
| Valve | Default | Description |
|---|---|---|
mlflow_tracking_uri | http://localhost:5000 | MLflow tracking server URI |
mlflow_experiment_name | open-webui | Experiment name in MLflow |
debug | false | Enable debug logging |
Full Example
A complete, runnable example including the pipeline source and setup instructions is available in the MLflow repository:
Next steps
Track User Feedback
Record user feedback on traces for tracking user satisfaction.
Manage Prompts
Learn how to manage prompts with MLflow's prompt registry.
Evaluate Traces
Evaluate traces with LLM judges to understand and improve your AI application's behavior.