Tracing OpenCode
MLflow Tracing provides automatic tracing for OpenCode, a terminal-based agentic coding tool that supports multiple LLM providers including Claude, OpenAI, Google, and local models.
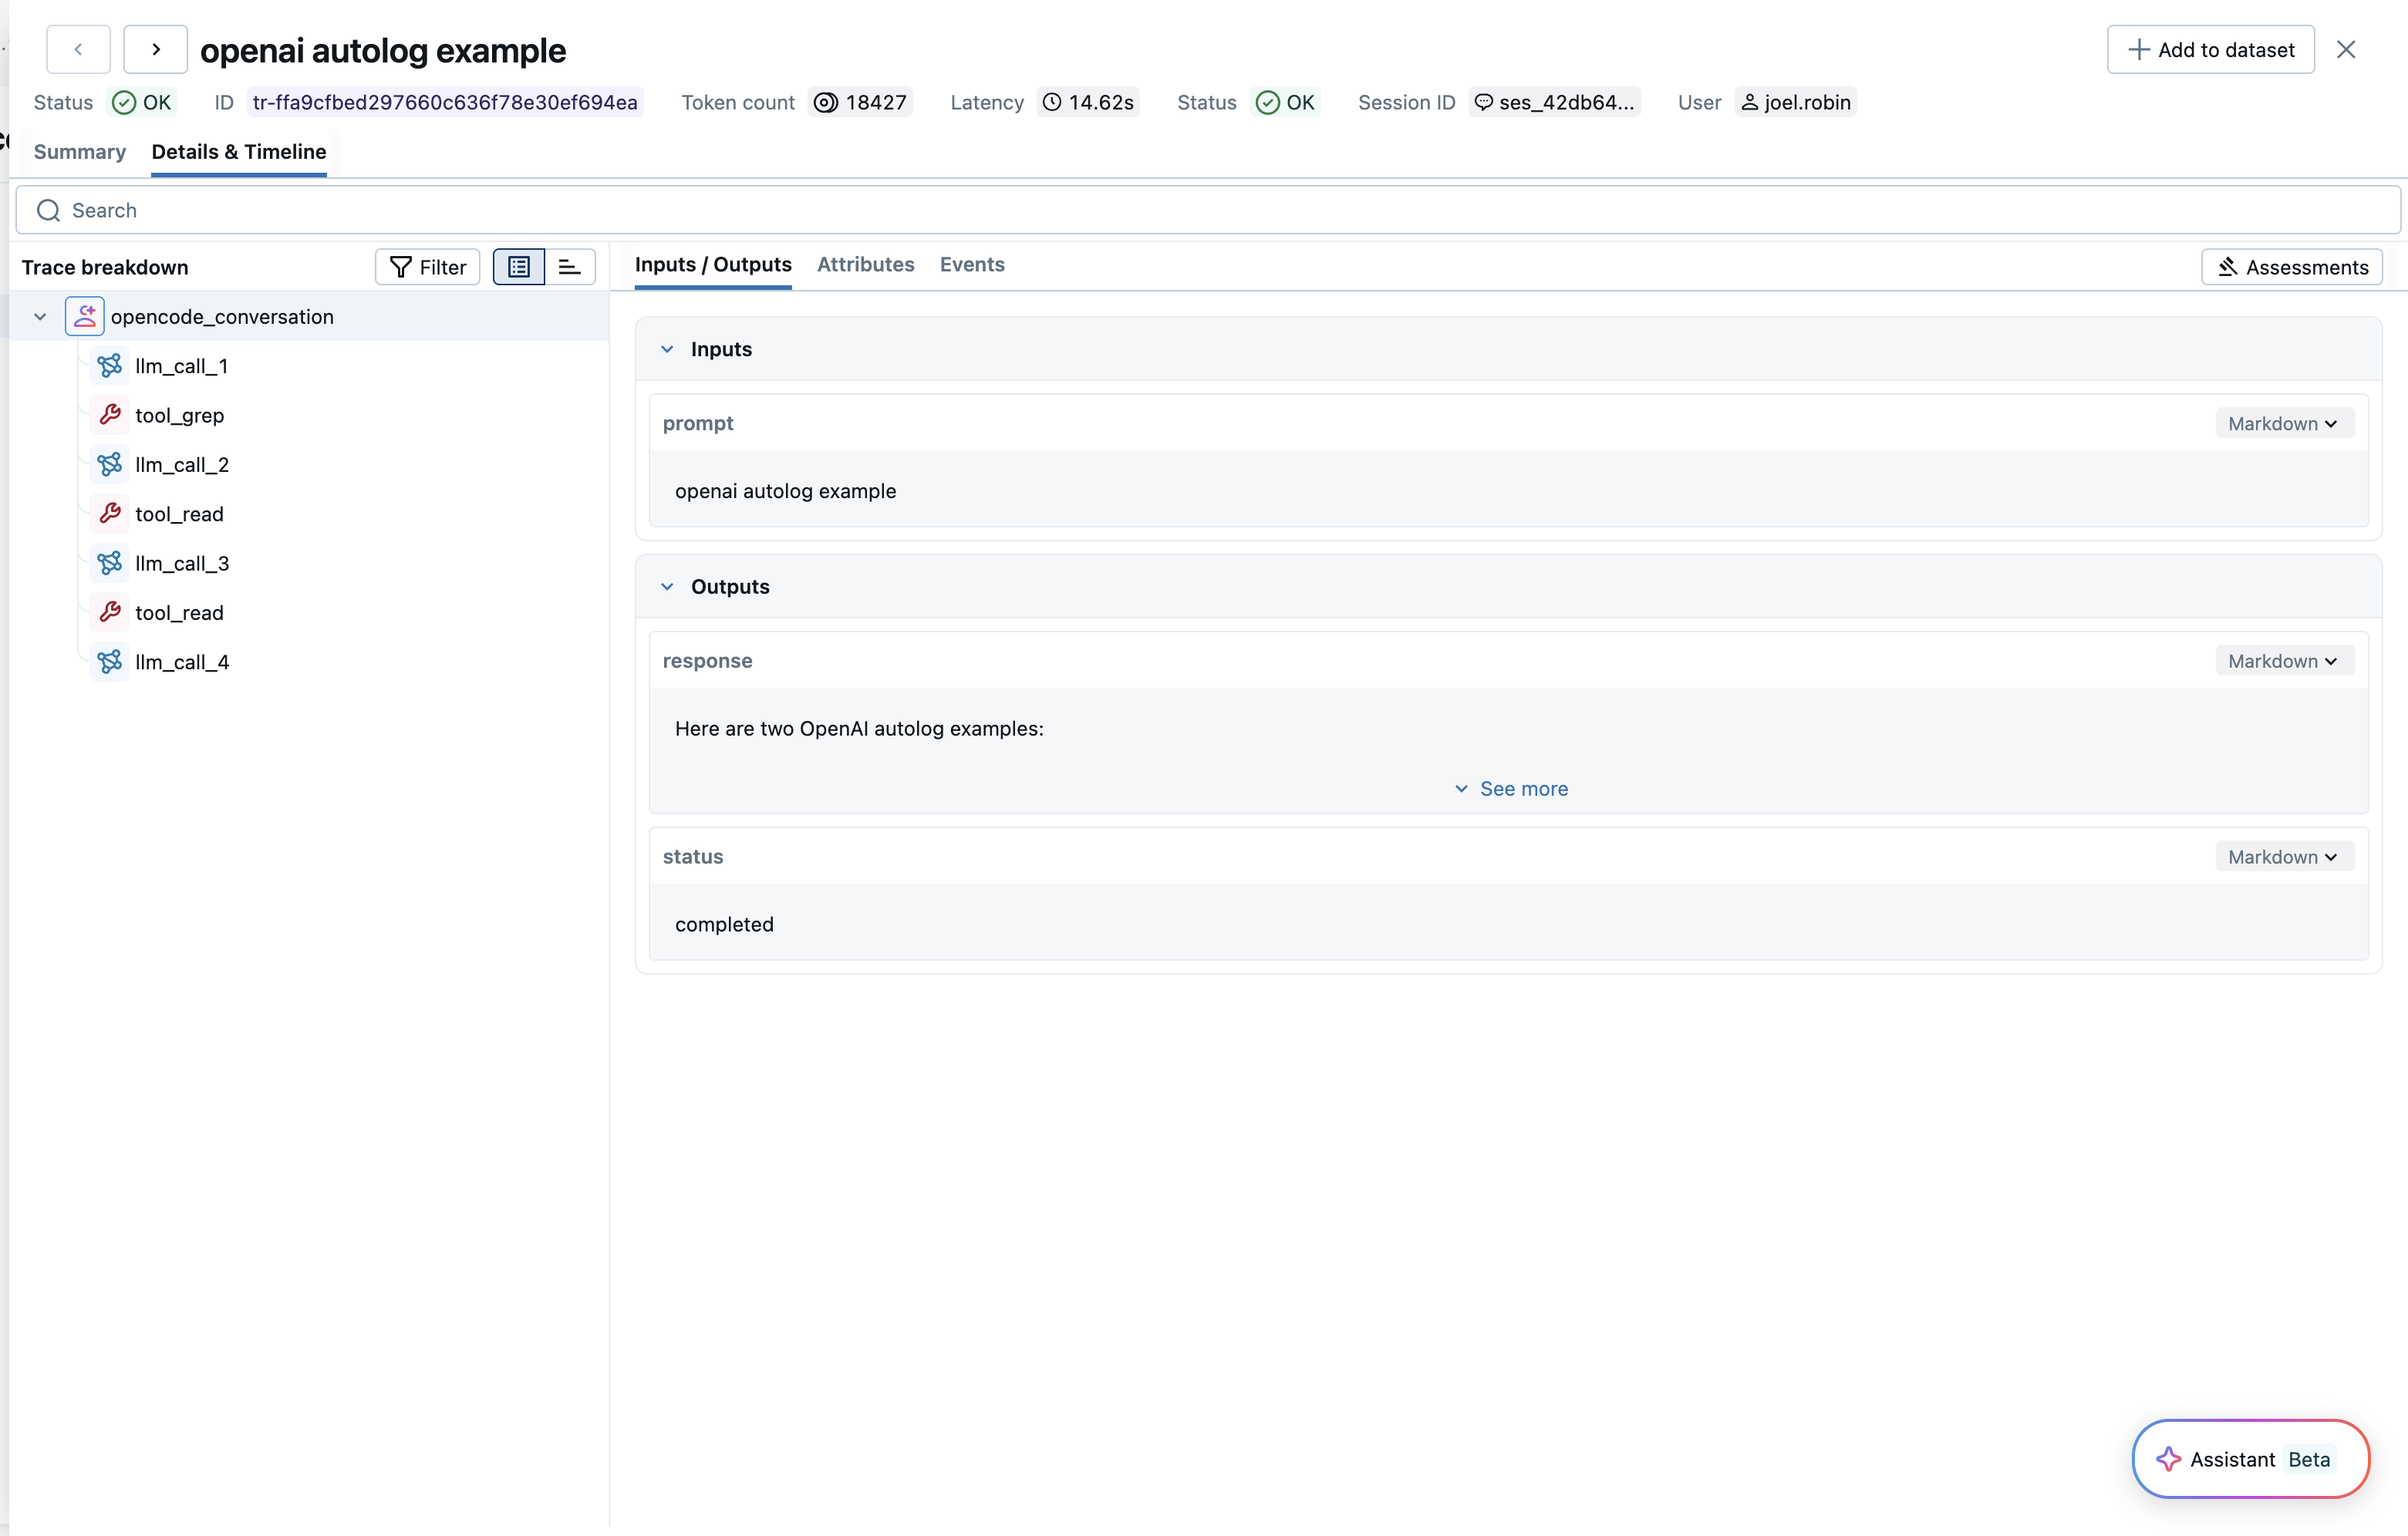
After setting up the MLflow plugin, MLflow will automatically capture traces of your OpenCode conversations and log them to the specified MLflow experiment. The trace automatically captures information such as:
- User prompts and assistant responses
- Tool usage (file operations, bash commands, code edits, etc.)
- Conversation timing and duration per turn
- Token usage (input, output, and total tokens)
Setup
OpenCode tracing is configured using the @mlflow/opencode plugin and environment variables.
Requirements
- OpenCode CLI installed
- Node.js runtime (for the plugin)
- The
@mlflow/opencodenpm package - An MLflow tracking server running
Step 1: Install the Plugin
npm install @mlflow/opencode
Step 2: Configure OpenCode
Add the plugin to your opencode.json file:
{
  "plugin": ["@mlflow/opencode"]
}
Step 3: Set Environment Variables
Create a .env file in your project root with the MLflow connection settings. OpenCode automatically loads .env files on startup, so the configuration persists across sessions:
MLFLOW_TRACKING_URI=http://localhost:5000
MLFLOW_EXPERIMENT_ID=123456
Alternatively, you can set them in your shell:
export MLFLOW_TRACKING_URI=http://localhost:5000
export MLFLOW_EXPERIMENT_ID=123456
Step 4: Start MLflow Server (if not already running)
You can start an MLflow server using Docker Compose, which doesn't require a Python environment:
docker compose up -d
Alternatively, if you have Python and mlflow installed:
mlflow server
Step 5: Run OpenCode
# Run OpenCode normally - tracing happens automatically
opencode
Traces will be automatically created when your OpenCode session becomes idle (after each conversation turn).
Configuration Reference
The plugin is configured entirely via environment variables:
| Environment Variable | Required | Description |
|---|---|---|
MLFLOW_TRACKING_URI | Yes | MLflow tracking server URI (e.g., http://localhost:5000) |
MLFLOW_EXPERIMENT_ID | Yes | Experiment ID to log traces to |
MLFLOW_OPENCODE_DEBUG | No | Set to true to enable debug logging to stderr |
Configuration Examples
# Local MLflow server
export MLFLOW_TRACKING_URI=http://localhost:5000
export MLFLOW_EXPERIMENT_ID=0

# Remote MLflow server
export MLFLOW_TRACKING_URI=http://mlflow.example.com:5000
export MLFLOW_EXPERIMENT_ID=123456

# Databricks MLflow
export MLFLOW_TRACKING_URI=databricks
export MLFLOW_EXPERIMENT_ID=123456789
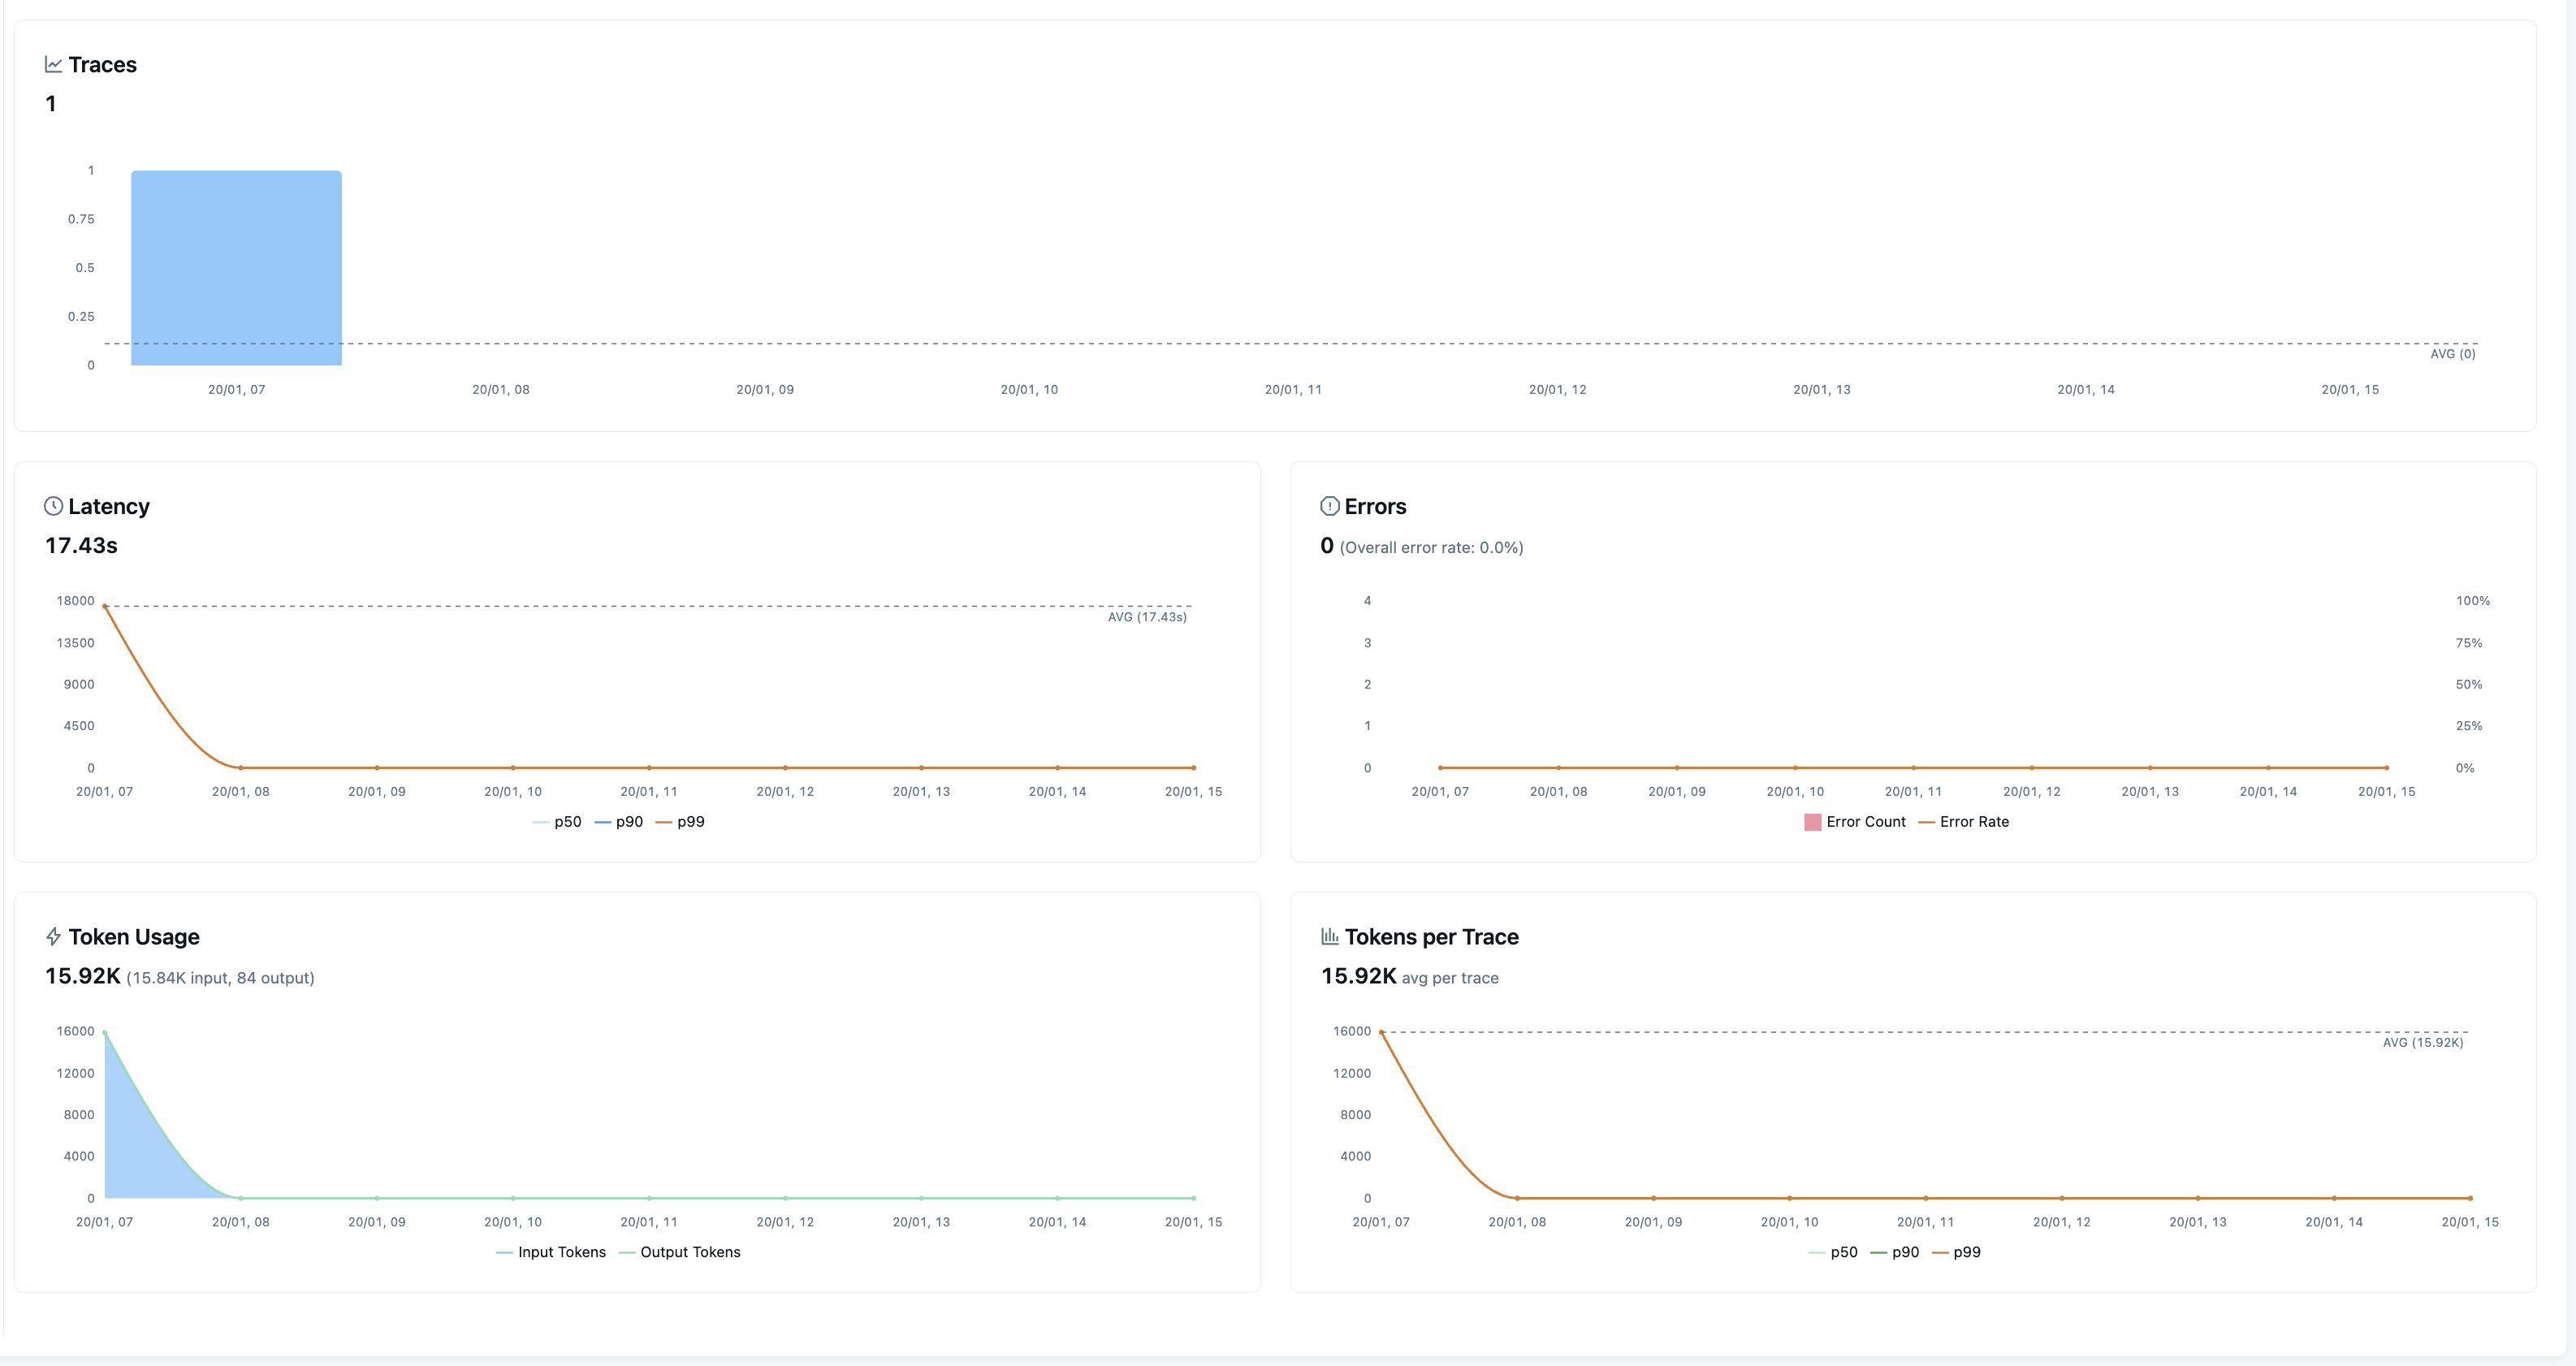
Token Usage
MLflow automatically tracks the token usage for each LLM call within OpenCode conversations. The token usage for each LLM call is logged in the mlflow.chat.tokenUsage attribute. The token usage and cost will be displayed in the Overview dashboard and the trace detail page.
Session and User Tracking
The plugin automatically tracks session and user metadata for each trace:
- Session ID: Each OpenCode session is tagged with
mlflow.trace.session, allowing you to group and filter traces by session. - User: The current system user is tagged with
mlflow.trace.user, making it easy to identify who initiated each conversation.
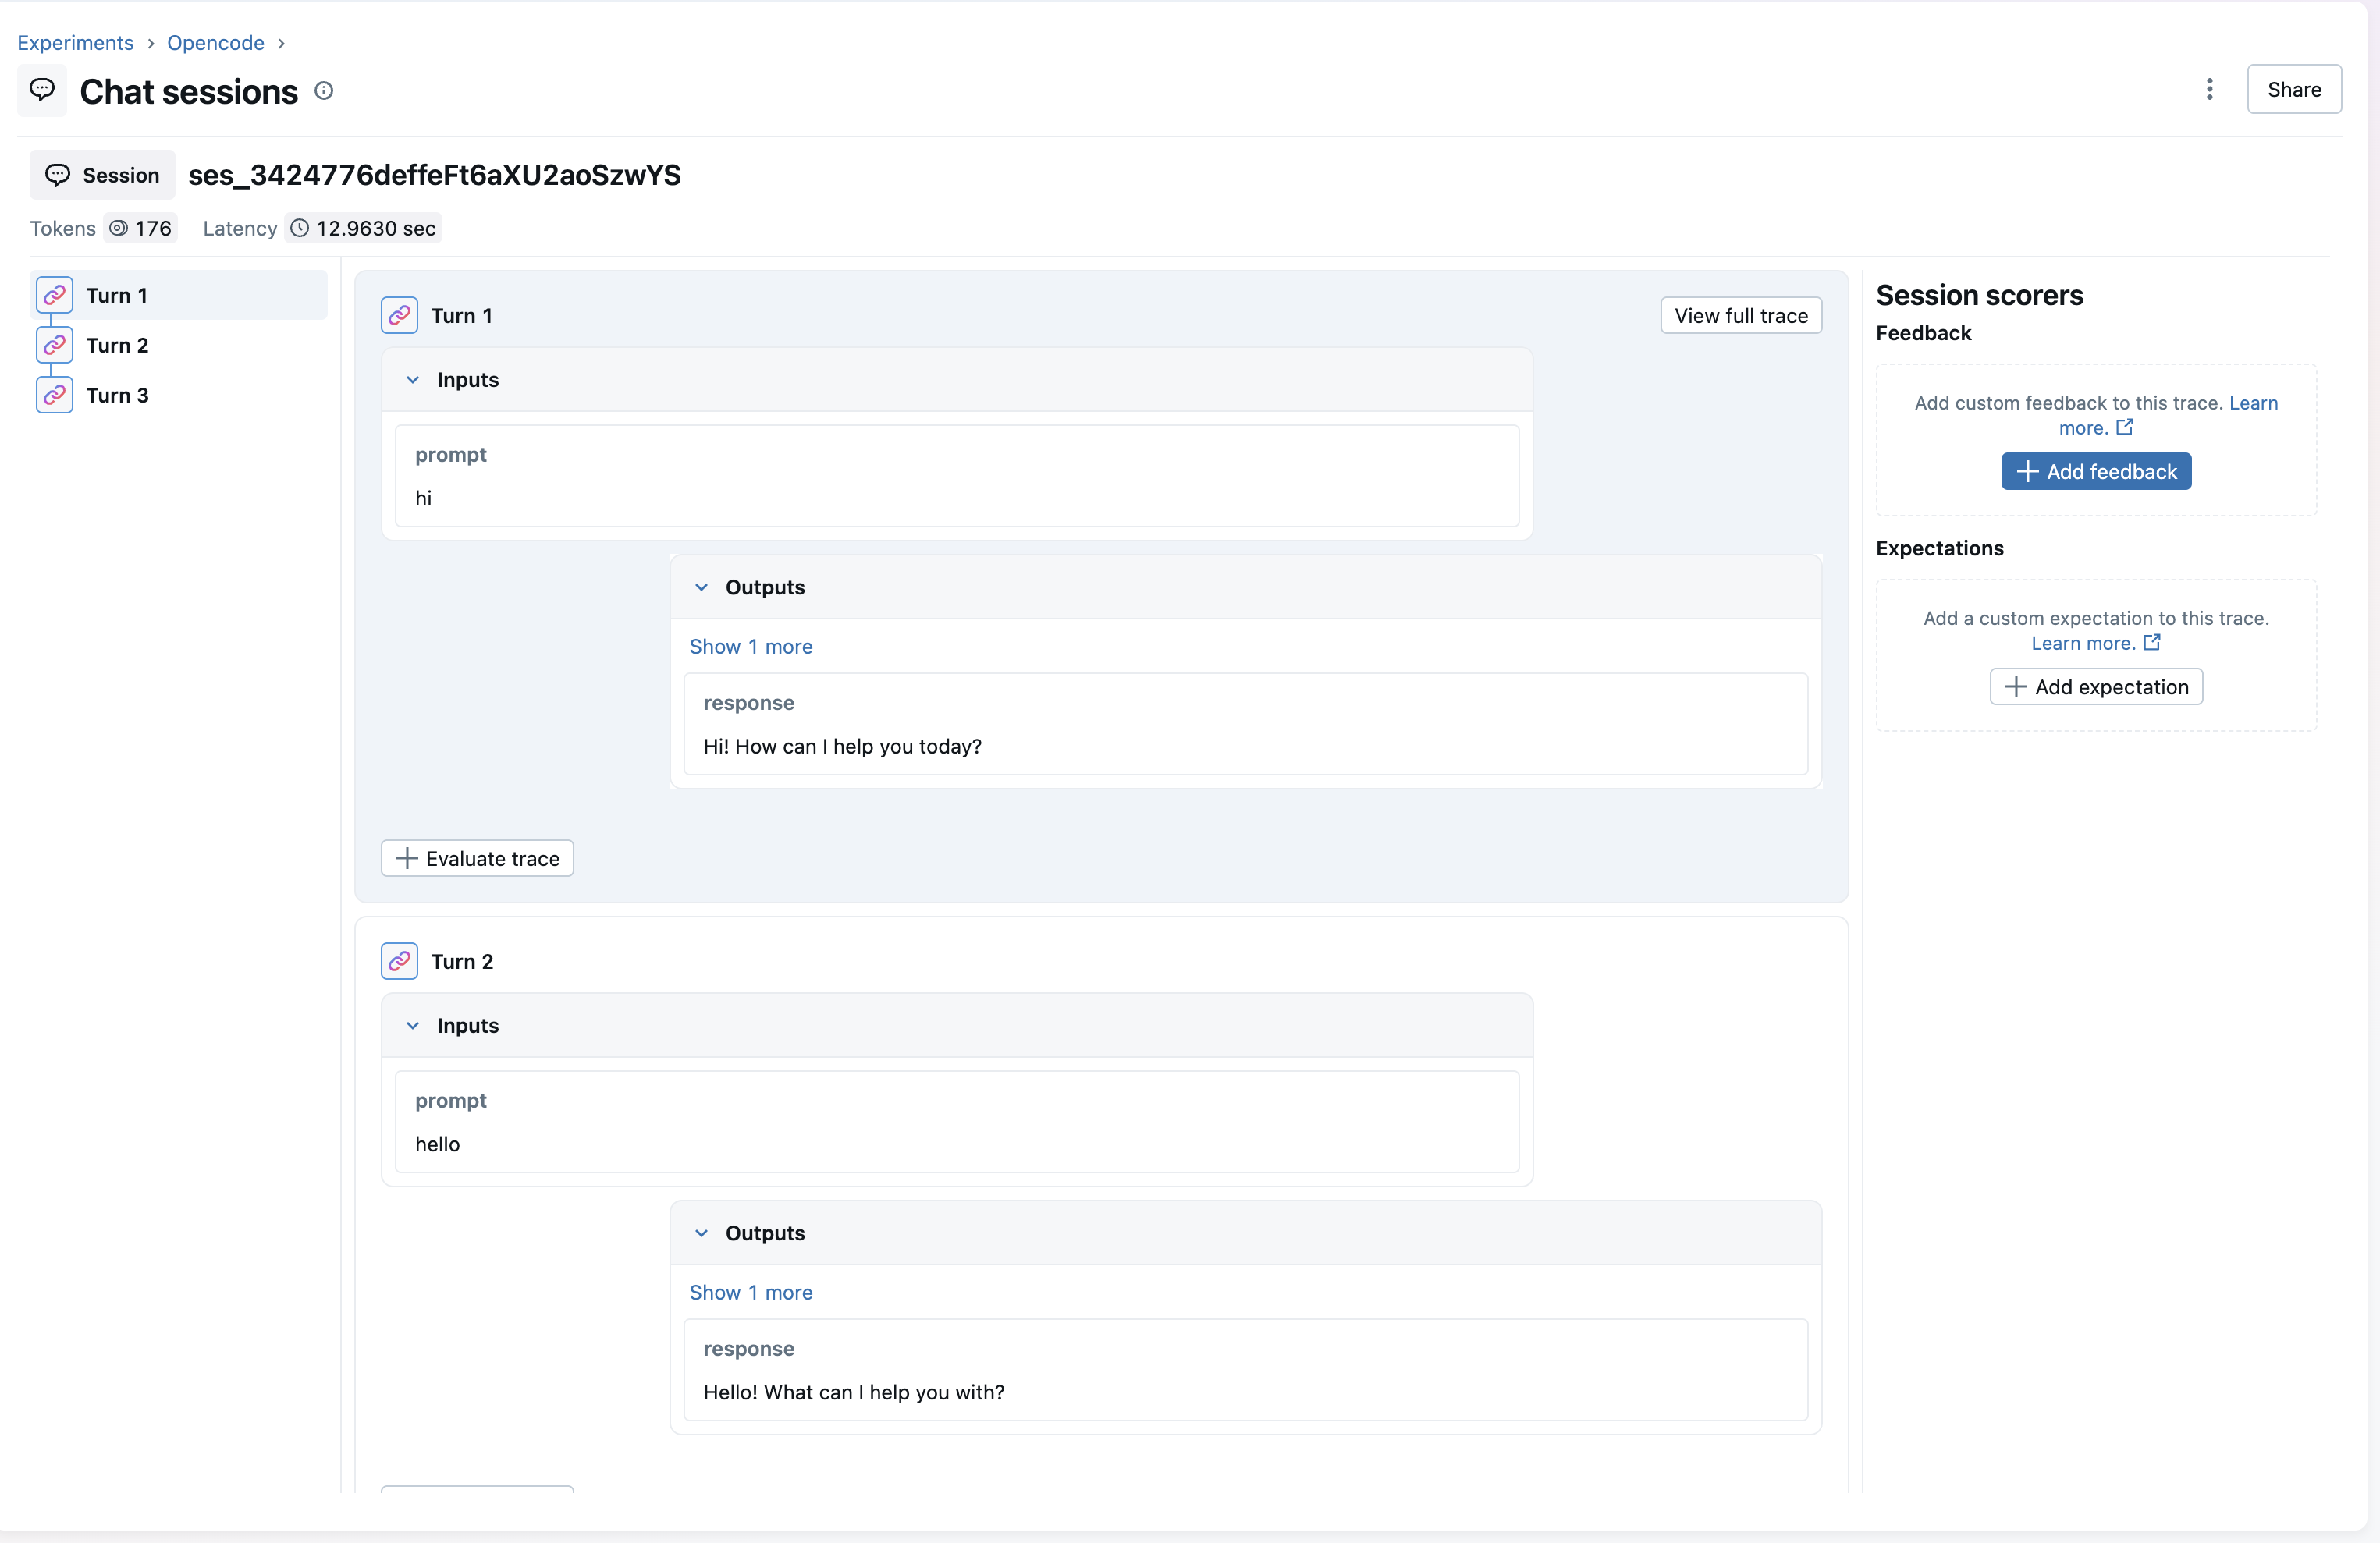
You can use these metadata fields to filter traces in the MLflow UI or via the search API. For more details on session and user tracking, see Track Users and Sessions.
Troubleshooting
Debug Logging
Enable debug logging to see detailed information about trace creation:
export MLFLOW_OPENCODE_DEBUG=true
opencode
Debug output is written to stderr to avoid interfering with OpenCode's TUI.
Common Issues
Traces not appearing:
-
Verify environment variables are set correctly:
bashecho $MLFLOW_TRACKING_URIecho $MLFLOW_EXPERIMENT_ID -
Check that the MLflow server is accessible:
bashcurl $MLFLOW_TRACKING_URI/api/2.0/mlflow/experiments/list -
Enable debug logging to see any errors:
bashexport MLFLOW_OPENCODE_DEBUG=true
Plugin not loading:
-
Verify the plugin is installed:
bashnpm ls @mlflow/opencode -
Check that
opencode.jsoncontains the plugin:json{"plugin": ["@mlflow/opencode"]}
Missing token usage:
Token usage is only available when the LLM provider reports it. Some providers or configurations may not include token counts in their responses.
Disable Tracing
To stop automatic tracing, remove the plugin from your opencode.json:
{
  "plugin": []
}
Or unset the environment variables:
unset MLFLOW_TRACKING_URI
unset MLFLOW_EXPERIMENT_ID
Existing traces are preserved - disabling only stops new traces from being created.