Tracing VoltAgent
MLflow Tracing provides automatic tracing capability for VoltAgent, an open-source TypeScript framework for building AI agents. MLflow supports tracing for VoltAgent through the OpenTelemetry integration.
:::tip What is VoltAgent? VoltAgent is an open-source TypeScript framework that simplifies the development of AI agent applications by providing modular building blocks, standardized patterns, and abstractions. Whether you're creating chatbots, virtual assistants, automated workflows, or complex multi-agent systems, VoltAgent handles the underlying complexity, allowing you to focus on defining your agents' capabilities and logic. :::
Step 1: Create a VoltAgent Project
Create a new VoltAgent project using the VoltAgent CLI:
npm create voltagent-app@latest
cd my-voltagent-app
For comprehensive installation instructions, refer to the VoltAgent documentation.
Step 2: Start the MLflow Tracking Server
Start the MLflow Tracking Server with a SQL-based backend store:
mlflow server --backend-store-uri sqlite:///mlflow.db --port 5000
This example uses SQLite as the backend store. To use other types of SQL databases such as PostgreSQL, MySQL, and MSSQL, change the store URI as described in the backend store documentation. OpenTelemetry ingestion is not supported with file-based backend stores.
Step 3: Install OpenTelemetry Packages
Install the OpenTelemetry SDK and OTLP protobuf exporter:
npm install @opentelemetry/sdk-trace-base @opentelemetry/exporter-trace-otlp-proto dotenv
:::note MLflow Trace Translation MLflow automatically translates VoltAgent's semantic conventions for optimal UI visualization:
- Chat UI: Converts VoltAgent's message format to standard chat format with
roleandcontentfields for rich message display - Token Usage: Extracts token metrics (
usage.prompt_tokens,usage.completion_tokens) and displays them in the trace summary - Span Types: Maps VoltAgent spans (agent, llm, tool, memory) to MLflow span types for proper iconography and filtering :::
Step 4: Configure OpenTelemetry
Open your main application file (e.g., src/index.ts) and add the OpenTelemetry configuration to export traces to MLflow:
import "dotenv/config";
import { VoltAgent, Agent, VoltAgentObservability } from "@voltagent/core";
import { openai } from "@ai-sdk/openai";
import { BatchSpanProcessor } from "@opentelemetry/sdk-trace-base";
import { OTLPTraceExporter } from "@opentelemetry/exporter-trace-otlp-proto";

// Configure the OTLP exporter to send traces to MLflow
const mlflowExporter = new OTLPTraceExporter({
  url: `${process.env.MLFLOW_TRACKING_URI}/v1/traces`,
  headers: { "x-mlflow-experiment-id": process.env.MLFLOW_EXPERIMENT_ID ?? "0" },
});

// Create span processor and observability instance
const mlflowSpanProcessor = new BatchSpanProcessor(mlflowExporter);
const observability = new VoltAgentObservability({
  spanProcessors: [mlflowSpanProcessor],
});

const agent = new Agent({
  name: "my-voltagent-app",
  instructions: "A helpful assistant that answers questions",
  model: openai("gpt-4o-mini"),
});

new VoltAgent({
  agents: { agent },
  observability,
});
Don't forget to add the required environment variables to your .env file:
OPENAI_API_KEY=your-api-key
MLFLOW_TRACKING_URI=http://localhost:5000
MLFLOW_EXPERIMENT_ID=0
Replace the experiment ID with your MLflow experiment ID. You can create an experiment from the MLflow UI.
Step 5: Run Your VoltAgent Application
Start the VoltAgent development server:
npm run dev
Your agent is now running! To interact with it, open the VoltAgent Console at https://console.voltagent.dev and send messages to your agent.
Step 6: View Traces in MLflow
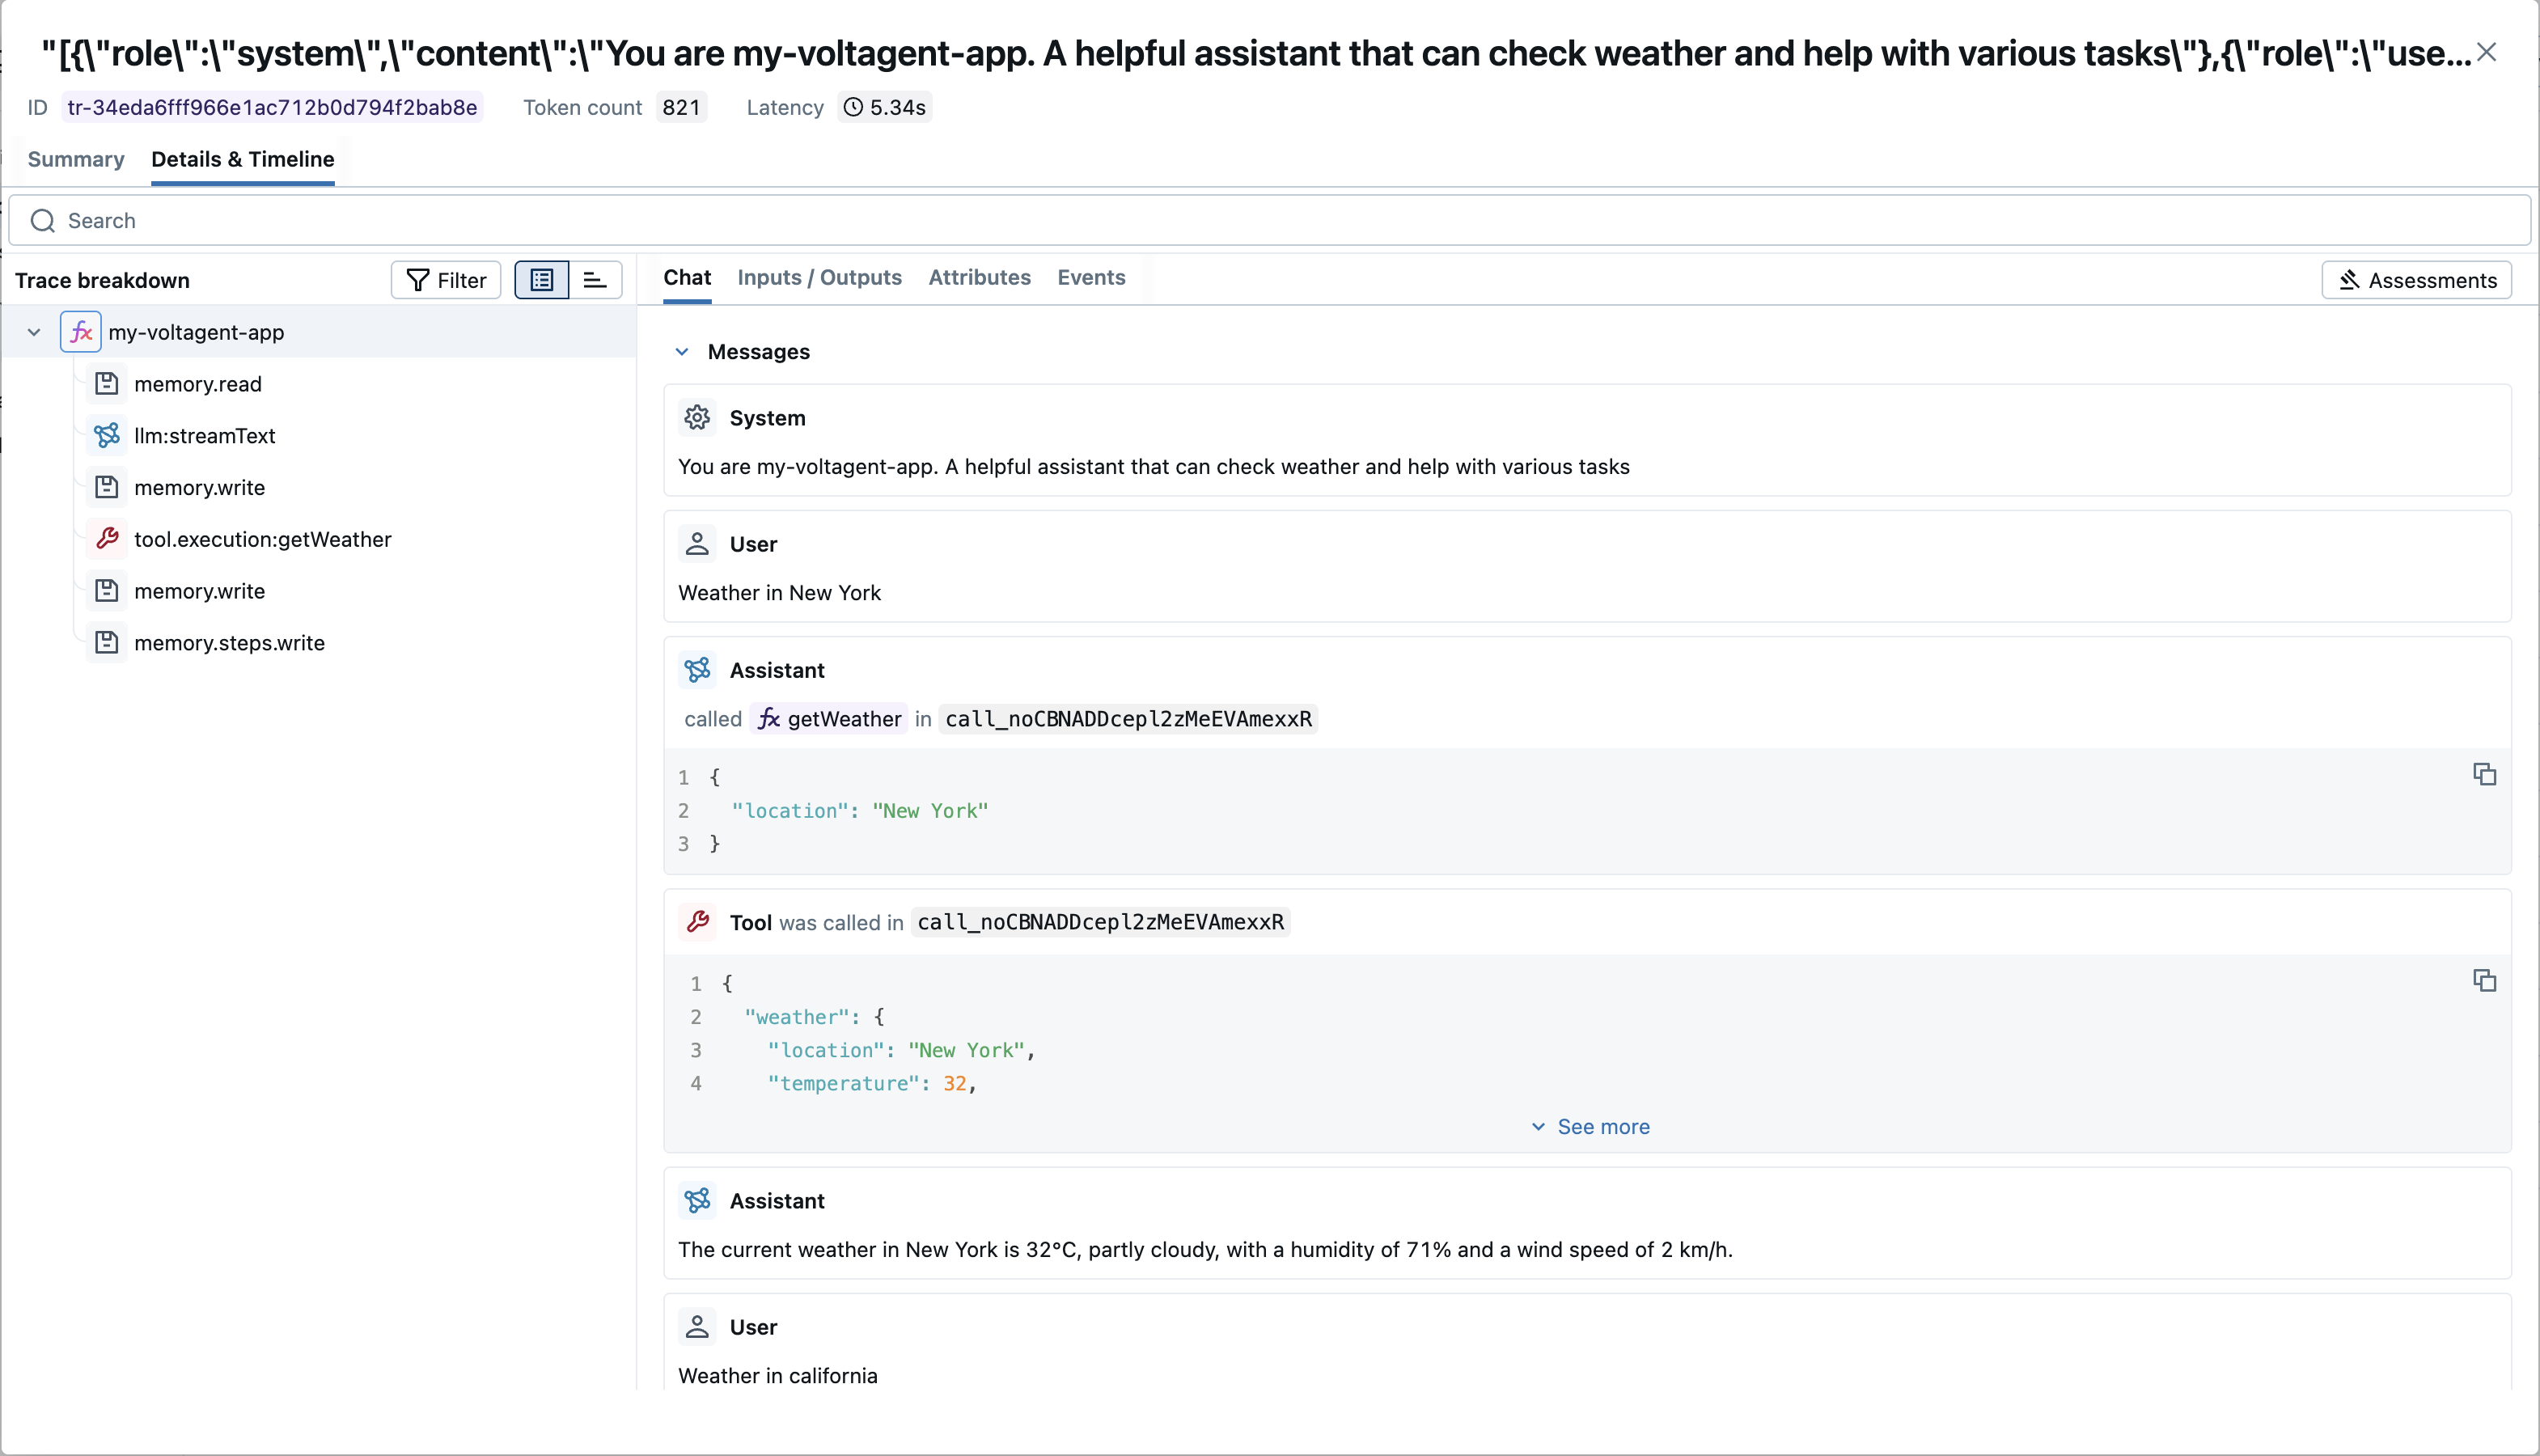
After chatting with your agent, open the MLflow UI at http://localhost:5000 and navigate to your experiment to see the traces.
Combine with the MLflow Tracing SDK
Since this integration is built on OpenTelemetry, you can combine the automatically generated traces with the MLflow Tracing SDK (@mlflow/core) to add custom spans, set tags, and update trace metadata within the same trace.
import { init, withSpan } from "@mlflow/core";

// Initialize MLflow SDK - sets up the OTel provider to capture all spans
init({
  trackingUri: "http://localhost:5000",
  experimentId: "<your-experiment-id>",
});

// Add custom MLflow spans alongside the auto-generated VoltAgent traces
const result = await withSpan(
  { name: "custom_step", inputs: { query: "test" } },
  async (span) => {
    // your application logic here
    return { result: "success" };
  }
);
For detailed instructions and examples, see Combining the OpenTelemetry SDK and the MLflow Tracing SDK.
Next Steps
- Evaluate the Agent: Learn how to evaluate the agent's performance.
- Manage Prompts: Learn how to manage prompts for the agent.
- Automatic Agent Optimization: Learn how to automatically optimize the agent end-to-end with state-of-the-art optimization algorithms.