Dashboard (Overview)
The Overview tab in LLM and AI agent experiments provides comprehensive analytics and visualizations for your LLM application and AI agent traces. This tab is organized into three sub-tabs to help you monitor different aspects of your application.
All tabs include a time range selector and time unit selector to customize the granularity and range of the displayed data.
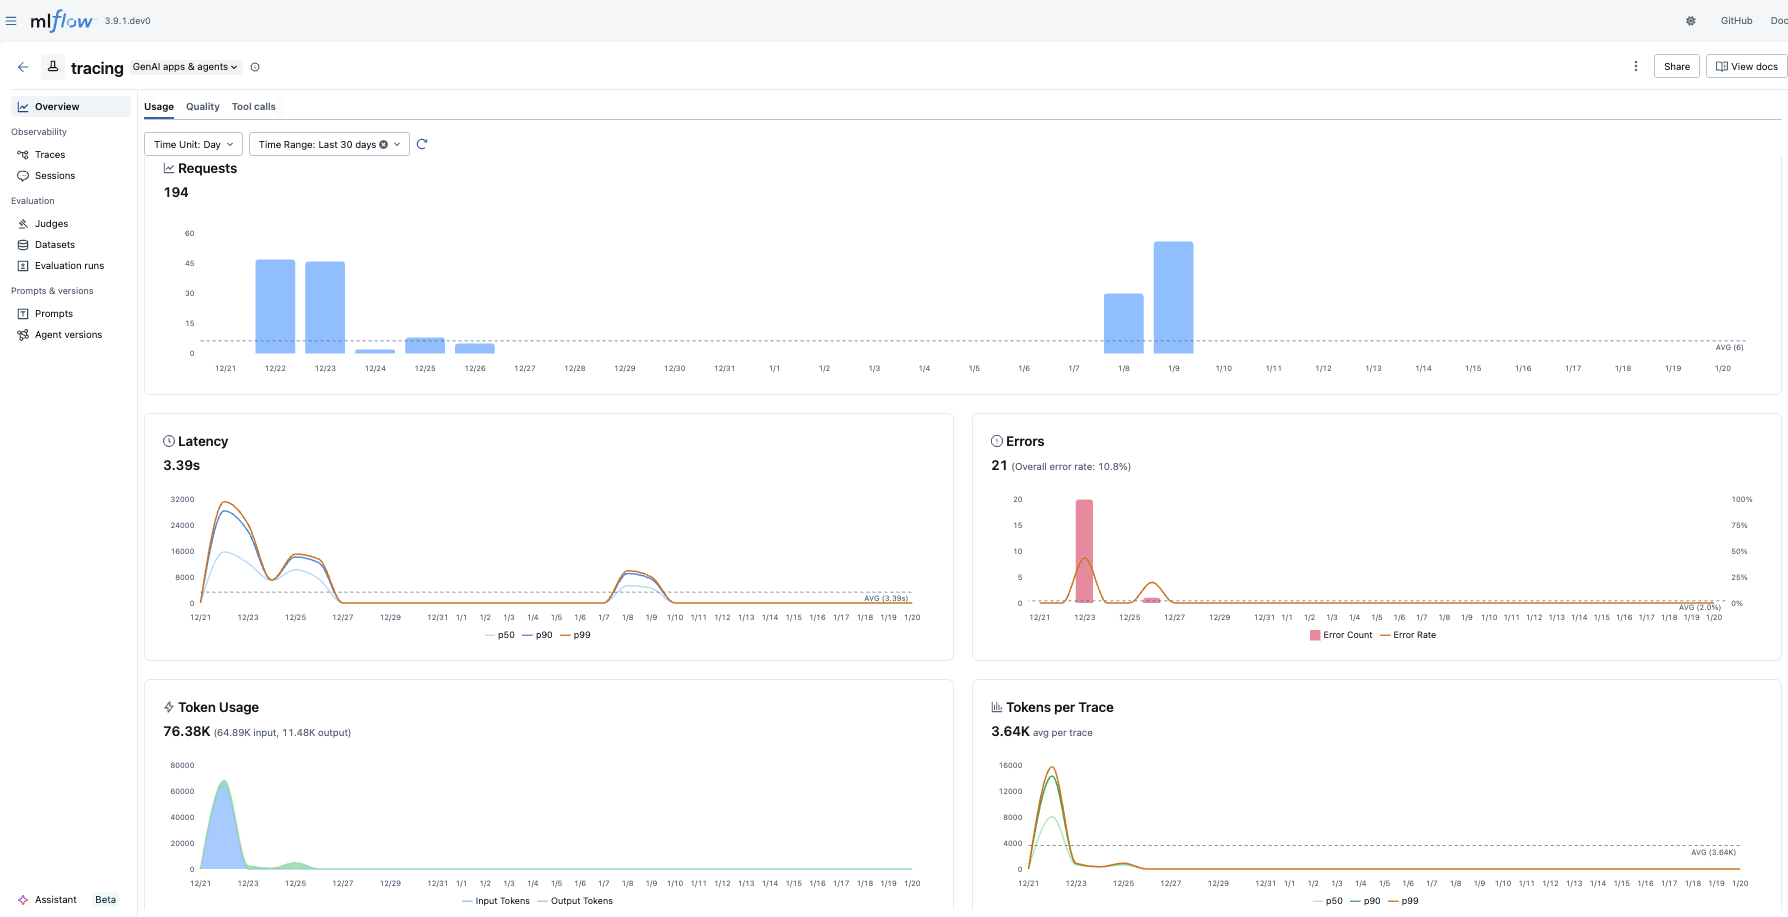
Usage
The Usage tab displays key metrics about your trace requests over time:
- Requests: Shows the total number of trace requests, with an average reference line
- Latency: Visualizes response time distribution to help identify performance bottlenecks
- Errors: Tracks error rates to quickly spot issues
- Token Usage & Token Stats: Monitors token consumption across your traces
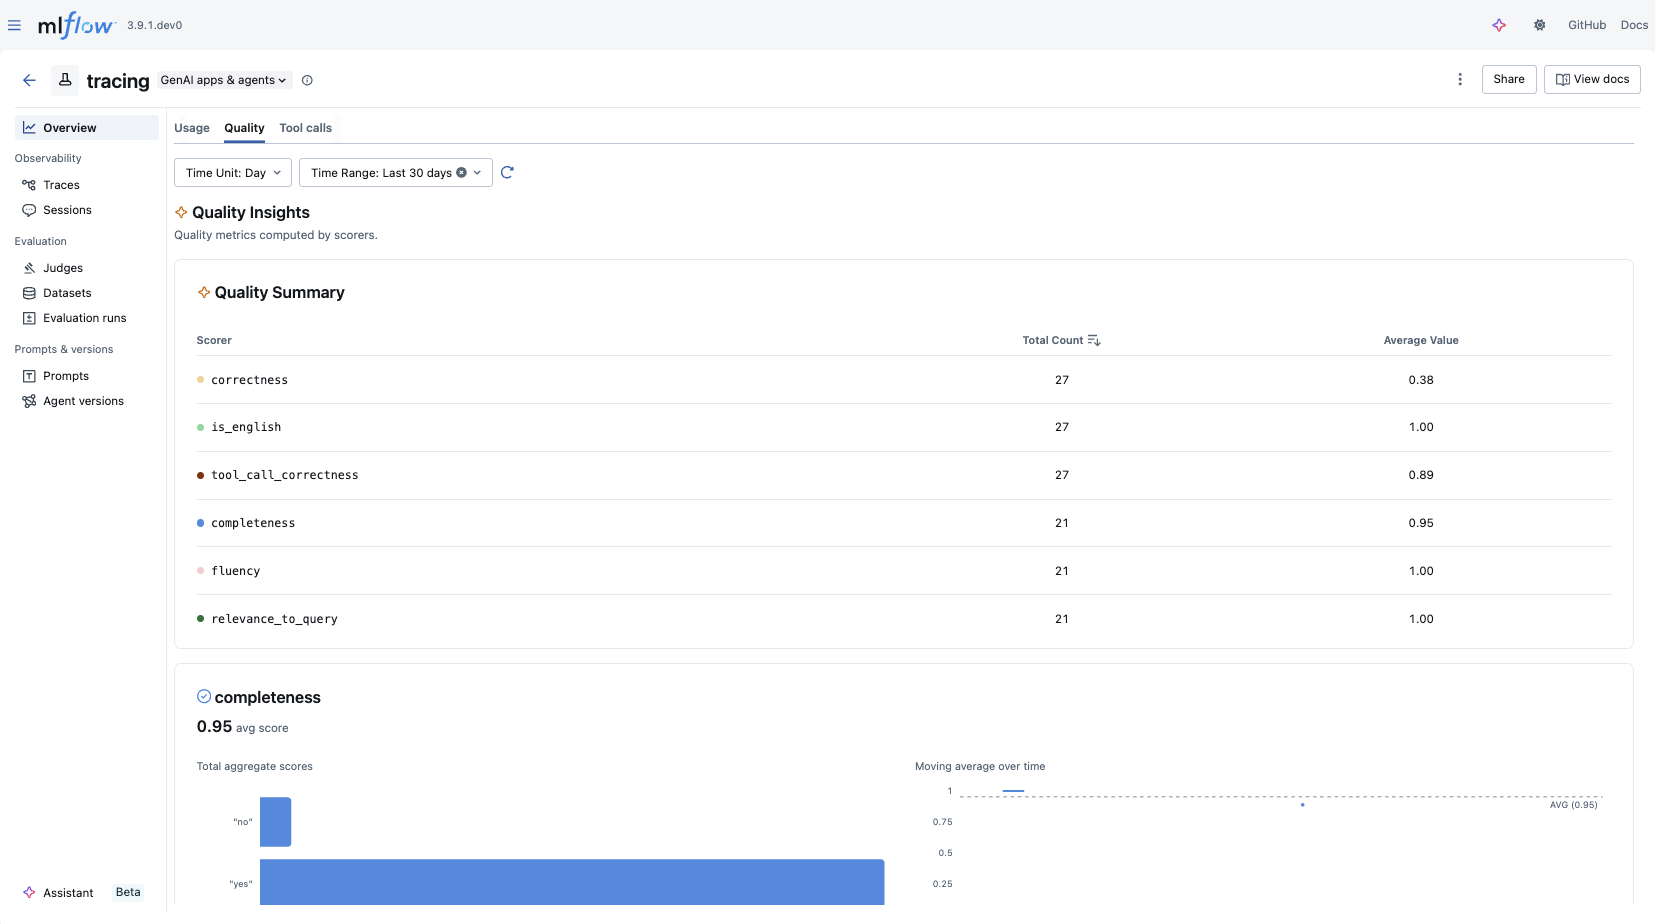
Quality
The Quality tab provides insights into the quality of your LLM and AI agent outputs:
- Quality Summary: Provides an overview of scorer results
- Quality Insights: Displays metrics computed by scorers, with a dedicated chart for each assessment type
- Charts are dynamically generated based on the assessments available in your traces
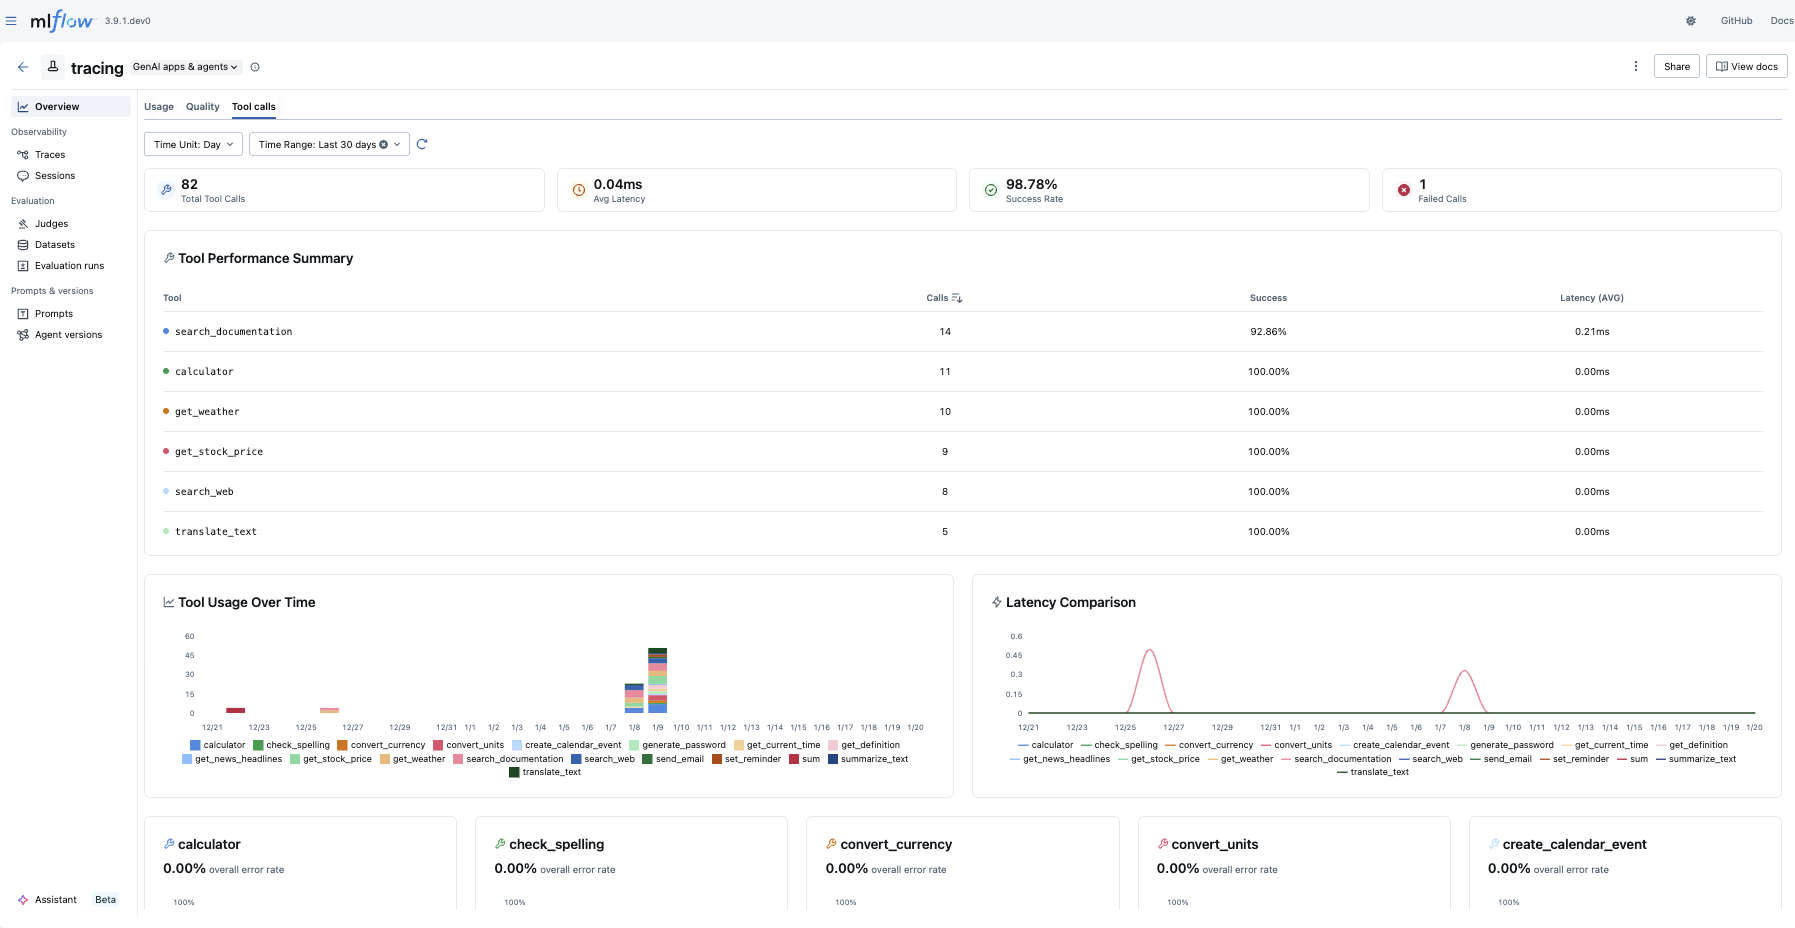
Tool Calls
The Tool Calls tab provides insights into agent tool usage:
- Statistics Cards: Shows at-a-glance metrics including total tool calls, average latency, success rate, and failed calls
- Tool Performance Summary: Provides an overview of how each tool is performing
- Tool Usage & Latency: Visualizes tool invocation patterns and response times
- Tool Error Rate: Tracks error rates per tool
Troubleshooting
Why is my dashboard empty?
The dashboard requires traces to be logged to your experiment before any data appears. To get started:
- Follow the Tracing Quickstart to log your first traces.
- You can also explore the dashboard with the MLflow Tracing demo to see it in action with sample data.
Charts are not rendered
The dashboard requires a SQL-backed tracking store (SQLite, PostgreSQL, or MySQL). If you are using the default file-based store, the dashboard charts will not render.
To fix this, migrate to a SQL-backed store:
# Migrate existing data from file store to SQLite
mlflow migrate-filestore --source /path/to/mlruns --target sqlite:///path/to/mlflow.db

# Start the server with the SQL backend
mlflow server --backend-store-uri sqlite:///path/to/mlflow.db
For more details, see the migration guide.