View Traces
After logging your traces, you can view them in the MLflow UI, under the "Traces" page in your experiment. The page is for browsing the list of traces with rich search and filtering capabilities, as well as inspecting the details of each trace.
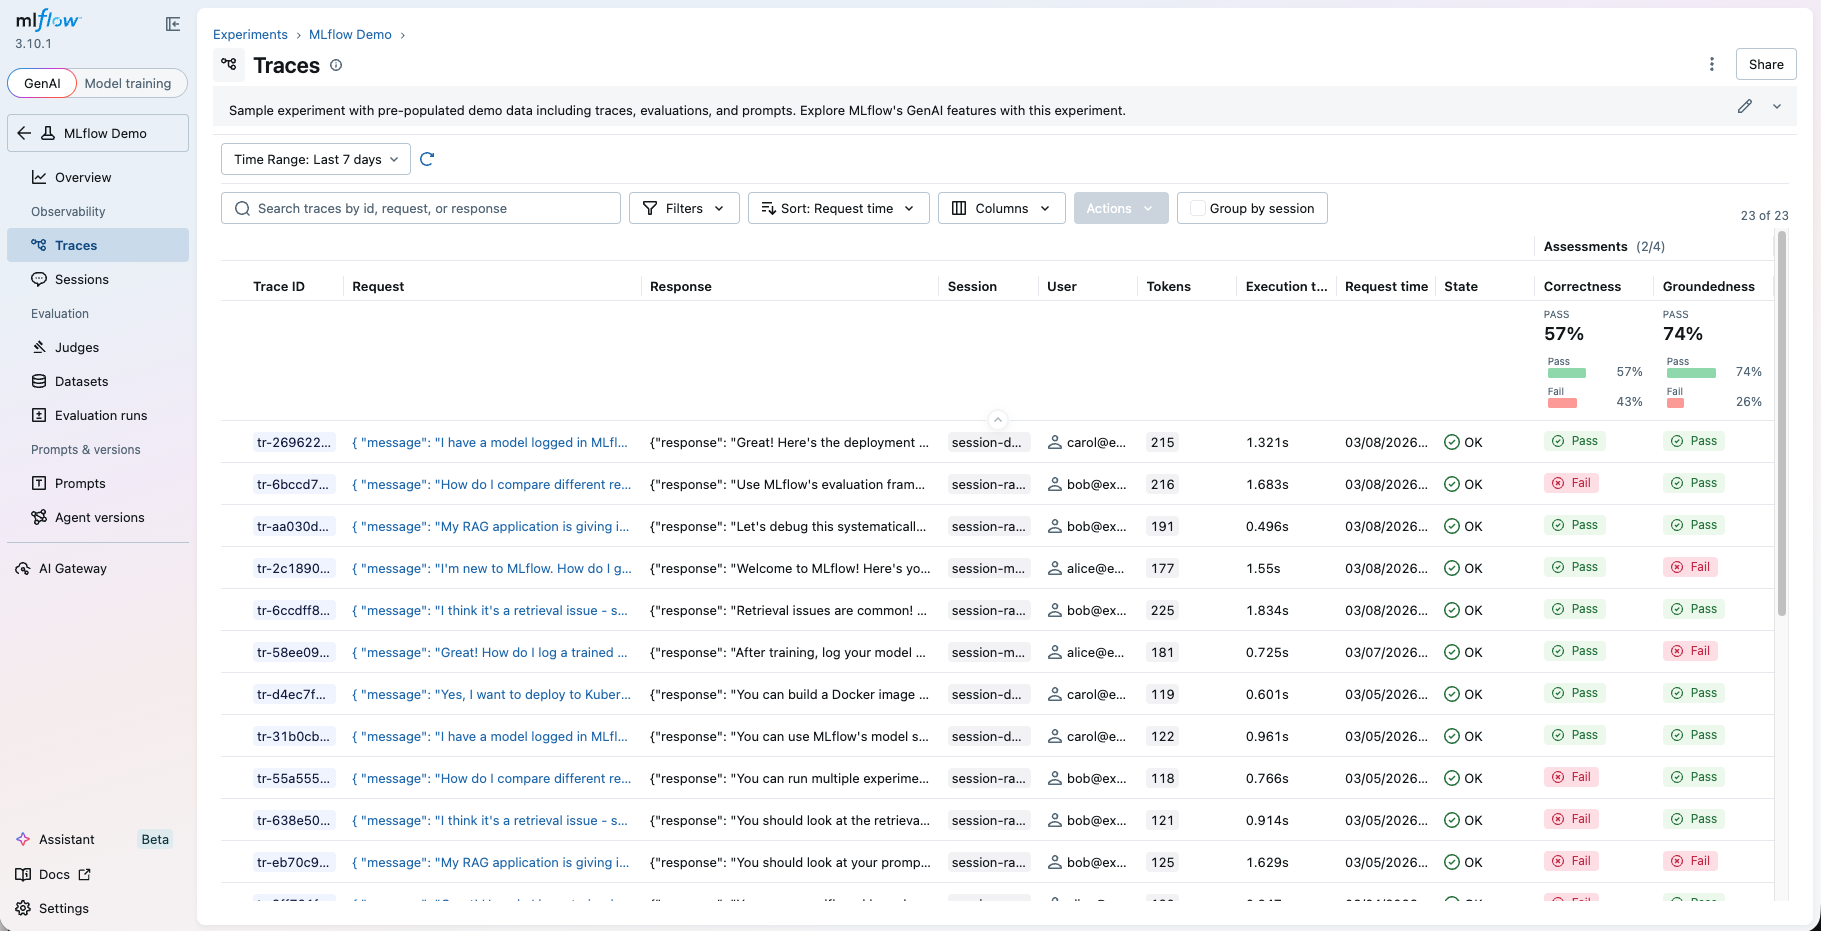
Trace Table
The trace table you see first when you open the "Traces" page includes high-level information about the traces, such as the trace ID, the inputs / outputs of the root span, and more. The table displays the following columns.
Trace table does not display all fields by default. Some columns are hidden by default and can be enabled via the column selector.
| Column | Description | Data Source |
|---|---|---|
| Trace ID | Unique identifier | Trace trace_id field |
| Request | Input to the root span | Derived from the root span's mlflow.spanInputs attribute, or customized via the request_preview parameter of the mlflow.update_current_trace() API |
| Response | Output of the root span | Derived from the root span's mlflow.spanOutputs attribute, or customized via the response_preview parameter of the mlflow.update_current_trace() API |
| Session | Conversation/session grouper | mlflow.trace.session metadata. See Track Users and Sessions for how to set this. |
| User | Application user who triggered the trace | mlflow.trace.user metadata. See Track Users and Sessions for how to set this. |
| Trace name | Name of the trace | Derived from the root span's name, or customized through the mlflow.traceName tag |
| Tokens | Aggregated input/output/total tokens | mlflow.trace.tokenUsage metadata. See Token Usage and Cost Tracking for more details. |
| Execution time | Total trace duration | Computed at runtime. |
| Request time | When the trace was created | Computed at runtime. |
| State | OK, ERROR, or IN_PROGRESS | Derived from the root span's execution status. |
| Run name | Associated MLflow run | If the trace was logged within an MLflow run context, the run name is automatically displayed here. |
| Prompt | Linked prompt versions | If a prompt in MLflow Prompt Registry is loaded during the trace scope, the prompt name and version are displayed here. See Linking Prompts with Traces for more details. |
| Source | The entry point or script that generated the trace. If it is from a Git repository, the field links to the repository URL with the commit hash and file path. | Derived from Git metadata at runtime if available. |
| Tags | User-defined key-value pairs | Trace tags (excluding mlflow.* system keys) if set. |
| Assessments | Feedback scores logged to the trace, either by a human or an automated evaluation. | See Collecting User Feedback and Evaluating Traces for how to log assessments. |
| Expectations | Ground truth values annotated to the trace. | See Ground Truth Expectations for how to log expectations. |
Traces ingested through the OTLP endpoint go through automatic attribute translation to derive these columns from framework-specific OpenTelemetry attributes. MLflow supports translation for OpenTelemetry GenAI Semantic Conventions, and various frameworks including OpenLLMetry, OpenInference, Langfuse, and more. Please see the Attribute Mapping Reference for details on how each framework's attributes are mapped to these columns.
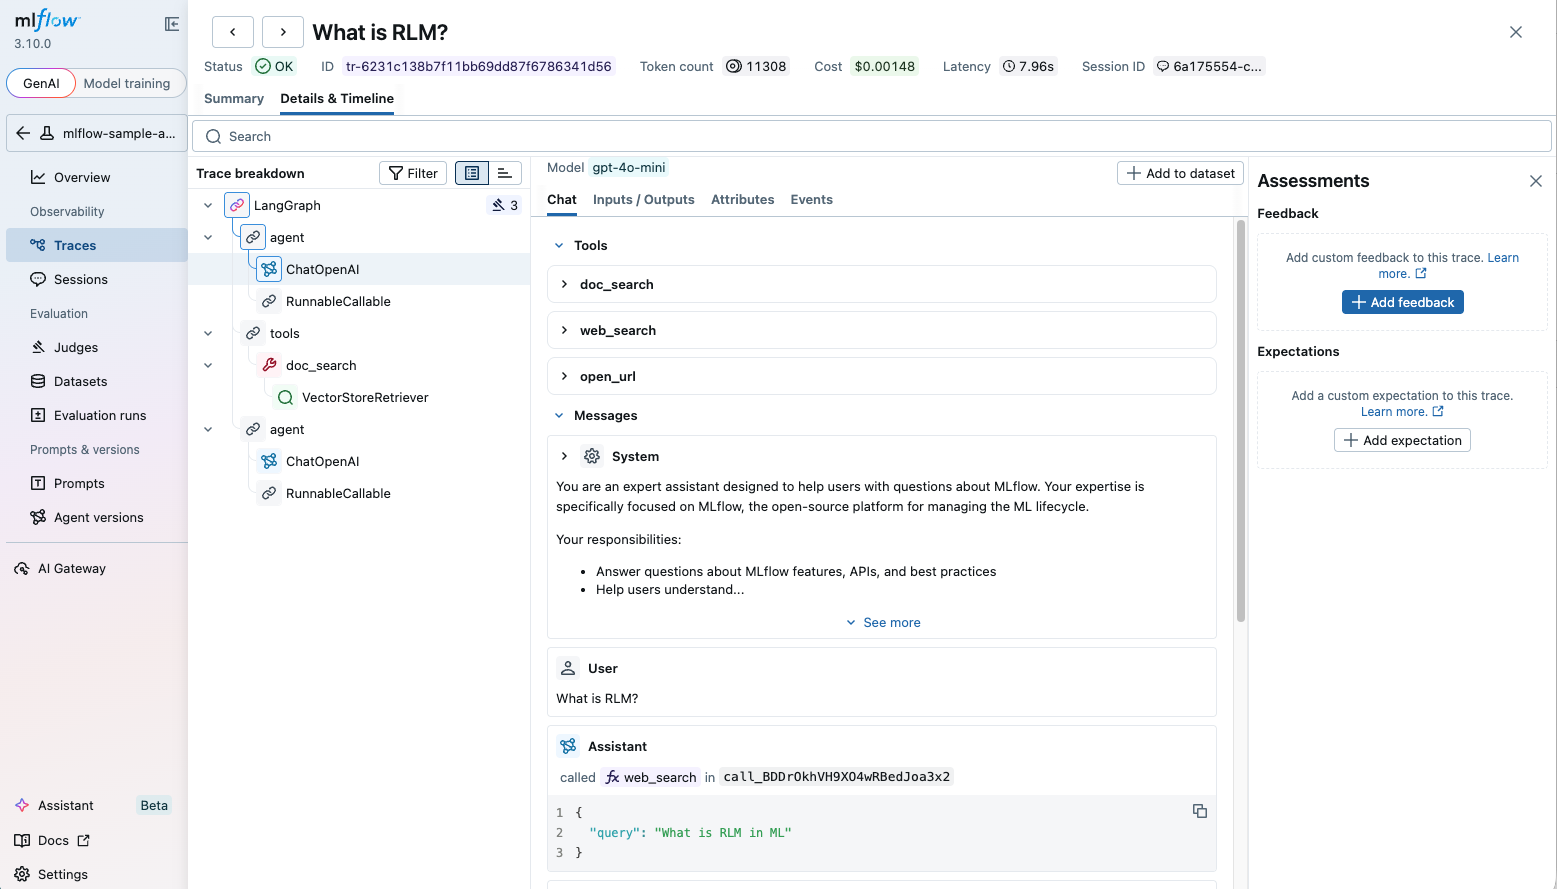
Browsing Single Trace
By clicking on a trace ID tr-... or the request link in the trace table, you can open the detailed trace view. The detailed trace view contains rich information about your AI agent or LLM application execution, such as:
- The span tree that represents the execution flow of the trace.
- Latency of each span and the overall timeline.
- Input and output of each span.
- Tool definitions and calls.
- Exception details if the execution failed.
- Token counts and cost breakdown.
- Feedback scores and ground truth annotated on the trace.
MLflow renders images and audio inline in the trace viewer. For supported formats, framework examples, and how to attach multimodal content to traces, see Image and Audio (Multimodal) Content in Traces.
Performing Actions
From this page, you can also perform a few actions to manage your traces.
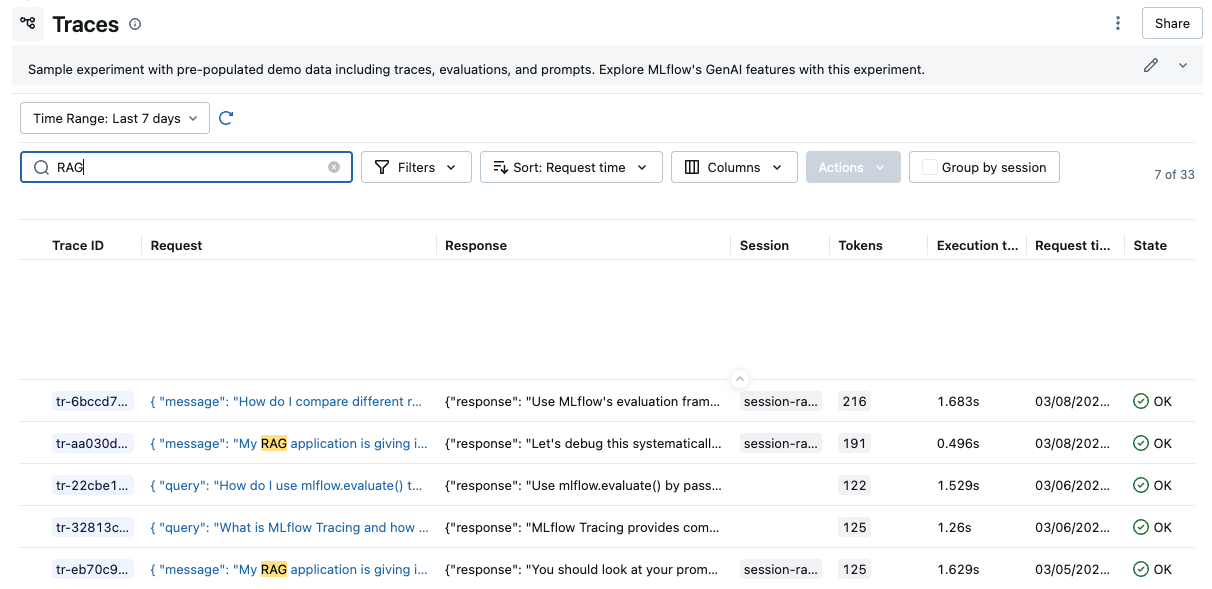
Searching Traces
Using the search bar in the UI, you can easily filter your traces based on name, tags, or other metadata. Check out the Searching Traces for details about the query string format.
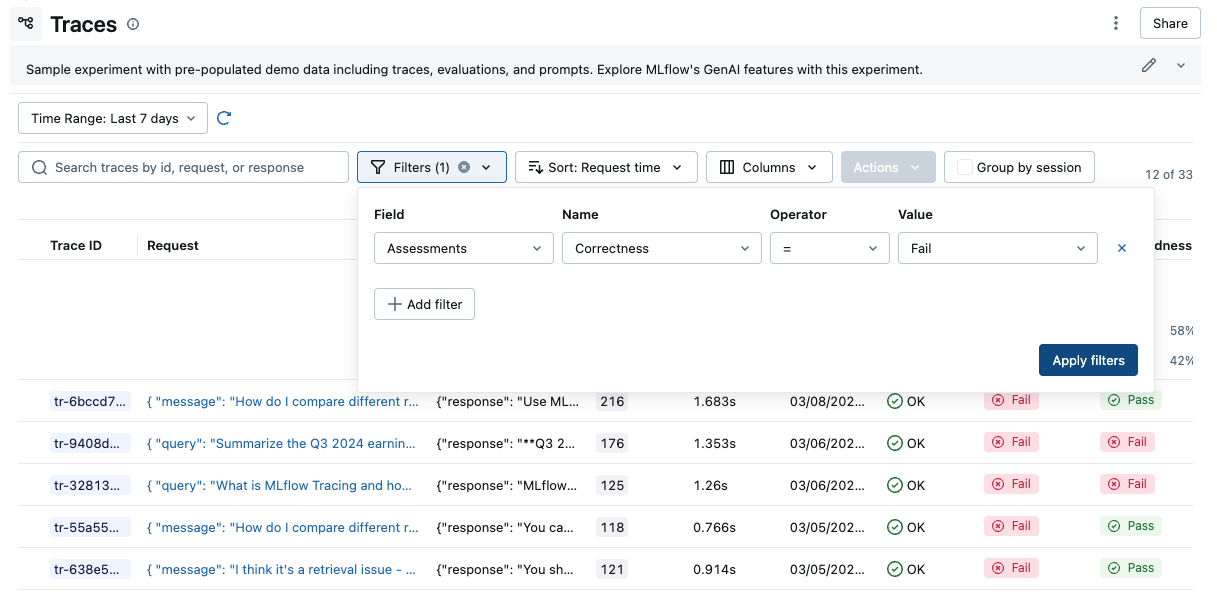
Filtering Traces
The filter dropdown allows you to filter the traces table by various criteria, such as state, name, user, session, tags, feedback values, and more. See Filtering Traces for details.
Deleting Traces
The UI supports bulk deletion of traces. Simply select the traces you want to delete by checking the checkboxes, and then pressing the "Delete" button. See Delete Traces for how to delete traces programmatically.
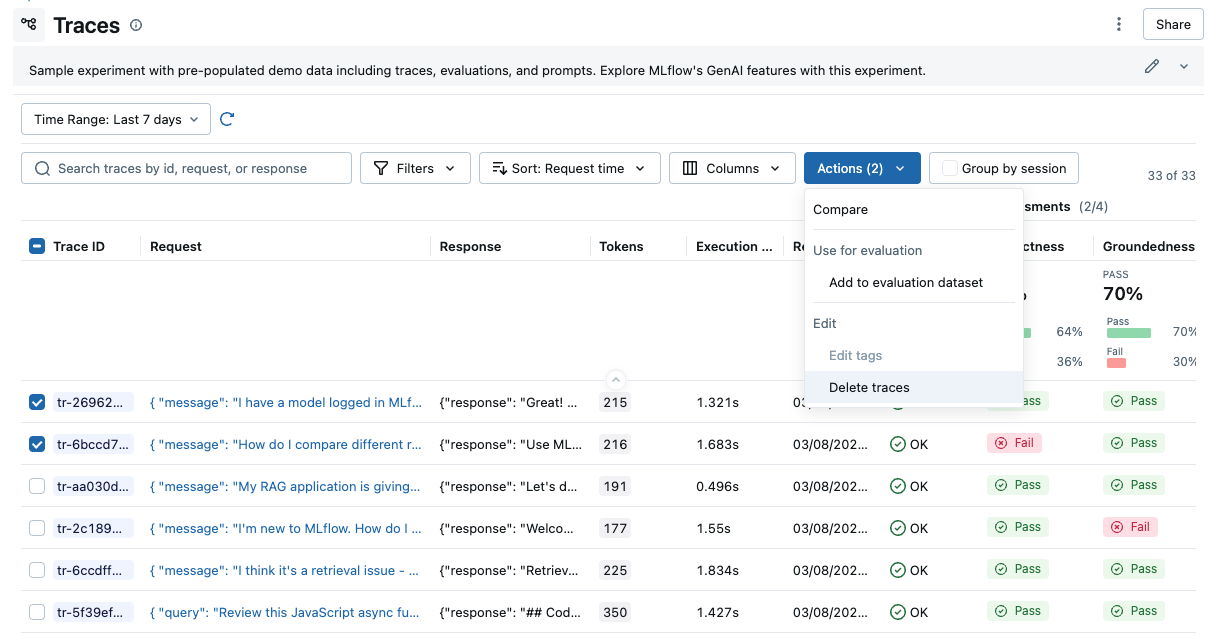
Shift+click to select all traces in a range quickly.
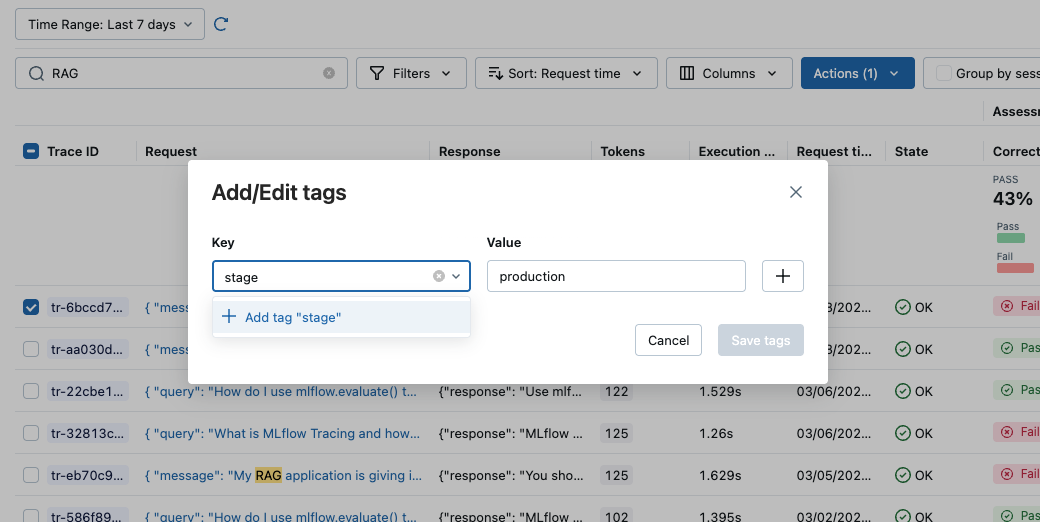
Editing Tags
You can also edit key-value tags on your traces via the UI. See Trace Tags for more details about trace tags.
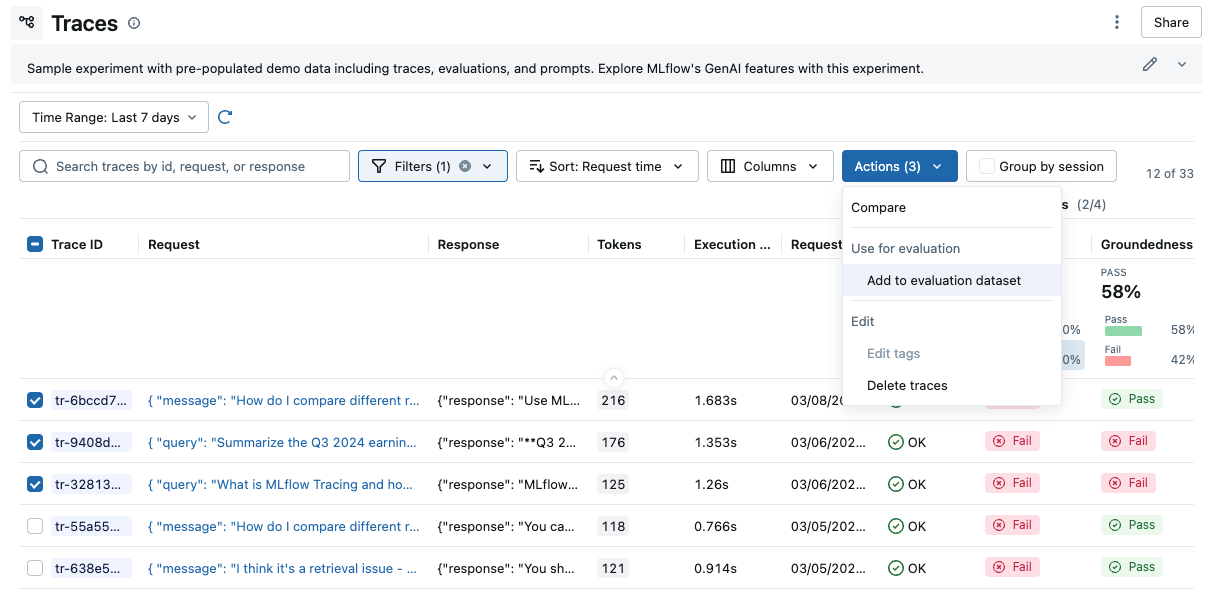
Exporting Traces to Datasets
You can export the traces to Evaluation Datasets by clicking the "Add to evaluation dataset" action from the actions dropdown.
Jupyter Notebook integration
The MLflow Tracing Jupyter integration is available in MLflow 2.20 and above
You can also view the trace UI directly within Jupyter notebooks, allowing you to debug your applications without having to tab out of your development environment.

This feature requires using an MLflow Tracking Server, as
this is where the UI assets are fetched from. To get started, simply ensure that the MLflow
Tracking URI is set to your tracking server (e.g. mlflow.set_tracking_uri("http://localhost:5000")).
By default, the trace UI will automatically be displayed for the following events:
- When the cell code generates a trace (e.g. via automatic tracing, or by running a manually traced function)
- When
mlflow.search_traces()is called - When a
mlflow.entities.Trace()object is displayed (e.g. via IPython'sdisplayfunction, or when it is the last value returned in a cell)
To disable the display, simply call mlflow.tracing.disable_notebook_display(), and rerun the cell
containing the UI. To enable it again, call mlflow.tracing.enable_notebook_display().