MLflow 3.13.0 Highlights: Role-Based Access Control, Trace Archival, Coding Agents, and Hermes Agent Support

MLflow 3.13.0 is a major release for running AI observability at scale, focused on access control, the lifecycle of your trace data, and richer support for agents. Highlights include a full Role-Based Access Control system with a new Admin UI, automatic trace archival, one-click onboarding for coding agents, new engines for MLflow Assistant, span log levels, an official Helm chart for Kubernetes, and Hermes Agent support.
1. Role-Based Access Control and Admin UI
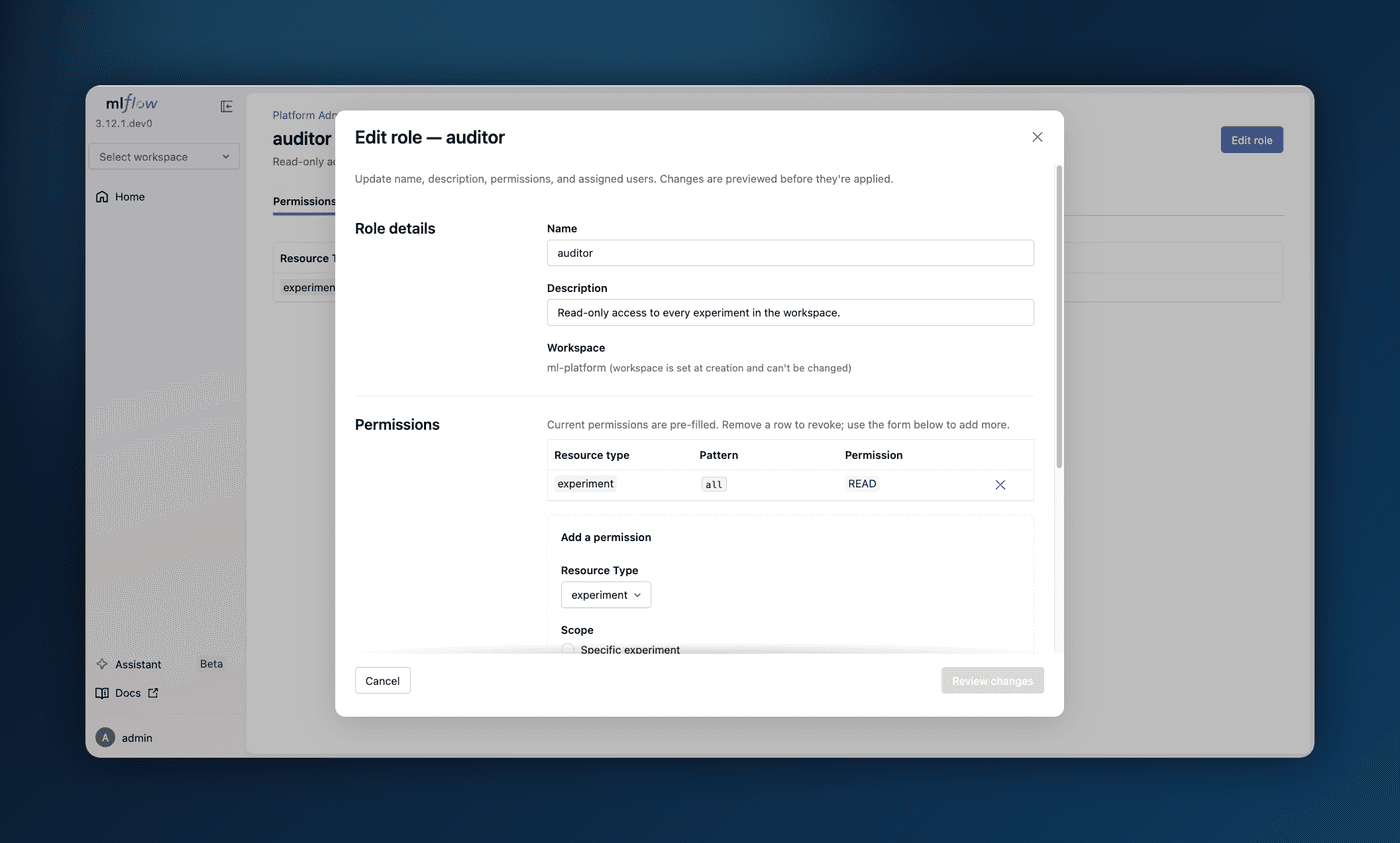
Sharing a self-hosted MLflow server across a team used to mean granting permissions one resource at a time, with no central place to manage them. A new Role-Based Access Control (RBAC) system replaces that: define roles as reusable bundles of permissions, assign them to users, and let workspace-level grants express both membership and admin authority. A user's effective access is the union of their roles, and experiments, models, prompts, scorers, and AI Gateway endpoints are all covered.
A new web Admin UI makes this manageable without touching REST endpoints, with a self-service /account page for viewing your roles and changing your password, and Platform Admin pages for managing users, roles, and grants. Just start mlflow server with authentication enabled.
Learn more about Role-Based Access Control
2. Trace Retention and Auto Archival
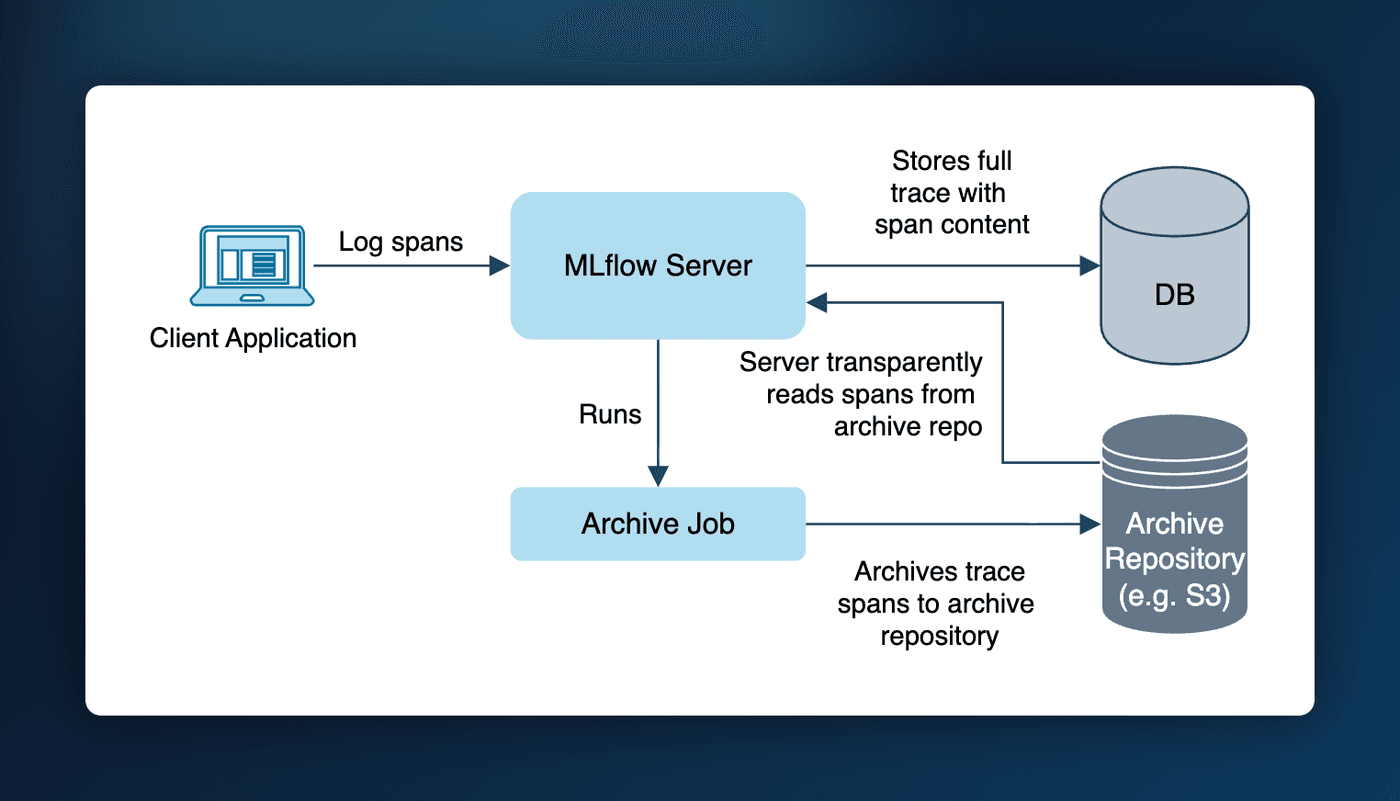
On a long-running tracking server, trace span data piles up in your SQL backend and eventually slows it down. Trace archival keeps it in check: a background pass automatically moves traces older than your retention window out of SQL and into cheap object storage such as S3, while keeping every trace fully readable in the UI and through the APIs. Retention is policy-driven, resolving from server to workspace to experiment.
Enable it by pointing the server at a YAML config:
trace_archival:
  enabled: true
  location: s3://my-bucket/trace-archive
  retention: 7d
  interval_seconds: 60
Workspace managers and experiment owners can then tighten retention from the UI or CLI, and the effective cutoff shows up as an "Archive after" badge on each trace.
Learn more about Trace Archival
3. One-Click Observability and Governance for Coding Agents
Putting a coding agent like Claude Code, OpenAI Codex, or Gemini CLI under observability and governance used to require wiring up a gateway endpoint by hand. The AI Gateway QuickStart now does it in one click: pick your agent and MLflow provisions a pre-configured endpoint (no API key needed, since the agent brings its own credentials) and hands you a ready-to-paste starter snippet. From then on, every request the agent makes is captured as a trace and subject to usage tracking, budgets, and guardrails.
export ANTHROPIC_BASE_URL="http://localhost:5000/gateway/proxy/my-claude-endpoint" && claude
Learn more about coding agents in the AI Gateway
4. New Engines for MLflow Assistant
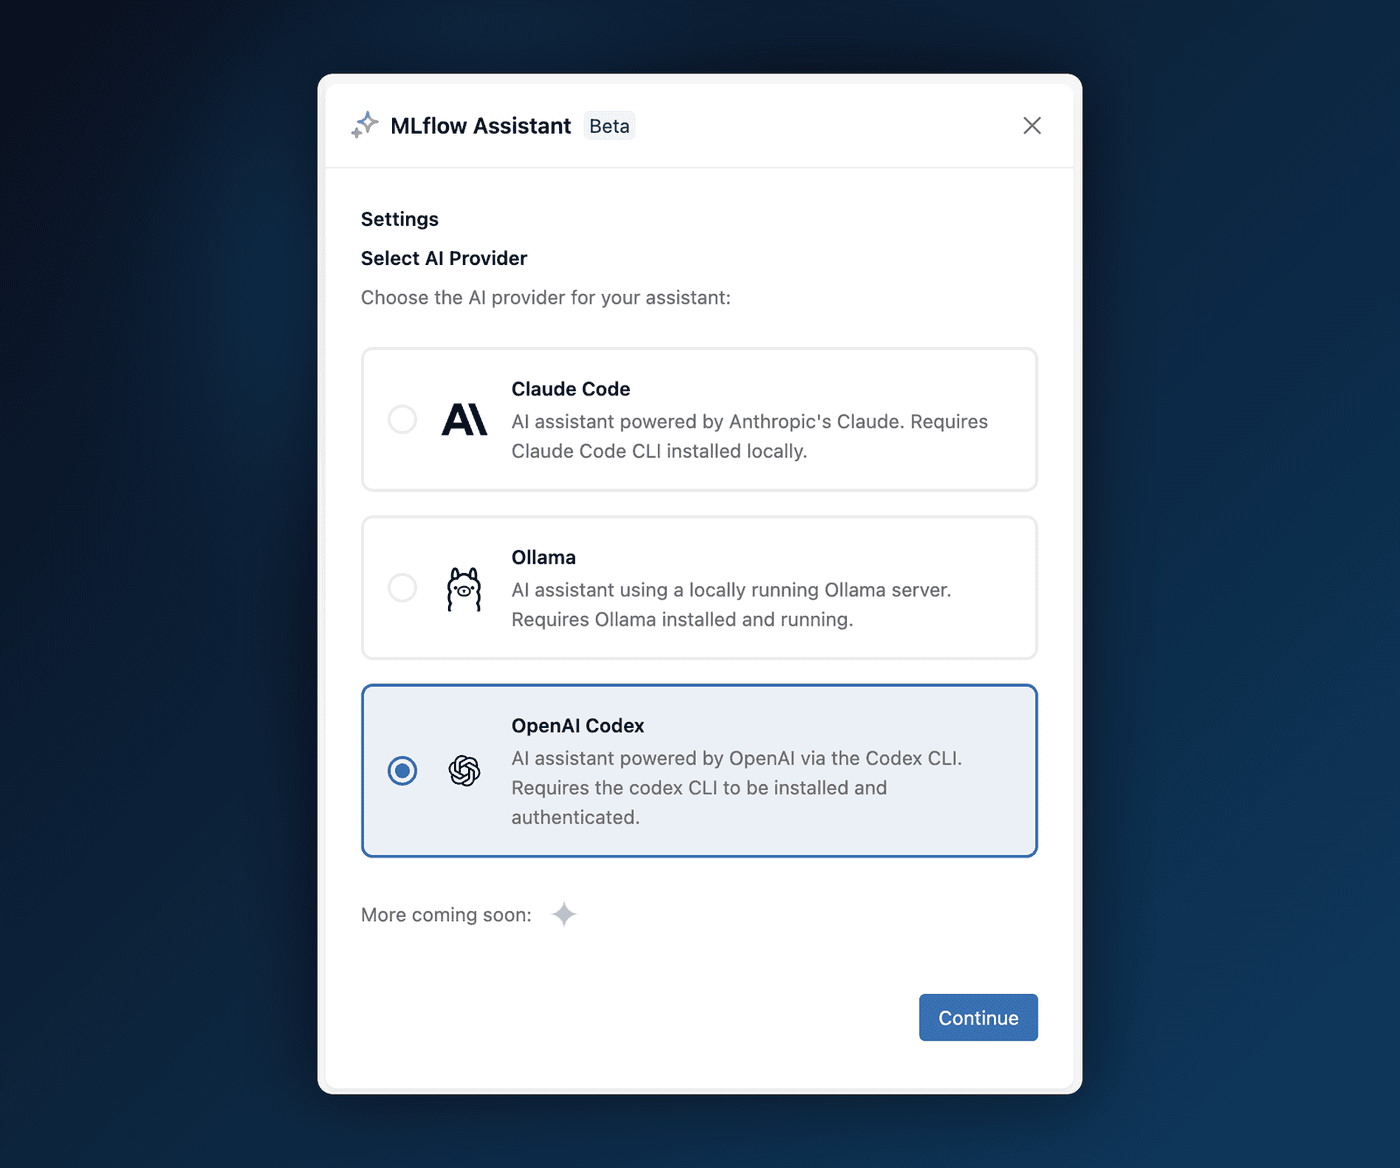
MLflow Assistant launched in 3.9.0 tied to Claude Code. You can now choose the engine that powers it: run the Assistant on a local Ollama model, the OpenAI Codex CLI, or any MLflow AI Gateway endpoint, all selectable from the setup wizard. That means you can keep everything on your own machine with Ollama, or reuse a provider you already route through the Gateway.
Thanks to community contributor @SuperSonnix71 for contributing the Ollama and OpenAI Codex engines!
Learn more about MLflow Assistant
5. Helm Chart for Kubernetes Deployment
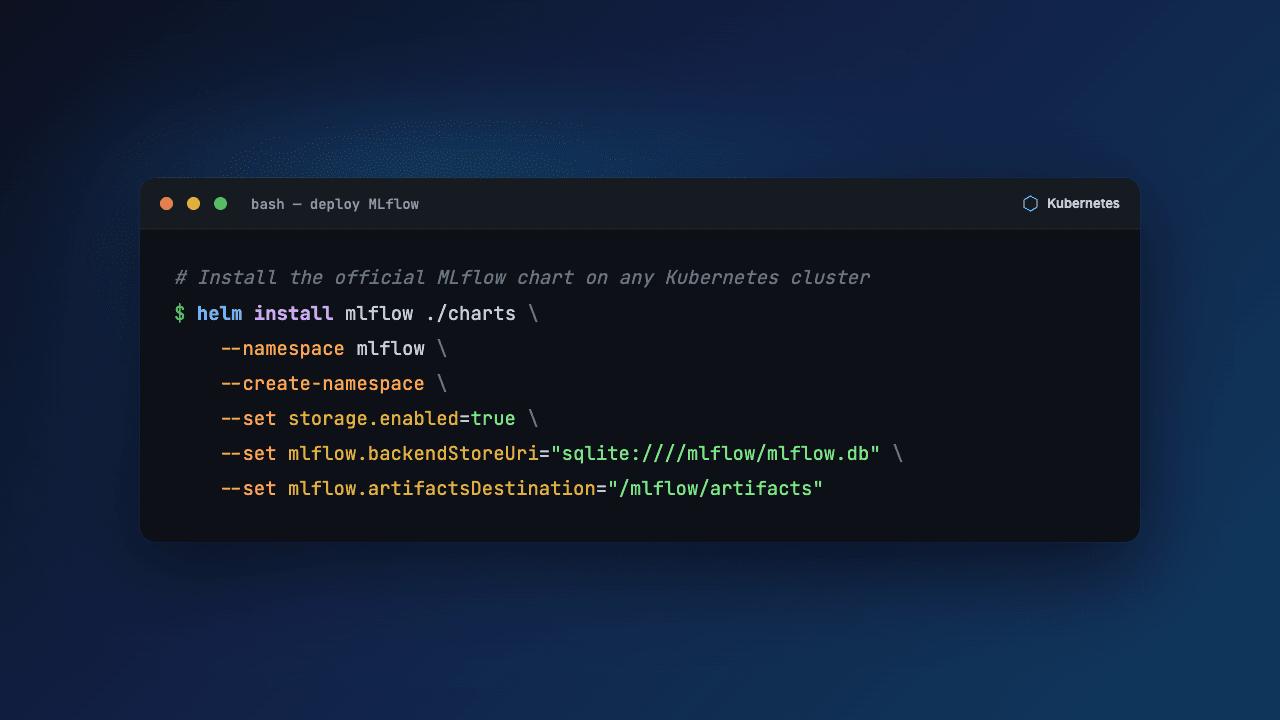
Deploying MLflow on Kubernetes used to mean writing and maintaining your own manifests. An official, production-ready Helm chart now does it for you, with TLS, persistent storage, Ingress, Prometheus metrics, a restrictive NetworkPolicy, RBAC, and optional mlflow gc garbage collection built in. Download the chart and install it (requires Kubernetes 1.23+ and Helm 3.8+):
helm install mlflow ./charts \
  --namespace mlflow \
  --create-namespace \
  --set storage.enabled=true \
  --set mlflow.backendStoreUri="sqlite:////mlflow/mlflow.db" \
  --set mlflow.artifactsDestination="/mlflow/artifacts"
Learn more about the Kubernetes Helm deployment
6. Hermes Agent Support
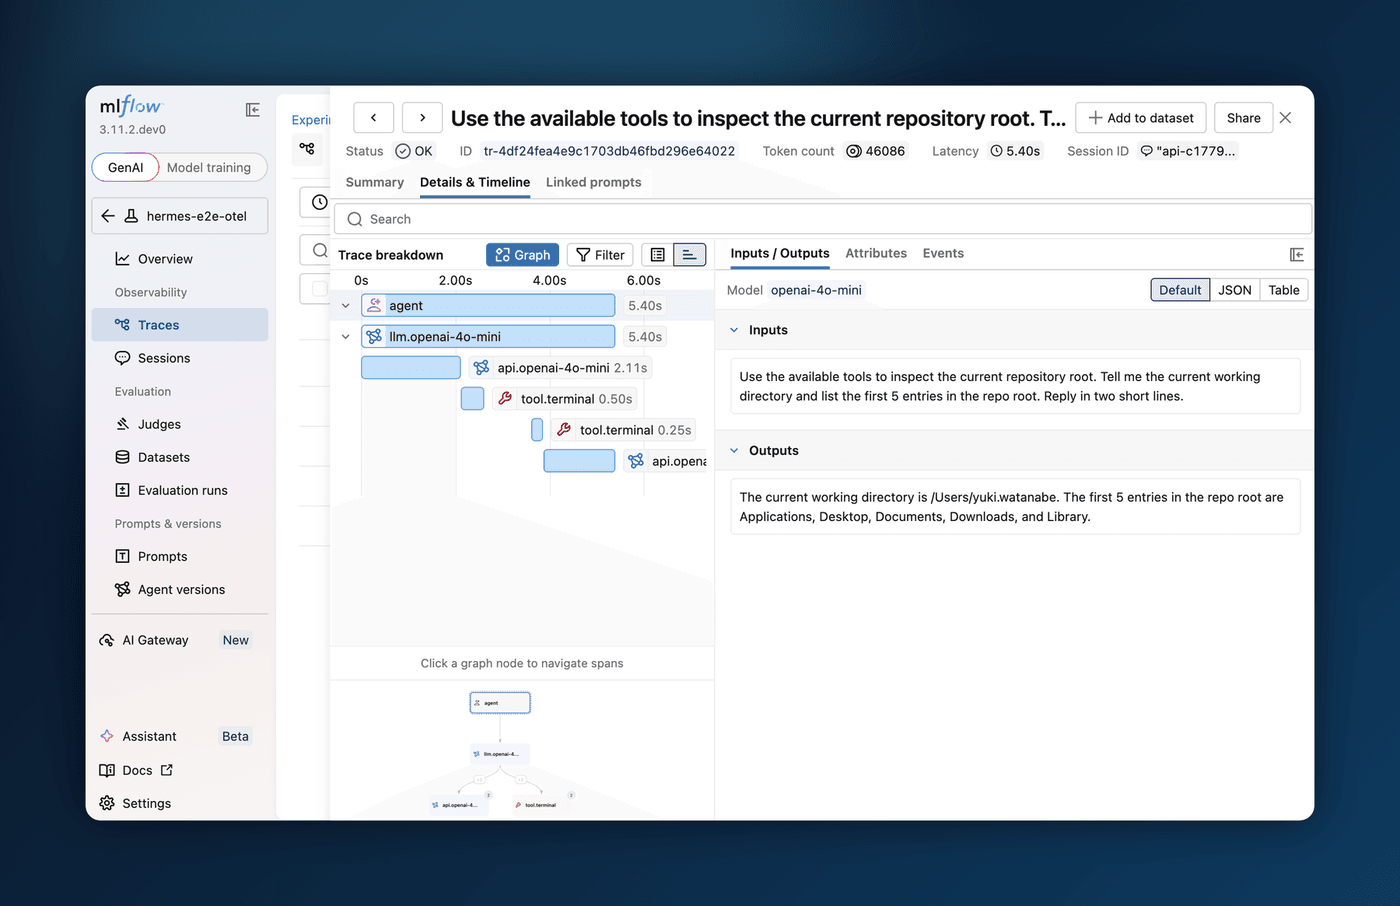
Agent observability now reaches beyond coding agents to long-running autonomous runtimes. Hermes Agent from Nous Research integrates on two surfaces: route its model calls through the AI Gateway for centralized usage tracking, budgets, and guardrails, and capture full end-to-end traces, including LLM calls, tool invocations, and long-running sessions, through MLflow Tracing over OpenTelemetry.
To route Hermes through the Gateway, create an endpoint and run hermes setup model; for tracing, install the community hermes-otel plugin to export OTLP traces to your MLflow server.
Learn more about Hermes Agent and the AI Gateway
7. Log Levels for Trace Spans
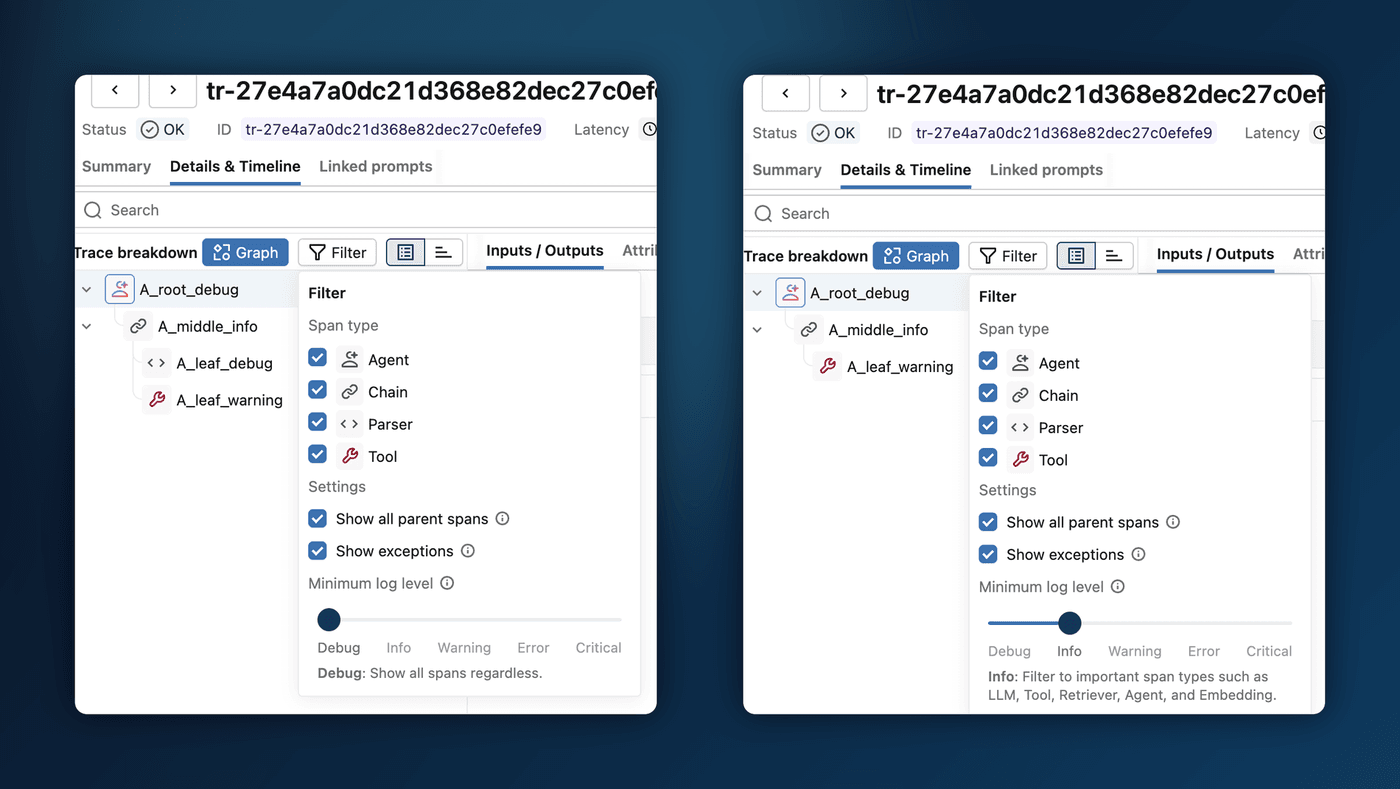
A busy trace can bury the spans you care about under chain plumbing and parser calls. Spans now carry Python-logging-style severity levels (DEBUG through CRITICAL), assigned automatically from the span type, so LLM, tool, and retriever calls surface as INFO while internal steps stay DEBUG, and any span that raises is promoted to ERROR. In the trace explorer, a new Minimum log level slider hides everything below the threshold, with no code changes required. You can also set a level explicitly:
import mlflow

with mlflow.start_span("plumbing", log_level="DEBUG") as span:
    ...
Thanks to community contributor @rrtheonlyone for contributing this feature!
Learn more about span log levels
Full Changelog
For a comprehensive list of changes, see the release change log.
What's Next
Get Started
Upgrade to try these new features:
pip install mlflow==3.13.0
Share Your Feedback
We'd love to hear about your experience with these new features:
- GitHub Issues - Report bugs or request features
- MLflow Roadmap - See what's coming next and share your ideas
- ⭐ Star us on GitHub - Show your support for the project
Learn More
- Check out the MLflow documentation for detailed guides