OpenTelemetry Integration
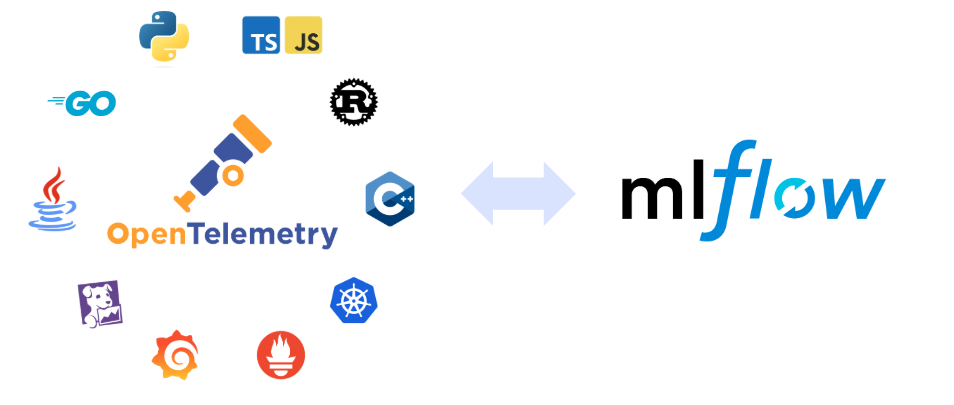
OpenTelemetry is a CNCF-backed project that provides vendor-neutral observability APIs and SDKs to instrument your applications and collect telemetry data in a consistent way. MLflow Tracing is fully compatible with OpenTelemetry, making it free from vendor lock-in.

Ingest OpenTelemetry Traces into MLflow
MLflow Server exposes an OTLP endpoint at /v1/traces. This endpoint allows you to collect traces from applications written in any language that supports the OpenTelemetry protocol, such as Java, Go, Rust, etc.
Export MLflow Traces to OpenTelemetry Backends
Traces generated by the MLflow SDK are fully compatible with the OpenTelemetry trace spec, allowing you to export traces to any observability platform that supports the OpenTelemetry protocol, such as Datadog, Grafana, Prometheus, etc.
Understand Semantic Conventions
MLflow understands popular OpenTelemetry semantic conventions for GenAI, such as GenAI Semantic Conventions, OpenInference, OpenLLMetry, etc. Traces generated with these conventions are treated as first-class citizens in MLflow and can be pipelined to other MLflow features.
OpenTelemetry-native MLflow Tracing SDK
To get started with vendor-neutral tracing quickly, you can use the OpenTelemetry-native MLflow Tracing SDK. The SDK provides a convenient one-line auto-tracing experience for popular LLM and AI agent frameworks and enhances general OpenTelemetry traces with rich AI-specific metadata such as prompts, token usage, model name, etc. See Quickstart to get started with the MLflow Tracing SDK.
import mlflow
from openai import OpenAI

mlflow.openai.autolog()

client = OpenAI()
response = client.responses.create(model="gpt-5", input="Hello, world!")
The MLflow Tracing SDK also works seamlessly with applications already instrumented with OpenTelemetry. Enhance your existing telemetry for HTTP frameworks, databases, network calls, etc., with MLflow's AI tracing capabilities.
Ingest OpenTelemetry Traces into MLflow
MLflow Server exposes an OTLP endpoint at /v1/traces (OTLP). This endpoint allows you to collect traces from applications written in any language that supports the OpenTelemetry protocol, such as Java, Go, Rust, etc.
See Collect OpenTelemetry Traces into MLflow for more details on how to collect traces into MLflow Server.
Export MLflow Traces/Metrics via OTLP
MLflow traces and metrics can be exported to other OpenTelemetry-compatible backends such as Datadog, Grafana, Prometheus, etc., to integrate with your existing observability platform. You can also use dual export to send traces to both MLflow and an OpenTelemetry-compatible backend simultaneously.
See Export MLflow Traces/Metrics via OTLP for more details.