Tracing Microsoft Agent Framework
MLflow Tracing provides automatic tracing capability for Microsoft Agent Framework, a flexible and modular AI agents framework developed by Microsoft. MLflow supports tracing for Microsoft Agent Framework through the OpenTelemetry integration.
Step 1: Install libraries
pip install 'mlflow[genai]>=3.6.0' agent-framework opentelemetry-exporter-otlp-proto-http
Step 2: Start the MLflow Tracking Server
Start the MLflow Tracking Server with a SQL-based backend store:
mlflow server --backend-store-uri sqlite:///mlflow.db --port 5000
This example uses SQLite as the backend store. To use other types of SQL databases such as PostgreSQL, MySQL, and MSSQL, change the store URI as described in the backend store documentation. OpenTelemetry ingestion is not supported with file-based backend stores.
Step 3: Configure OpenTelemetry
Configure the OpenTelemetry tracer to export traces to the MLflow Tracking Server endpoint.
- Set the endpoint to the MLflow Tracking Server's
/v1/tracesendpoint (OTLP). - Set the
x-mlflow-experiment-idheader to the MLflow experiment ID. If you don't have an experiment ID, create it from Python SDK or the MLflow UI.
from agent_framework.observability import setup_observability
from opentelemetry.exporter.otlp.proto.http.trace_exporter import OTLPSpanExporter

# Create the OTLP span exporter with endpoint and headers
MLFLOW_TRACKING_URI = "http://localhost:5000"
MLFLOW_EXPERIMENT_ID = "1234567890"
OTEL_EXPORTER_OTLP_ENDPOINT = f"{MLFLOW_TRACKING_URI}/v1/traces"
OTEL_EXPORTER_OTLP_HEADERS = {"x-mlflow-experiment-id": MLFLOW_EXPERIMENT_ID}

exporter = OTLPSpanExporter(
    endpoint=OTEL_EXPORTER_OTLP_ENDPOINT, headers=OTEL_EXPORTER_OTLP_HEADERS
)
# enable_sensitive_data=True is required for recording LLM inputs and outputs.
setup_observability(enable_sensitive_data=True, exporters=[exporter])
Step 4: Run the Agent
Define and invoke the agent in a Python script like agent.py as usual. Microsoft Agent Framework will generate traces for your agent and send them to the MLflow Tracking Server endpoint.
import asyncio
from pydantic import Field
from random import randint
from typing import Annotated

from agent_framework.openai import OpenAIAssistantsClient


def get_weather(
    location: Annotated[str, Field(description="The location to get the weather for.")],
) -> str:
    """Get the weather for a given location."""
    conditions = ["sunny", "cloudy", "rainy", "stormy"]
    return f"The weather in {location} is {conditions[randint(0, 3)]} with a high of {randint(10, 30)}°C."


async def main():
    async with OpenAIAssistantsClient(model_id="gpt-4o-mini").create_agent(
        instructions="You are a helpful weather agent.",
        tools=get_weather,
    ) as agent:
        query = "What's the weather like in Seattle?"
        print(f"User: {query}")
        result = await agent.run(query)
        print(f"Agent: {result}\n")


# Comment this out if you are using notebook.
if __name__ == "__main__":
    asyncio.run(main())
Run the script to invoke the agent.
python agent.py
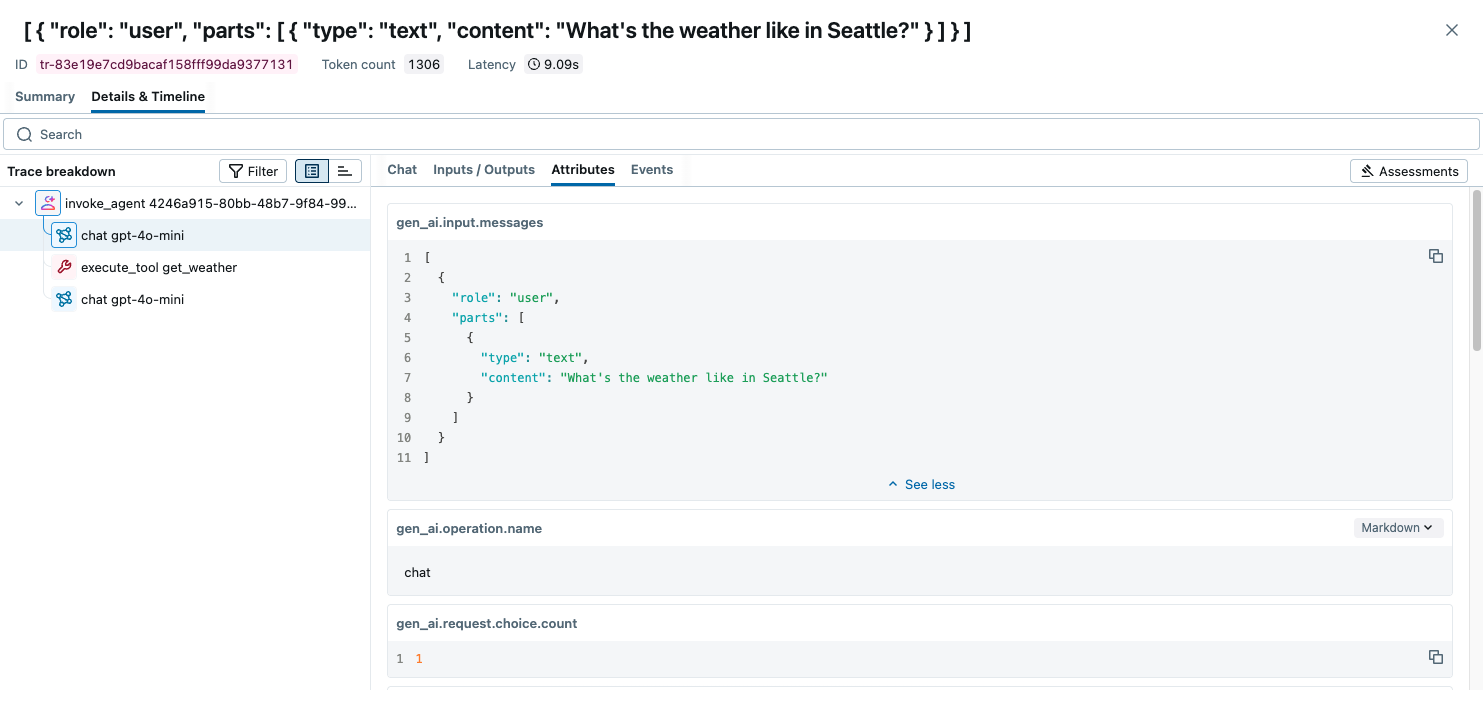
Open the MLflow UI at http://localhost:5000 and navigate to the experiment to see the traces.
Combine with the MLflow Tracing SDK
Since this integration is built on OpenTelemetry, you can combine the automatically generated traces with the MLflow Tracing SDK to add custom spans, set tags, and log assessments within the same trace. This is useful when you want to enrich the auto-generated traces with additional application-specific context.
To enable this, set the MLFLOW_USE_DEFAULT_TRACER_PROVIDER environment variable to false and call mlflow.tracing.set_destination() to merge spans from both SDKs into a single trace.
import os

os.environ["MLFLOW_USE_DEFAULT_TRACER_PROVIDER"] = "false"

import mlflow
from mlflow.entities.trace_location import MlflowExperimentLocation

mlflow.set_tracking_uri("http://localhost:5000")
exp_id = mlflow.set_experiment("Microsoft Agent Framework").experiment_id
mlflow.tracing.set_destination(MlflowExperimentLocation(exp_id))

# Add custom MLflow spans alongside the auto-generated traces
with mlflow.start_span("custom_step") as span:
    span.set_inputs({"query": "test"})
    # your application logic here
    span.set_outputs({"result": "success"})
For detailed instructions and examples, see Combining the OpenTelemetry SDK and the MLflow Tracing SDK.
Next Steps
- Evaluate the Agent: Learn how to evaluate the agent's performance.
- Manage Prompts: Learn how to manage prompts for the agent.
- Automatic Agent Optimization: Learn how to automatically optimize the agent end-to-end with state-of-the-art optimization algorithms.